United States (US) Glass Packaging Market (2026-2032) Outlook | Size, Analysis, Forecast, Companies, Growth, Revenue, Industry, Trends, Share & Value
Market Forecast By Glass Type (Type I, Type II, Type III, Others), By Jar Size (20-50 Ml, 51-100 Ml, 101-250 Ml, 251-500 Ml, 500 Ml), By Raw Material (Cullet, Selenium, Cobalt Oxide, Limestone, Dolomite, Coloring Material, Others), By Application (Alcoholic Beverage, Non-alcoholic Beverage, Food, Pharmaceuticals, Personal Care, Beauty Products, Others) And Competitive Landscape
| Product Code: ETC423837 | Publication Date: Oct 2022 | Updated Date: Jul 2026 | Product Type: Market Research Report | |
| Publisher: 6Wresearch | Author: Ravi Bhandari | No. of Pages: 75 | No. of Figures: 35 | No. of Tables: 20 |
United States (US) Glass Packaging Market Size, Share & Growth Rate
The United States (US) Glass Packaging Market was estimated at USD 203 Million in 2025 and is projected to reach USD 239 Million by 2032, growing at a CAGR of 2.4% from 2026 to 2032. This anticipated growth is fueled by the increasing consumer demand for sustainable packaging solutions that ensure product integrity and reduce environmental impact. Moreover, the rise of premium products across various sectors further supports this upward trajectory, as brands seek high-quality, visually appealing packaging to enhance their market presence.
United States (US) Glass Packaging Market Year-wise Growth Rate and Key Drivers
This graph highlights how the United States (US) Glass Packaging Market has steadily grown over the years, supported by major growth factors.
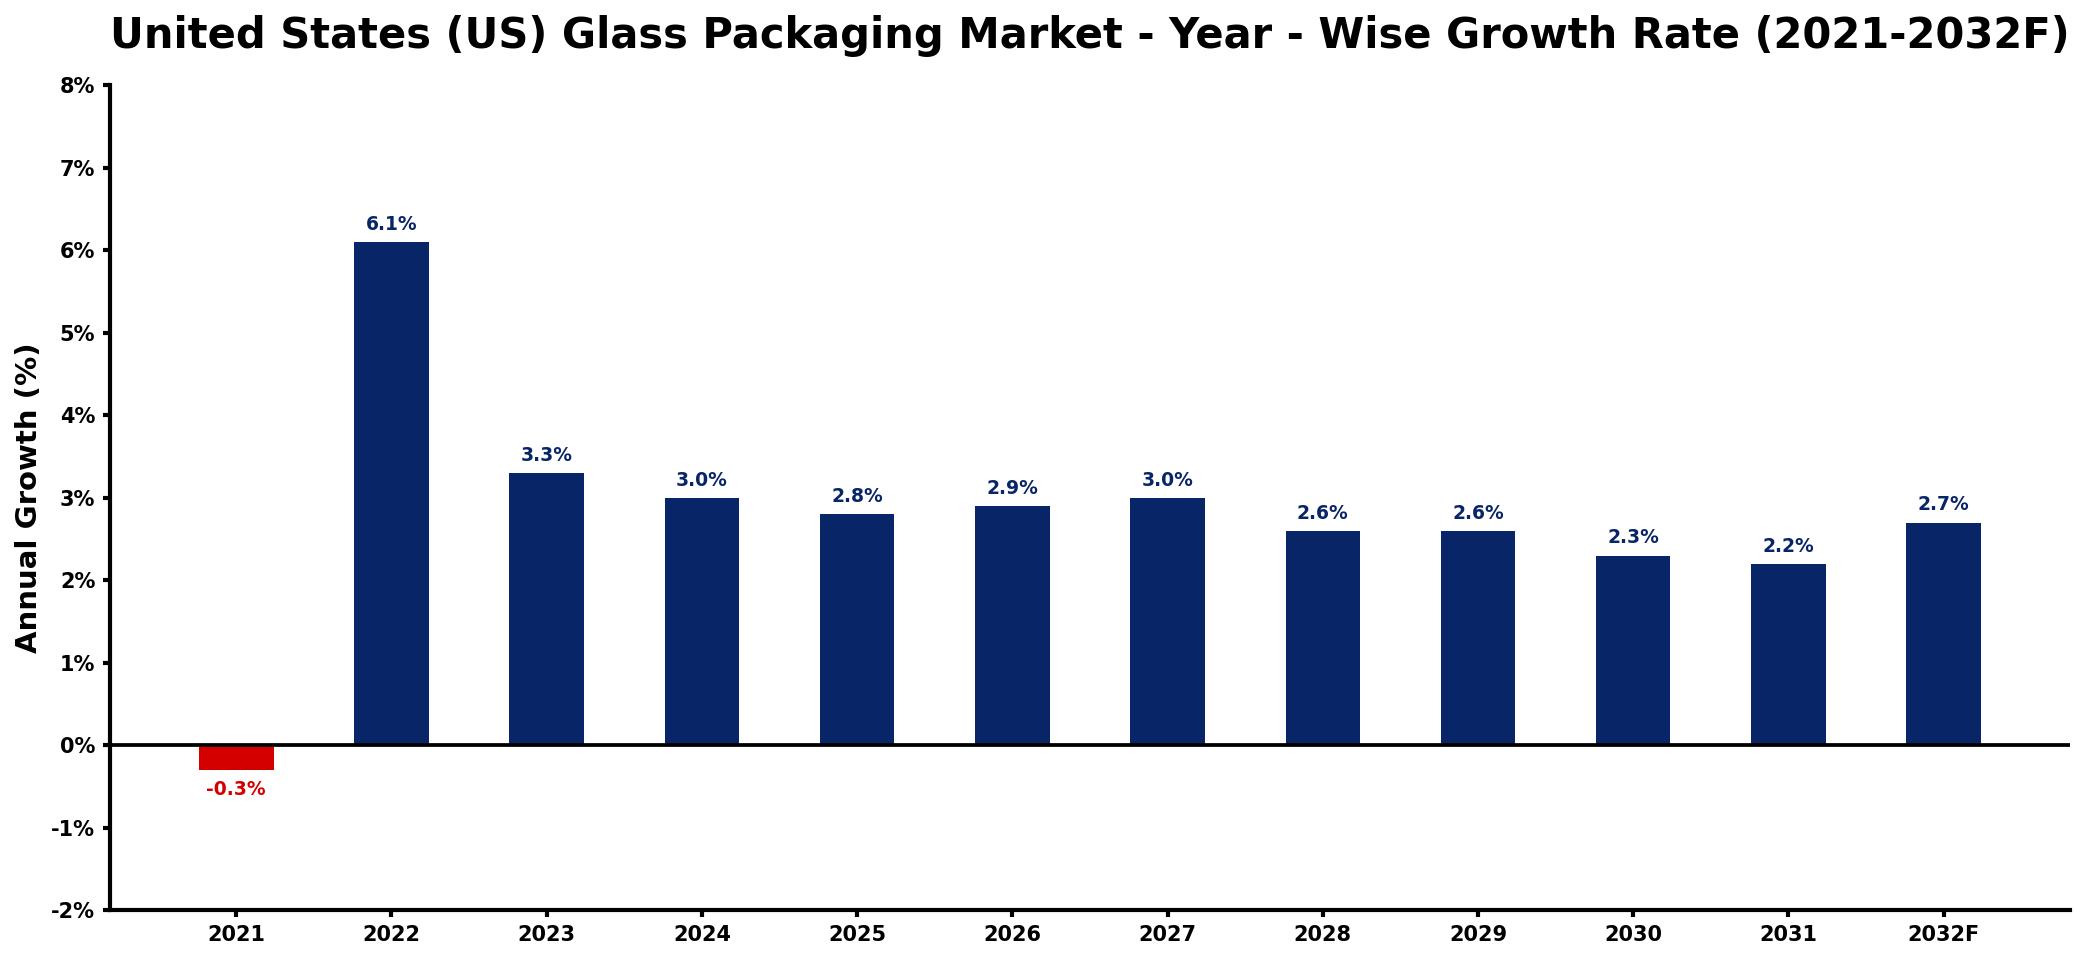
The table below presents the year‑wise growth rates along with the key drivers influencing the market
| Year | Growth Rate | Major Drivers |
| 2021 | -0.3% | decrease in consumer spending habits |
| 2022 | 6.1% | rise in eco-friendly alternatives |
| 2023 | 3.3% | increased demand from beverage sector |
| 2024 | 3.0% | expansion of retail distribution networks |
| 2025 | 2.8% | growing interest in sustainable solutions |
| 2026 | 2.9% | investments in recycling technologies |
| 2027 | 3.0% | surge in e-commerce sales growth |
| 2028 | 2.6% | increased production capabilities expansion |
| 2029 | 2.6% | higher adoption of premium products |
| 2030 | 2.3% | enhanced focus on brand differentiation |
| 2031 | 2.2% | growth driven by health trends |
| 2032 | 2.7% | innovations in design and aesthetics |
Note: Market size estimations and growth projections presented in this report are based on 6Wresearch's proprietary forecasting methodology, utilizing the latest available industry data, government publications, and primary research inputs.
United States (US) Glass Packaging Market Synopsis
The US Glass Packaging Market is characterized by a strong preference for recyclable materials, particularly as consumers become more health-conscious and environmentally aware. Glass packaging's inert nature ensures that it does not interact with contents, making it a safe choice for food, beverages, and pharmaceuticals, thereby enhancing its appeal.
In this mature market, the diversity of applications spans across food and beverages, pharmaceuticals, cosmetics, and various other sectors. The industry is marked by innovation, with companies adopting advanced manufacturing techniques to produce lighter yet robust glass containers that meet the demands of contemporary consumers.
United States (US) Glass Packaging Market Key Takeaways
- The shift towards sustainable packaging solutions drives increasing demand for glass products.
- Technological advancements enable innovative designs and lightweight options, appealing to eco-conscious consumers.
- Premiumization trends in the food and beverage sector boost the popularity of aesthetically pleasing glass packaging.
- Regulatory frameworks support recycling initiatives, enhancing the sustainability of glass packaging.
- Logistical challenges persist due to glass's weight and fragility, impacting distribution strategies.
Evaluation of Restraints in United States (US) Glass Packaging Market
Despite its advantages, the US Glass Packaging Market grapples with significant restraints that hinder growth. Competition from alternative materials, particularly plastics and metals, presents a formidable challenge as these materials often offer lower production costs and lighter weights. Additionally, fluctuating raw material prices can impact profitability and operational efficiency. The heavier weight of glass packaging also leads to increased transportation costs, complicating distribution efforts. Furthermore, a growing consumer preference for convenience can divert attention away from traditional glass products, necessitating innovation and adaptation from manufacturers.
United States (US) Glass Packaging Market Trends
The US Glass Packaging Market is witnessing notable trends that reflect changing consumer preferences and technological advancements. Sustainable packaging is at the forefront, as both consumers and brands increasingly prioritize eco-friendly options. Premiumization has also emerged, with consumers gravitating towards high-quality glass packaging that enhances product appeal, particularly in the craft beverage and luxury cosmetic segments. Furthermore, the rise of e-commerce necessitates innovative packaging solutions to ensure safe delivery, prompting manufacturers to rethink design and functionality in glass packaging.
United States (US) Glass Packaging Market Opportunities
Investment opportunities in the US Glass Packaging Market are abundant, especially as the demand for sustainable solutions escalates. Companies that prioritize eco-friendly practices and capitalize on technological advancements in manufacturing are positioned to thrive. The increasing focus on environmental issues encourages industries such as food and beverage, pharmaceuticals, and cosmetics to opt for glass packaging due to its recyclability and reusability. This opens doors for new entrants and existing players to innovate and meet evolving consumer expectations.
Government Initiatives in the United States (US) Glass Packaging Market
The US government has established several policies aimed at fostering sustainable practices within the glass packaging market. The Environmental Protection Agency (EPA) plays a pivotal role in regulating the production and disposal of glass packaging, ensuring compliance with environmental standards. Furthermore, the Food and Drug Administration (FDA) oversees safety and labeling requirements in the food and beverage sector. The government also supports recycling initiatives through programs that encourage the use of recycled glass and aim to minimize waste in the packaging industry.
Future Insights of the United States (US) Glass Packaging Market
Looking ahead to 2026-2032, the future of the US Glass Packaging Market appears promising, driven by an ongoing demand for sustainable and eco-friendly options. As environmental concerns continue to rise, glass packaging's inherent qualities, such as recyclability and product preservation, position it favorably against competing materials. Innovations in manufacturing and design will likely enhance its appeal, paving the way for new applications and market segments. Overall, the market is expected to flourish as it adapts to shifting consumer preferences and regulatory trends.
United States (US) Glass Packaging Market Latest Developments (2025 - 2026)
In the recent months, the US Glass Packaging Market has seen significant industry shifts focused on sustainability and innovation. Many manufacturers are increasingly adopting advanced technologies to enhance the recyclability and durability of their glass products. Additionally, collaborations between companies and environmental organizations have emerged, aimed at promoting recycling initiatives and reducing waste. The demand for aesthetically appealing packaging has also spurred creative design approaches, ensuring that glass products not only meet functional needs but also captivate consumers.
United States (US) Glass Packaging Market - Key Attractiveness of the Report
- 10 Years of Market Numbers
- Historical Data Starting from 2022 to 2025
- Base Year: 2025
- Forecast Data until 2032
- Key Performance Indicators Impacting the Market
- Major Upcoming Developments and Projects
Key Highlights of the Report:
- United States (US) Glass Packaging Market Outlook
- Market Size of United States (US) Glass Packaging Market, 2025
- Forecast of United States (US) Glass Packaging Market, 2032
- Historical Data and Forecast of United States (US) Glass Packaging Revenues & Volume for the Period 2022-2032F
- United States (US) Glass Packaging Market Trend Evolution
- United States (US) Glass Packaging Market Drivers and Challenges
- United States (US) Glass Packaging Price Trends
- United States (US) Glass Packaging Porter's Five Forces
- United States (US) Glass Packaging Industry Life Cycle
- Historical Data and Forecast of United States (US) Glass Packaging Market Revenues & Volume By Glass Type for the Period 2022-2032F
- Historical Data and Forecast of United States (US) Glass Packaging Market Revenues & Volume By Type I for the Period 2022-2032F
- Historical Data and Forecast of United States (US) Glass Packaging Market Revenues & Volume By Type II for the Period 2022-2032F
- Historical Data and Forecast of United States (US) Glass Packaging Market Revenues & Volume By Type III for the Period 2022-2032F
- Historical Data and Forecast of United States (US) Glass Packaging Market Revenues & Volume By Others for the Period 2022-2032F
- Historical Data and Forecast of United States (US) Glass Packaging Market Revenues & Volume By Jar Size for the Period 2022-2032F
- Historical Data and Forecast of United States (US) Glass Packaging Market Revenues & Volume By 20-50 Ml for the Period 2022-2032F
- Historical Data and Forecast of United States (US) Glass Packaging Market Revenues & Volume By 51-100 Ml for the Period 2022-2032F
- Historical Data and Forecast of United States (US) Glass Packaging Market Revenues & Volume By 101-250 Ml for the Period 2022-2032F
- Historical Data and Forecast of United States (US) Glass Packaging Market Revenues & Volume By 251-500 Ml for the Period 2022-2032F
- Historical Data and Forecast of United States (US) Glass Packaging Market Revenues & Volume By 500 Ml for the Period 2022-2032F
- Historical Data and Forecast of United States (US) Glass Packaging Market Revenues & Volume By Raw Material for the Period 2022-2032F
- Historical Data and Forecast of United States (US) Glass Packaging Market Revenues & Volume By Cullet for the Period 2022-2032F
- Historical Data and Forecast of United States (US) Glass Packaging Market Revenues & Volume By Selenium for the Period 2022-2032F
- Historical Data and Forecast of United States (US) Glass Packaging Market Revenues & Volume By Cobalt Oxide for the Period 2022-2032F
- Historical Data and Forecast of United States (US) Glass Packaging Market Revenues & Volume By Limestone for the Period 2022-2032F
- Historical Data and Forecast of United States (US) Glass Packaging Market Revenues & Volume By Dolomite for the Period 2022-2032F
- Historical Data and Forecast of United States (US) Glass Packaging Market Revenues & Volume By Coloring Material for the Period 2022-2032F
- Historical Data and Forecast of United States (US) Glass Packaging Market Revenues & Volume By Others for the Period 2022-2032F
- Historical Data and Forecast of United States (US) Glass Packaging Market Revenues & Volume By Application for the Period 2022-2032F
- Historical Data and Forecast of United States (US) Glass Packaging Market Revenues & Volume By Alcoholic Beverage for the Period 2022-2032F
- Historical Data and Forecast of United States (US) Glass Packaging Market Revenues & Volume By Non-alcoholic Beverage for the Period 2022-2032F
- Historical Data and Forecast of United States (US) Glass Packaging Market Revenues & Volume By Food for the Period 2022-2032F
- Historical Data and Forecast of United States (US) Glass Packaging Market Revenues & Volume By Pharmaceuticals for the Period 2022-2032F
- Historical Data and Forecast of United States (US) Glass Packaging Market Revenues & Volume By Personal Care for the Period 2022-2032F
- Historical Data and Forecast of United States (US) Glass Packaging Market Revenues & Volume By Beauty Products for the Period 2022-2032F
- Historical Data and Forecast of United States (US) Glass Packaging Market Revenues & Volume By Others for the Period 2022-2032F
- United States (US) Glass Packaging Import Export Trade Statistics
- Market Opportunity Assessment By Glass Type
- Market Opportunity Assessment By Jar Size
- Market Opportunity Assessment By Raw Material
- Market Opportunity Assessment By Application
- United States (US) Glass Packaging Top Companies Market Share
- United States (US) Glass Packaging Competitive Benchmarking By Technical and Operational Parameters
- United States (US) Glass Packaging Company Profiles
- United States (US) Glass Packaging Key Strategic Recommendations
Frequently Asked Questions About the Market Study (FAQs):
The United States Glass Packaging Market was estimated at USD 203 Million in 2025 and is projected to reach USD 239 Million by 2032, growing at a CAGR of 2.4% from 2026 to 2032.
As consumers increasingly prioritize sustainability, there is a marked shift towards glass packaging, which is perceived as a more eco-friendly option compared to plastics. This trend has led brands to invest in high-quality glass products to attract conscious consumers.
Government policies focus on regulating production and encouraging recycling initiatives, thus enhancing the sustainability of glass packaging. Programs led by agencies like the EPA and FDA are crucial in ensuring environmental standards and safety for consumers.
The food and beverage, pharmaceutical, and cosmetics sectors are major contributors to the glass packaging demand, propelled by a growing consumer inclination towards premium, sustainable packaging solutions.
The industry faces competition from alternative packaging materials such as plastics, along with challenges related to raw material price fluctuations and transportation costs due to glass's weight and fragility.
6Wresearch actively monitors the United States (US) Glass Packaging Market and publishes its comprehensive annual report, highlighting emerging trends, growth drivers, revenue analysis, and forecast outlook. Our insights help businesses to make data-backed strategic decisions with ongoing market dynamics. Our analysts track relevent industries related to the United States (US) Glass Packaging Market, allowing our clients with actionable intelligence and reliable forecasts tailored to emerging regional needs.
Yes, we provide customisation as per your requirements. To learn more, feel free to contact us on sales@6wresearch.com
1 Executive Summary |
2 Introduction |
2.1 Key Highlights of the Report |
2.2 Report Description |
2.3 Market Scope & Segmentation |
2.4 Research Methodology |
2.5 Assumptions |
3 United States (US) Glass Packaging Market Overview |
3.1 United States (US) Country Macro Economic Indicators |
3.2 United States (US) Glass Packaging Market Revenues & Volume, 2022 & 2032F |
3.3 United States (US) Glass Packaging Market - Industry Life Cycle |
3.4 United States (US) Glass Packaging Market - Porter's Five Forces |
3.5 United States (US) Glass Packaging Market Revenues & Volume Share, By Glass Type, 2022 & 2032F |
3.6 United States (US) Glass Packaging Market Revenues & Volume Share, By Jar Size, 2022 & 2032F |
3.7 United States (US) Glass Packaging Market Revenues & Volume Share, By Raw Material, 2022 & 2032F |
3.8 United States (US) Glass Packaging Market Revenues & Volume Share, By Application, 2022 & 2032F |
4 United States (US) Glass Packaging Market Dynamics |
4.1 Impact Analysis |
4.2 Market Drivers |
4.2.1 Increasing consumer preference for sustainable and eco-friendly packaging solutions |
4.2.2 Growth in the food and beverage industry, leading to higher demand for glass packaging |
4.2.3 Innovation in glass packaging design and technology |
4.3 Market Restraints |
4.3.1 Competition from alternative packaging materials such as plastic and aluminum |
4.3.2 Fluctuating raw material prices impacting production costs |
4.3.3 Regulatory challenges related to recycling and waste management |
5 United States (US) Glass Packaging Market Trends |
6 United States (US) Glass Packaging Market, By Types |
6.1 United States (US) Glass Packaging Market, By Glass Type |
6.1.1 Overview and Analysis |
6.1.2 United States (US) Glass Packaging Market Revenues & Volume, By Glass Type, 2022-2032F |
6.1.3 United States (US) Glass Packaging Market Revenues & Volume, By Type I, 2022-2032F |
6.1.4 United States (US) Glass Packaging Market Revenues & Volume, By Type II, 2022-2032F |
6.1.5 United States (US) Glass Packaging Market Revenues & Volume, By Type III, 2022-2032F |
6.1.6 United States (US) Glass Packaging Market Revenues & Volume, By Others, 2022-2032F |
6.2 United States (US) Glass Packaging Market, By Jar Size |
6.2.1 Overview and Analysis |
6.2.2 United States (US) Glass Packaging Market Revenues & Volume, By 20-50 Ml, 2022-2032F |
6.2.3 United States (US) Glass Packaging Market Revenues & Volume, By 51-100 Ml, 2022-2032F |
6.2.4 United States (US) Glass Packaging Market Revenues & Volume, By 101-250 Ml, 2022-2032F |
6.2.5 United States (US) Glass Packaging Market Revenues & Volume, By 251-500 Ml, 2022-2032F |
6.2.6 United States (US) Glass Packaging Market Revenues & Volume, By 500 Ml, 2022-2032F |
6.3 United States (US) Glass Packaging Market, By Raw Material |
6.3.1 Overview and Analysis |
6.3.2 United States (US) Glass Packaging Market Revenues & Volume, By Cullet, 2022-2032F |
6.3.3 United States (US) Glass Packaging Market Revenues & Volume, By Selenium, 2022-2032F |
6.3.4 United States (US) Glass Packaging Market Revenues & Volume, By Cobalt Oxide, 2022-2032F |
6.3.5 United States (US) Glass Packaging Market Revenues & Volume, By Limestone, 2022-2032F |
6.3.6 United States (US) Glass Packaging Market Revenues & Volume, By Dolomite, 2022-2032F |
6.3.7 United States (US) Glass Packaging Market Revenues & Volume, By Coloring Material, 2022-2032F |
6.4 United States (US) Glass Packaging Market, By Application |
6.4.1 Overview and Analysis |
6.4.2 United States (US) Glass Packaging Market Revenues & Volume, By Alcoholic Beverage, 2022-2032F |
6.4.3 United States (US) Glass Packaging Market Revenues & Volume, By Non-alcoholic Beverage, 2022-2032F |
6.4.4 United States (US) Glass Packaging Market Revenues & Volume, By Food, 2022-2032F |
6.4.5 United States (US) Glass Packaging Market Revenues & Volume, By Pharmaceuticals, 2022-2032F |
6.4.6 United States (US) Glass Packaging Market Revenues & Volume, By Personal Care, 2022-2032F |
6.4.7 United States (US) Glass Packaging Market Revenues & Volume, By Beauty Products, 2022-2032F |
7 United States (US) Glass Packaging Market Import-Export Trade Statistics |
7.1 United States (US) Glass Packaging Market Export to Major Countries |
7.2 United States (US) Glass Packaging Market Imports from Major Countries |
8 United States (US) Glass Packaging Market Key Performance Indicators |
8.1 Recycling rate of glass packaging materials |
8.2 Adoption rate of reusable glass packaging solutions |
8.3 Investment in research and development for sustainable glass packaging technologies |
9 United States (US) Glass Packaging Market - Opportunity Assessment |
9.1 United States (US) Glass Packaging Market Opportunity Assessment, By Glass Type, 2022 & 2032F |
9.2 United States (US) Glass Packaging Market Opportunity Assessment, By Jar Size, 2022 & 2032F |
9.3 United States (US) Glass Packaging Market Opportunity Assessment, By Raw Material, 2022 & 2032F |
9.4 United States (US) Glass Packaging Market Opportunity Assessment, By Application, 2022 & 2032F |
10 United States (US) Glass Packaging Market - Competitive Landscape |
10.1 United States (US) Glass Packaging Market Revenue Share, By Companies, 2025 |
10.2 United States (US) Glass Packaging Market Competitive Benchmarking, By Operating and Technical Parameters |
11 Company Profiles |
12 Recommendations |
13 Disclaimer |
Global Go To Market Strategy - 2030
Export potential enables firms to identify high-growth global markets with greater confidence by combining advanced trade intelligence with a structured quantitative methodology. The framework analyzes emerging demand trends and country-level import patterns while integrating macroeconomic and trade datasets such as GDP and population forecasts, bilateral import–export flows, tariff structures, elasticity differentials between developed and developing economies, geographic distance, and import demand projections. Using weighted trade values from 2020–2024 as the base period to project country-to-country export potential for 2030, these inputs are operationalized through calculated drivers such as gravity model parameters, tariff impact factors, and projected GDP per-capita growth. Through an analysis of hidden potentials, demand hotspots, and market conditions that are most favorable to success, this method enables firms to focus on target countries, maximize returns, and global expansion with data, backed by accuracy.
By factoring in the projected importer demand gap that is currently unmet and could be potential opportunity, it identifies the potential for the Exporter (Country) among 190 countries, against the general trade analysis, which identifies the biggest importer or exporter.
To discover high-growth global markets and optimize your business strategy:
Click Here
Pricing
- Single User License$ 1,995
- Department License$ 2,400
- Site License$ 3,120
- Global License$ 3,795

Leadership Perspectives from Industry Events
Search
Thought Leadership and Analyst Meet


Our Clients
6WResearch In News
- India Air Conditioner Market Set for Strong Rebound in 2026 After Weather-Led Correction and GST-Driven Recovery: 6Wresearch
- ADAS in India: How Automatic Emergency Braking, Blind Spot Detection & Driver Monitoring are Transforming Road Safety
- Doha a strategic location for EV manufacturing hub: IPA Qatar
- Demand for luxury TVs surging in the GCC, says Samsung
- Empowering Growth: The Thriving Journey of Bangladesh’s Cable Industry
- Demand for luxury TVs surging in the GCC, says Samsung
Latest Reports
- Nicaragua RPG Gaming Market (2026-2032)
- New Zealand RPG Gaming Market (2026-2032)
- Netherlands RPG Gaming Market (2026-2032)
- Nauru RPG Gaming Market (2026-2032)
- Namibia RPG Gaming Market (2026-2032)
- Mozambique RPG Gaming Market (2026-2032)
- Montenegro RPG Gaming Market (2026-2032)
- Mongolia RPG Gaming Market (2026-2032)
- Monaco RPG Gaming Market (2026-2032)
- Micronesia RPG Gaming Market (2026-2032)
Industry Events and Analyst Meet

EV India Expo 2026

HIMTEX 2026

India Refining Summit 2026

India EV Show 2026

EV tech India Expo 2026
Whitepaper
- Middle East & Africa Commercial Security Market Click here to view more.
- Middle East & Africa Fire Safety Systems & Equipment Market Click here to view more.
- GCC Drone Market Click here to view more.
- Middle East Lighting Fixture Market Click here to view more.
- GCC Physical & Perimeter Security Market Click here to view more.