United States (US) Glass Processing Equipment Market (2026-2032) | Revenue, Companies, Share, Analysis, Size, Trends, Growth, Value, Forecast, Outlook & Industry
Market Forecast By Type (Machinery for cutting glass, Machinery for breaking glass, Glass-grinding machine, Glass drilling machine, Others), By End-users (Food & Beverage, Construction, Automotive, Consumer Electronics and Furniture, Others) And Competitive Landscape
| Product Code: ETC047681 | Publication Date: Jan 2021 | Updated Date: Jun 2026 | Product Type: Report | |
| Publisher: 6Wresearch | Author: Shubham Padhi | No. of Pages: 70 | No. of Figures: 35 | No. of Tables: 5 |
United States (US) Glass Processing Equipment Market Size, Share & Growth Rate
The United States (US) Glass Processing Equipment Market was estimated at USD 85 Million in 2025 and is projected to reach USD 100 Million by 2032, growing at a CAGR of 2.3% from 2026 to 2032. This anticipated growth trajectory is largely driven by the burgeoning construction and automotive sectors, which are increasingly demanding sophisticated glass solutions. The continued emphasis on energy efficiency and sustainability in both residential and commercial sectors further supports the market's expansion.
United States (US) Glass Processing Equipment Market Year-wise Growth Rate and Key Drivers
This graph highlights how the United States (US) Glass Processing Equipment Market has steadily grown over the years, supported by major growth factors.
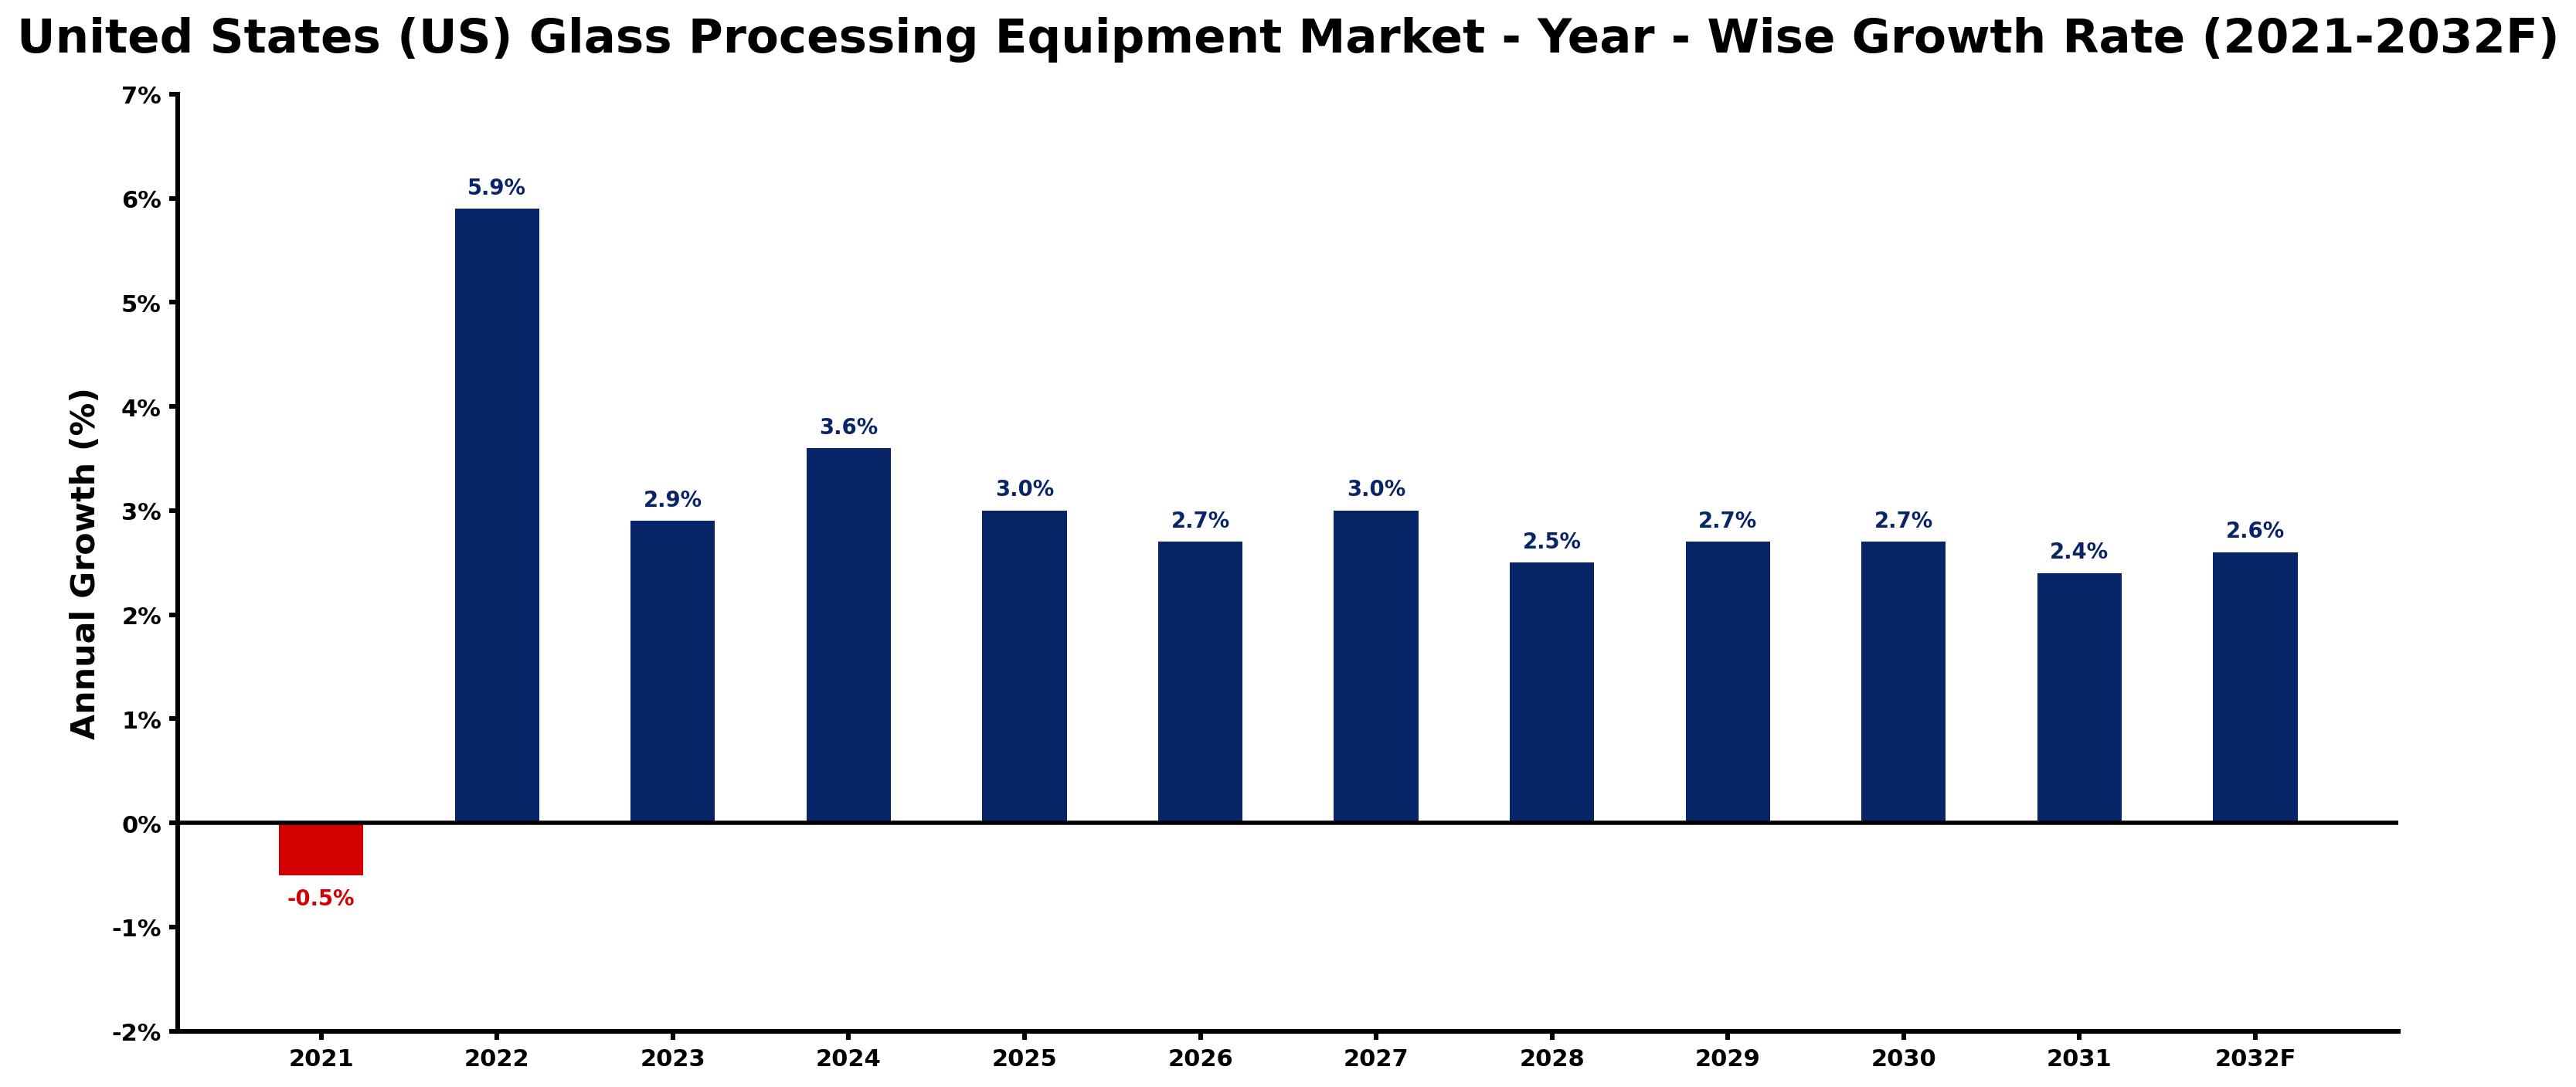
The table below presents the year‑wise growth rates along with the key drivers influencing the market
| Year | Growth Rate | Major Drivers |
| 2021 | -0.5% | Rapid growth in telecom and data center sectors |
| 2022 | 5.9% | Expansion of commercial construction activities |
| 2023 | 2.9% | Rapid growth in telecom and data center sectors |
| 2024 | 3.6% | Increasing industrial infrastructure investments |
| 2025 | 3.0% | Increasing industrial automation investments |
| 2026 | 2.7% | Growing urbanization and commercial development |
| 2027 | 3.0% | Growing urbanization and commercial development |
| 2028 | 2.5% | Government infrastructure modernization initiatives |
| 2029 | 2.7% | Growing urbanization and commercial development |
| 2030 | 2.7% | Increasing adoption of advanced technologies |
| 2031 | 2.4% | Expansion of transportation and logistics networks |
| 2032 | 2.6% | Increasing smart city development projects |
Note - Market size estimations and growth projections presented in this report are based on 6Wresearch’s advanced forecasting approach, validated with industry datasets as of June 2026.
United States (US) Glass Processing Equipment Market Synopsis
The US Glass Processing Equipment Market is currently thriving, bolstered by technological advancements and a growing need for customized glass products. Innovations in automation and digital technologies are reshaping the landscape, enabling companies to increase efficiency and reduce operational costs.
In addition to technology, the market is witnessing a shift towards environmentally friendly practices. As manufacturers adapt to the evolving demands for energy-efficient and high-quality glass, the integration of sustainable solutions has become a competitive advantage.
United States (US) Glass Processing Equipment Market Key Takeaways
- Significant growth potential driven by increasing demand from construction and automotive sectors.
- Technological innovations, including automation and digital solutions, are enhancing production capabilities.
- Environmental sustainability is influencing the design and function of new equipment.
- Customization and adaptability of equipment are critical in meeting diverse market needs.
- Government policies are fostering innovation and competitiveness within the sector.
Evaluation of Restraints in United States (US) Glass Processing Equipment Market
Despite the optimistic outlook, the US Glass Processing Equipment Market faces several constraints. Competition from international manufacturers offering lower-cost solutions can pressure pricing strategies for domestic companies. Additionally, rapid technological advancements necessitate ongoing innovation, demanding substantial investment in research and development. Fluctuating raw material prices pose another hurdle, as they directly impact production costs. Companies must also navigate stringent regulations related to safety and environmental compliance, complicating operational processes. These factors require strategic agility and a commitment to sustainable practices to maintain a competitive edge.
United States (US) Glass Processing Equipment Market Trends
The US Glass Processing Equipment Market is currently experiencing a shift towards increased automation and the integration of digital technologies. Many manufacturers are investing in advanced machinery with capabilities enhanced by AI, IoT, and robotics, which optimize production processes and improve precision. Another significant trend is the growing demand for energy-efficient and environmentally friendly equipment, aligning with broader sustainability initiatives.
Customization has emerged as a key focus area, with equipment designed to cater to specific customer requirements. Additionally, advancements in processing larger glass sizes and thicker materials are gaining traction, reflecting modern architectural demands. These trends suggest a market that is not only evolving but also expanding in response to contemporary challenges and customer expectations.
United States (US) Glass Processing Equipment Market Opportunities
Investment opportunities in the US Glass Processing Equipment Market are robust, particularly as demand rises for advanced glass products across various sectors, including construction and automotive. The emphasis on energy efficiency is creating a pressing need for innovative glass processing solutions. Investments in automation technologies, such as smart cutting systems and precision edging machines, are poised to yield significant returns. Furthermore, the ongoing digital transformation within manufacturing processes paves the way for investments in intelligent equipment, enhancing productivity while catering to the customization demands of modern consumers.
Government Initiatives in the United States (US) Glass Processing Equipment Market
Government policies play a crucial role in shaping the US Glass Processing Equipment Market. Initiatives aimed at fostering innovation and sustainability are prevalent, including tax incentives for companies investing in research and development. Environmental regulations promote the adoption of energy-efficient technologies, encouraging manufacturers to align their practices with sustainability goals. Support for small and medium-sized enterprises is also visible, with programs designed to facilitate access to funding for equipment upgrades and technological advancements. Such government actions help cultivate a conducive environment for market growth while ensuring compliance with industry standards.
Future Insights of the United States (US) Glass Processing Equipment Market
Looking ahead to 2026-2032, the US Glass Processing Equipment Market is poised for steady growth, propelled by increasing demand for processed glass in construction, automotive, and electronics sectors. Technological advancements will likely enhance the efficiency and productivity of glass processing equipment, paving the way for further market expansion. The rising trend towards sustainable materials is expected to elevate the demand for innovative processing solutions, reinforcing the industry's responsiveness to environmental and consumer needs. Moreover, the heightened focus on safety and security in building designs will drive the adoption of specialized glass processing equipment, ensuring a bright future for the market.
United States (US) Glass Processing Equipment Market Latest Developments (May 2025 - June 2026)
Recent developments within the US Glass Processing Equipment Market indicate a strong push towards advanced technologies. Companies are increasingly adopting automation in their production lines, integrating AI and IoT solutions to streamline operations. A notable increase in environmental initiatives is also observed, with manufacturers launching equipment designed to minimize waste and energy consumption. Additionally, customization is becoming a focal point, with various firms responding to unique client specifications, thereby enhancing customer satisfaction and loyalty.
United States (US) Glass Processing Equipment Market - Key Attractiveness of the Report
- 10 Years of Market Numbers
- Historical Data Starting from 2022 to 2025
- Base Year: 2025
- Forecast Data until 2032
- Key Performance Indicators Impacting the Market
- Major Upcoming Developments and Projects
Key Highlights of the Report:
- United States (US) Glass Processing Equipment Market Outlook
- Market Size of United States (US) Glass Processing Equipment Market, 2025
- Forecast of United States (US) Glass Processing Equipment Market, 2032F
- Historical Data and Forecast of United States (US) Glass Processing Equipment Revenues & Volume for the Period 2022-2032F
- United States (US) Glass Processing Equipment Market Trend Evolution
- United States (US) Glass Processing Equipment Market Drivers and Challenges
- United States (US) Glass Processing Equipment Price Trends
- United States (US) Glass Processing Equipment Porter's Five Forces
- United States (US) Glass Processing Equipment Industry Life Cycle
- Historical Data and Forecast of United States (US) Glass Processing Equipment Market Revenues & Volume By Type for the Period 2022-2032F
- Historical Data and Forecast of United States (US) Glass Processing Equipment Market Revenues & Volume By Machinery for cutting glass for the Period 2022-2032F
- Historical Data and Forecast of United States (US) Glass Processing Equipment Market Revenues & Volume By Machinery for breaking glass for the Period 2022-2032F
- Historical Data and Forecast of United States (US) Glass Processing Equipment Market Revenues & Volume By Glass-grinding machine for the Period 2022-2032F
- Historical Data and Forecast of United States (US) Glass Processing Equipment Market Revenues & Volume By Glass drilling machine for the Period 2022-2032F
- Historical Data and Forecast of United States (US) Glass Processing Equipment Market Revenues & Volume By Others for the Period 2022-2032F
- Historical Data and Forecast of United States (US) Glass Processing Equipment Market Revenues & Volume By End-users for the Period 2022-2032F
- Historical Data and Forecast of United States (US) Glass Processing Equipment Market Revenues & Volume By Food & Beverage for the Period 2022-2032F
- Historical Data and Forecast of United States (US) Glass Processing Equipment Market Revenues & Volume By Construction for the Period 2022-2032F
- Historical Data and Forecast of United States (US) Glass Processing Equipment Market Revenues & Volume By Automotive for the Period 2022-2032F
- Historical Data and Forecast of United States (US) Glass Processing Equipment Market Revenues & Volume By Consumer Electronics and Furniture for the Period 2022-2032F
- Historical Data and Forecast of United States (US) Glass Processing Equipment Market Revenues & Volume By Others for the Period 2022-2032F
- United States (US) Glass Processing Equipment Import Export Trade Statistics
- Market Opportunity Assessment By Type
- Market Opportunity Assessment By End-users
- United States (US) Glass Processing Equipment Top Companies Market Share
- United States (US) Glass Processing Equipment Competitive Benchmarking By Technical and Operational Parameters
- United States (US) Glass Processing Equipment Company Profiles
- United States (US) Glass Processing Equipment Key Strategic Recommendations
United States (US) Glass Processing Equipment Market - Frequently Asked Questions
Key growth drivers include the booming construction and automotive sectors, technological advancements in automation, and the increasing demand for energy-efficient products. These factors collectively fuel the market's expansion and demand for innovative processing equipment.
The United States Glass Processing Equipment Market was estimated at USD 85 Million in 2025 and is projected to reach USD 100 Million by 2032, growing at a CAGR of 2.3% from 2026 to 2032. This growth reflects the rising demand for processed glass and advancements in processing technologies.
Current trends include increased automation, the integration of AI and IoT for smarter production, and a strong focus on sustainability. Equipment designed for larger glass sizes and customizable features is becoming increasingly popular.
Government initiatives aimed at promoting innovation and sustainability significantly influence the market. Policies providing tax incentives for R&D and regulations encouraging energy-efficient practices are vital in fostering a competitive environment.
Companies may face challenges such as intense competition from international manufacturers, the need for continuous innovation, and fluctuations in raw material prices. Adhering to stringent environmental regulations also adds complexity to operations.
6Wresearch actively monitors the United States (US) Glass Processing Equipment Market and publishes its comprehensive annual report, highlighting emerging trends, growth drivers, revenue analysis, and forecast outlook. Our insights help businesses to make data-backed strategic decisions with ongoing market dynamics. Our analysts track relevent industries related to the United States (US) Glass Processing Equipment Market, allowing our clients with actionable intelligence and reliable forecasts tailored to emerging regional needs.
Yes, we provide customisation as per your requirements. To learn more, feel free to contact us on sales@6wresearch.com
1 Executive Summary |
2 Introduction |
2.1 Key Highlights of the Report |
2.2 Report Description |
2.3 Market Scope & Segmentation |
2.4 Research Methodology |
2.5 Assumptions |
3 United States (US) Glass Processing Equipment Market Overview |
3.1 United States (US) Country Macro Economic Indicators |
3.2 United States (US) Glass Processing Equipment Market Revenues & Volume, 2022 & 2032F |
3.3 United States (US) Glass Processing Equipment Market - Industry Life Cycle |
3.4 United States (US) Glass Processing Equipment Market - Porter's Five Forces |
3.5 United States (US) Glass Processing Equipment Market Revenues & Volume Share, By Type, 2022 & 2032F |
3.6 United States (US) Glass Processing Equipment Market Revenues & Volume Share, By End-users, 2022 & 2032F |
4 United States (US) Glass Processing Equipment Market Dynamics |
4.1 Impact Analysis |
4.2 Market Drivers |
4.2.1 Increasing demand for energy-efficient glass products in the construction industry |
4.2.2 Technological advancements leading to higher automation and precision in glass processing |
4.2.3 Growing focus on sustainability and recycling in the glass manufacturing sector |
4.3 Market Restraints |
4.3.1 High initial investment cost for advanced glass processing equipment |
4.3.2 Fluctuating raw material prices impacting production costs |
4.3.3 Stringent regulations related to emissions and waste disposal in the glass industry |
5 United States (US) Glass Processing Equipment Market Trends |
6 United States (US) Glass Processing Equipment Market, By Types |
6.1 United States (US) Glass Processing Equipment Market, By Type |
6.1.1 Overview and Analysis |
6.1.2 United States (US) Glass Processing Equipment Market Revenues & Volume, By Type, 2022-2032F |
6.1.3 United States (US) Glass Processing Equipment Market Revenues & Volume, By Machinery for cutting glass, 2022-2032F |
6.1.4 United States (US) Glass Processing Equipment Market Revenues & Volume, By Machinery for breaking glass, 2022-2032F |
6.1.5 United States (US) Glass Processing Equipment Market Revenues & Volume, By Glass-grinding machine, 2022-2032F |
6.1.6 United States (US) Glass Processing Equipment Market Revenues & Volume, By Glass drilling machine, 2022-2032F |
6.1.7 United States (US) Glass Processing Equipment Market Revenues & Volume, By Others, 2022-2032F |
6.2 United States (US) Glass Processing Equipment Market, By End-users |
6.2.1 Overview and Analysis |
6.2.2 United States (US) Glass Processing Equipment Market Revenues & Volume, By Food & Beverage, 2022-2032F |
6.2.3 United States (US) Glass Processing Equipment Market Revenues & Volume, By Construction, 2022-2032F |
6.2.4 United States (US) Glass Processing Equipment Market Revenues & Volume, By Automotive, 2022-2032F |
6.2.5 United States (US) Glass Processing Equipment Market Revenues & Volume, By Consumer Electronics and Furniture, 2022-2032F |
6.2.6 United States (US) Glass Processing Equipment Market Revenues & Volume, By Others, 2022-2032F |
7 United States (US) Glass Processing Equipment Market Import-Export Trade Statistics |
7.1 United States (US) Glass Processing Equipment Market Export to Major Countries |
7.2 United States (US) Glass Processing Equipment Market Imports from Major Countries |
8 United States (US) Glass Processing Equipment Market Key Performance Indicators |
8.1 Energy efficiency improvements in glass processing equipment |
8.2 Adoption rate of advanced automation technologies in the glass processing industry |
8.3 Percentage of recycled glass used in production |
8.4 Research and development investments in sustainable glass processing technologies |
8.5 Compliance with environmental regulations and emission standards |
9 United States (US) Glass Processing Equipment Market - Opportunity Assessment |
9.1 United States (US) Glass Processing Equipment Market Opportunity Assessment, By Type, 2022 & 2032F |
9.2 United States (US) Glass Processing Equipment Market Opportunity Assessment, By End-users, 2022 & 2032F |
10 United States (US) Glass Processing Equipment Market - Competitive Landscape |
10.1 United States (US) Glass Processing Equipment Market Revenue Share, By Companies, 2025 |
10.2 United States (US) Glass Processing Equipment Market Competitive Benchmarking, By Operating and Technical Parameters |
11 Company Profiles |
12 Recommendations |
13 Disclaimer |
Global Go To Market Strategy - 2030
Export potential enables firms to identify high-growth global markets with greater confidence by combining advanced trade intelligence with a structured quantitative methodology. The framework analyzes emerging demand trends and country-level import patterns while integrating macroeconomic and trade datasets such as GDP and population forecasts, bilateral import–export flows, tariff structures, elasticity differentials between developed and developing economies, geographic distance, and import demand projections. Using weighted trade values from 2020–2024 as the base period to project country-to-country export potential for 2030, these inputs are operationalized through calculated drivers such as gravity model parameters, tariff impact factors, and projected GDP per-capita growth. Through an analysis of hidden potentials, demand hotspots, and market conditions that are most favorable to success, this method enables firms to focus on target countries, maximize returns, and global expansion with data, backed by accuracy.
By factoring in the projected importer demand gap that is currently unmet and could be potential opportunity, it identifies the potential for the Exporter (Country) among 190 countries, against the general trade analysis, which identifies the biggest importer or exporter.
To discover high-growth global markets and optimize your business strategy:
Click Here
Pricing
- Single User License$ 1,995
- Department License$ 2,400
- Site License$ 3,120
- Global License$ 3,795

Leadership Perspectives from Industry Events
Search
Thought Leadership and Analyst Meet


Our Clients
6WResearch In News
- India Air Conditioner Market Set for Strong Rebound in 2026 After Weather-Led Correction and GST-Driven Recovery: 6Wresearch
- ADAS in India: How Automatic Emergency Braking, Blind Spot Detection & Driver Monitoring are Transforming Road Safety
- Doha a strategic location for EV manufacturing hub: IPA Qatar
- Demand for luxury TVs surging in the GCC, says Samsung
- Empowering Growth: The Thriving Journey of Bangladesh’s Cable Industry
- Demand for luxury TVs surging in the GCC, says Samsung
Latest Reports
- Nicaragua RPG Gaming Market (2026-2032)
- New Zealand RPG Gaming Market (2026-2032)
- Netherlands RPG Gaming Market (2026-2032)
- Nauru RPG Gaming Market (2026-2032)
- Namibia RPG Gaming Market (2026-2032)
- Mozambique RPG Gaming Market (2026-2032)
- Montenegro RPG Gaming Market (2026-2032)
- Mongolia RPG Gaming Market (2026-2032)
- Monaco RPG Gaming Market (2026-2032)
- Micronesia RPG Gaming Market (2026-2032)
Industry Events and Analyst Meet

EV India Expo 2026

HIMTEX 2026

India Refining Summit 2026

India EV Show 2026

EV tech India Expo 2026
Whitepaper
- Middle East & Africa Commercial Security Market Click here to view more.
- Middle East & Africa Fire Safety Systems & Equipment Market Click here to view more.
- GCC Drone Market Click here to view more.
- Middle East Lighting Fixture Market Click here to view more.
- GCC Physical & Perimeter Security Market Click here to view more.