United States (US) Inactive Dried Yeast Market (2026-2032) Outlook | Value, Analysis, Size, Forecast, Trends, Growth, Revenue, Companies, Share & Industry
Market Forecast By Type (Feed Grade, Food Grade, Pharma Grade), By Application (Food, Fermentation, Health, Feed) And Competitive Landscape
| Product Code: ETC218341 | Publication Date: Aug 2022 | Updated Date: Jul 2026 | Product Type: Market Research Report | |
| Publisher: 6Wresearch | Author: Sumit Sagar | No. of Pages: 75 | No. of Figures: 35 | No. of Tables: 20 |
United States (US) Inactive Dried Yeast Market Size, Share & Growth Rate
The United States (US) Inactive Dried Yeast Market was estimated at USD 227 Million in 2025 and is projected to reach USD 267 Million by 2032, growing at a CAGR of 2.3% from 2026 to 2032. This growth is being propelled by the surge in consumer demand for health-conscious dietary choices and the rising popularity of plant-based protein sources. As consumers increasingly seek clean-label products, inactive dried yeast is becoming a staple ingredient, noted for its nutritional benefits and versatility in various food applications.
United States (US) Inactive Dried Yeast Market Year-wise Growth Rate and Key Drivers
This graph highlights how the United States (US) Inactive Dried Yeast Market has steadily grown over the years, supported by major growth factors.
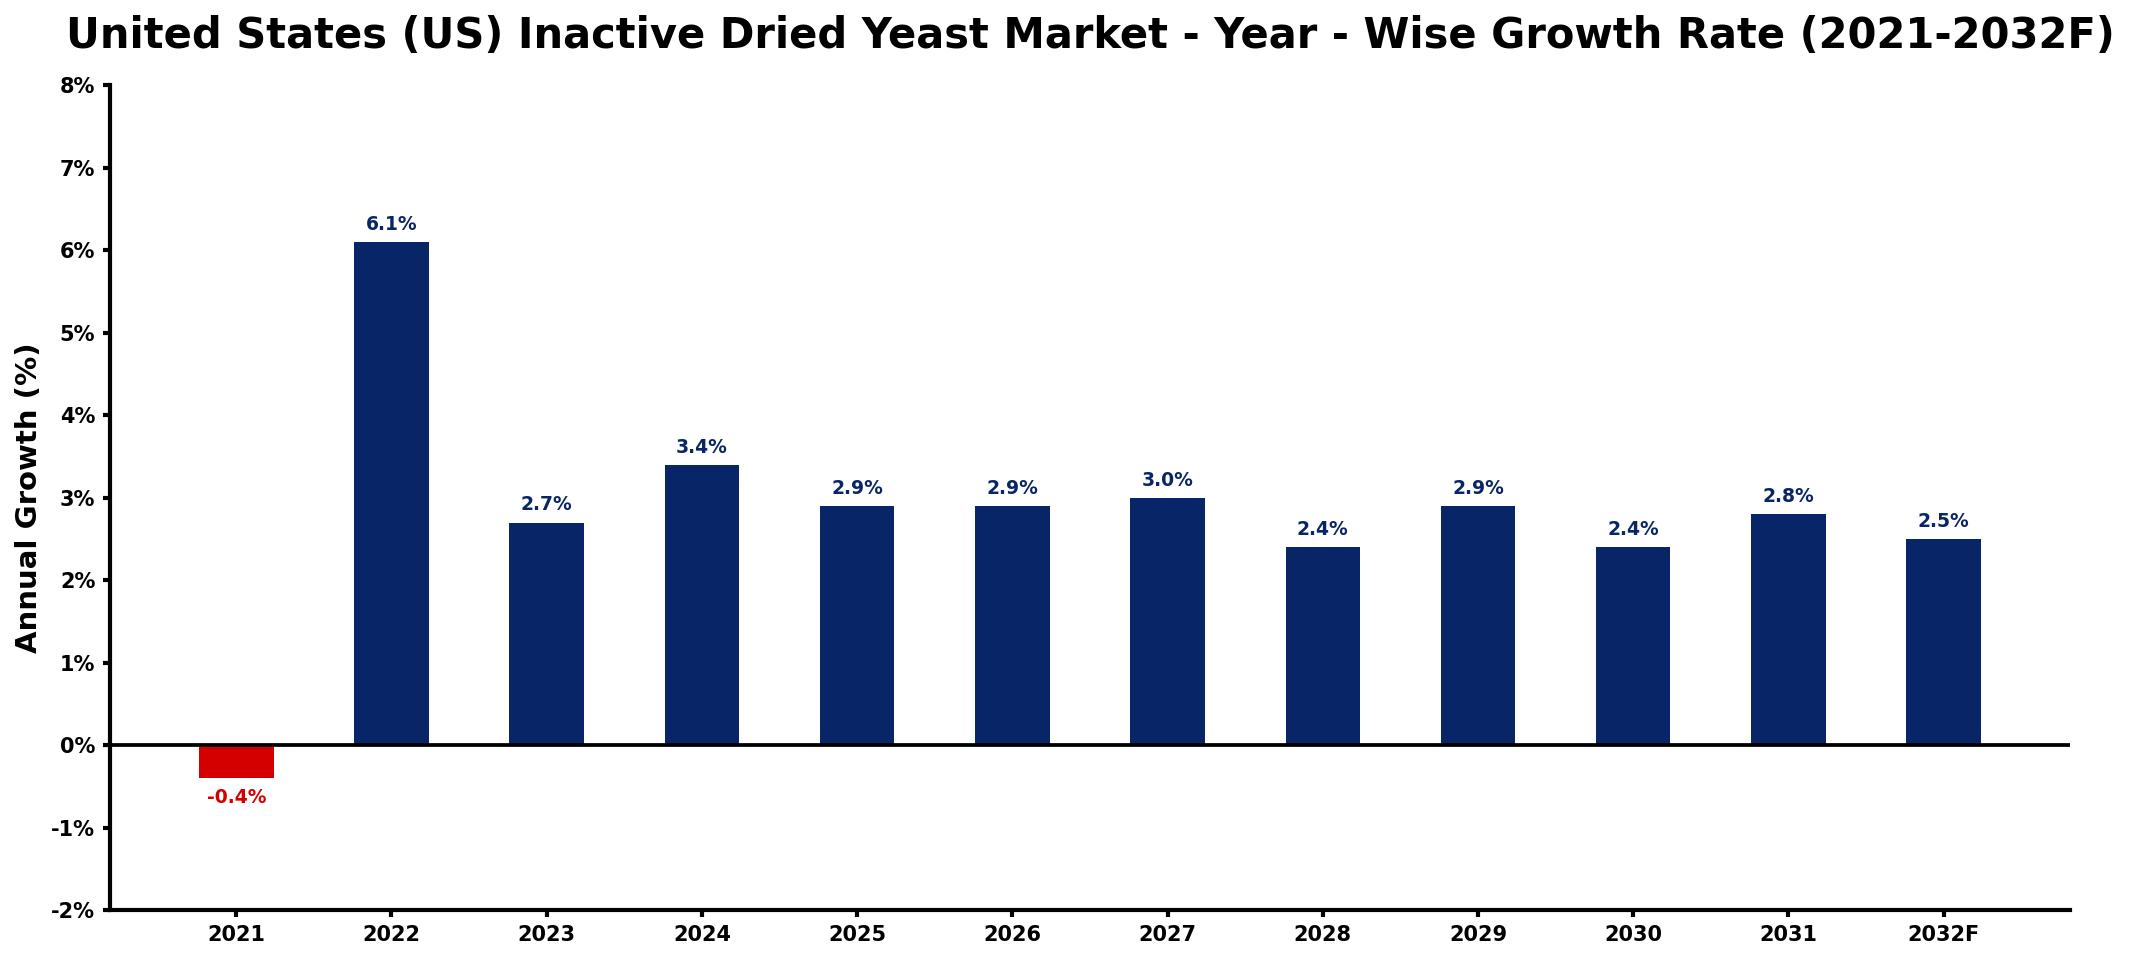
The table below presents the year‑wise growth rates along with the key drivers influencing the market
| Year | Growth Rate | Major Drivers |
| 2021 | -0.4% | Shift towards alternative fermentation methods |
| 2022 | 6.1% | Rising popularity of home baking |
| 2023 | 2.7% | Growth in organic food sector |
| 2024 | 3.4% | Increase in health-conscious consumers |
| 2025 | 2.9% | Expansion of gluten-free products |
| 2026 | 2.9% | Surge in plant-based diets |
| 2027 | 3.0% | Investment in food technology innovations |
| 2028 | 2.4% | Growing demand for artisanal products |
| 2029 | 2.9% | improved raw material availability |
| 2030 | 2.4% | Rising trend of culinary experimentation |
| 2031 | 2.8% | improved processing technologies adoption |
| 2032 | 2.5% | strengthening underlying market demand |
Note: Market size estimations and growth projections presented in this report are based on 6Wresearch's proprietary forecasting methodology, utilizing the latest available industry data, government publications, and primary research inputs.
United States (US) Inactive Dried Yeast Market Synopsis
The United States Inactive Dried Yeast Market is witnessing a notable uptick driven by heightened awareness of its health benefits. Rich in B vitamins, fiber, and protein, inactive dried yeast is increasingly recognized as an essential component for those adopting vegan and vegetarian lifestyles. Its adoption across dietary supplements, bakery products, and clean-label foods underscores its significant role in the health and wellness segment.
Moreover, manufacturers are innovating new product formulations to cater to evolving consumer preferences. The trend toward natural ingredients, combined with the growing inclination towards plant-based diets, positions inactive dried yeast as a vital ingredient in the food and beverage industry, effectively shaping its market landscape.
United States (US) Inactive Dried Yeast Market Key Takeaways
- The market is projected to grow steadily, driven by increasing consumer demand for healthy, plant-based ingredients.
- Inactive dried yeast is gaining traction as a nutrient-rich supplement across various food applications.
- Manufacturers are focused on innovative product development to align with clean-label and natural food trends.
- Consumer education remains crucial to overcoming awareness barriers surrounding inactive dried yeast.
- Investment in R&D and distribution networks will enhance market accessibility and growth potential.
Evaluation of Restraints in United States (US) Inactive Dried Yeast Market
Despite its growth trajectory, the US Inactive Dried Yeast Market faces significant restraints. The increasing competition from alternative protein sources poses a challenge to market share. Furthermore, fluctuating raw material prices can affect production costs, which in turn may hinder profit margins. Consumer preferences continue to evolve, creating a necessity for companies to remain agile and responsive. Compounding these factors are regulatory hurdles related to labeling and health claims, which can complicate market entry for new players and impact existing manufacturers.
United States (US) Inactive Dried Yeast Market Trends
Current trends within the United States Inactive Dried Yeast Market illustrate a growing inclination towards natural and functional foods. With the rise of health-conscious consumers, there is an increasing demand for products that not only enhance flavor but also contribute nutritional value. This trend is further bolstered by advancements in drying technologies that improve product quality and shelf stability. The application of inactive dried yeast in food supplements is also on the rise, driven by consumers seeking innovative ways to incorporate essential nutrients into their diets.
United States (US) Inactive Dried Yeast Market Opportunities
Opportunities for growth in the United States Inactive Dried Yeast Market are promising. With the shift towards plant-based diets, companies can explore expanding their product lines to include inactive dried yeast in new forms, such as fortified snacks and health foods. Additionally, there is significant potential in the animal feed sector, where nutritional yeast can improve dietary formulations. For investors, focusing on innovative product development and leveraging consumer education initiatives presents lucrative opportunities to capitalize on the growing demand for sustainable and natural ingredients.
Government Initiatives in the United States (US) Inactive Dried Yeast Market
Government policies play an influential role in shaping the United States Inactive Dried Yeast Market. Regulatory guidelines set forth by the Food and Drug Administration (FDA) regarding production standards and labeling are critical for market compliance. The Department of Agriculture (USDA) also impacts this market through agricultural policies that govern raw material sourcing and pricing. As sustainability initiatives gain traction, regulations promoting environmentally friendly practices are expected to affect production processes, encouraging a focus on responsible sourcing and manufacturing.
Future Insights of the United States (US) Inactive Dried Yeast Market
Looking ahead to 2026-2032, the United States Inactive Dried Yeast Market is set for sustained expansion. Consumer demand for clean-label and health-enhancing products is anticipated to remain a driving force behind market growth. The increasing appreciation for inactive dried yeasts nutritional benefits, alongside technological advancements in product processing, will facilitate wider adoption across various applications. As the market continues to evolve, companies that prioritize innovation and consumer education will likely lead the way.
United States (US) Inactive Dried Yeast Market Latest Developments (2025 - 2026)
In recent months, the United States Inactive Dried Yeast Market has seen a range of developments as companies ramp up their product offerings. Several manufacturers are enhancing their marketing strategies to better inform consumers about the health benefits of inactive dried yeast. Additionally, research initiatives focused on the enhancement of flavor profiles and nutrient density are gaining momentum. These advancements, coupled with partnerships aimed at broadening distribution channels, are shaping the competitive landscape of the market.
United States (US) Inactive Dried Yeast Market - Key Attractiveness of the Report
- 10 Years of Market Numbers
- Historical Data Starting from 2022 to 2025
- Base Year: 2025
- Forecast Data until 2032
- Key Performance Indicators Impacting the Market
- Major Upcoming Developments and Projects
Key Highlights of the Report:
- United States (US) Inactive Dried Yeast Market Outlook
- Market Size of United States (US) Inactive Dried Yeast Market, 2025
- Forecast of United States (US) Inactive Dried Yeast Market, 2032
- Historical Data and Forecast of United States (US) Inactive Dried Yeast Revenues & Volume for the Period 2022-2032F
- United States (US) Inactive Dried Yeast Market Trend Evolution
- United States (US) Inactive Dried Yeast Market Drivers and Challenges
- United States (US) Inactive Dried Yeast Price Trends
- United States (US) Inactive Dried Yeast Porter's Five Forces
- United States (US) Inactive Dried Yeast Industry Life Cycle
- Historical Data and Forecast of United States (US) Inactive Dried Yeast Market Revenues & Volume By Type for the Period 2022-2032F
- Historical Data and Forecast of United States (US) Inactive Dried Yeast Market Revenues & Volume By Feed Grade for the Period 2022-2032F
- Historical Data and Forecast of United States (US) Inactive Dried Yeast Market Revenues & Volume By Food Grade for the Period 2022-2032F
- Historical Data and Forecast of United States (US) Inactive Dried Yeast Market Revenues & Volume By Pharma Grade for the Period 2022-2032F
- Historical Data and Forecast of United States (US) Inactive Dried Yeast Market Revenues & Volume By Application for the Period 2022-2032F
- Historical Data and Forecast of United States (US) Inactive Dried Yeast Market Revenues & Volume By Food for the Period 2022-2032F
- Historical Data and Forecast of United States (US) Inactive Dried Yeast Market Revenues & Volume By Fermentation for the Period 2022-2032F
- Historical Data and Forecast of United States (US) Inactive Dried Yeast Market Revenues & Volume By Health for the Period 2022-2032F
- Historical Data and Forecast of United States (US) Inactive Dried Yeast Market Revenues & Volume By Feed for the Period 2022-2032F
- United States (US) Inactive Dried Yeast Import Export Trade Statistics
- Market Opportunity Assessment By Type
- Market Opportunity Assessment By Application
- United States (US) Inactive Dried Yeast Top Companies Market Share
- United States (US) Inactive Dried Yeast Competitive Benchmarking By Technical and Operational Parameters
- United States (US) Inactive Dried Yeast Company Profiles
- United States (US) Inactive Dried Yeast Key Strategic Recommendations
Frequently Asked Questions About the Market Study (FAQs):
A growing consumer inclination towards health and wellness, combined with the demand for natural ingredients, is significantly driving the market.
The market is estimated at USD 227 Million in 2025 and projected to reach USD 267 Million by 2032, growing at a CAGR of 2.3% from 2026 to 2032.
Inactive dried yeast is increasingly being incorporated into bakery products, dietary supplements, and food seasonings.
Consumer awareness about the health benefits associated with inactive dried yeast plays a crucial role in its market penetration and growth.
Companies must navigate FDA regulations on labeling and safety standards, which can impact marketing strategies and market entry.
6Wresearch actively monitors the United States (US) Inactive Dried Yeast Market and publishes its comprehensive annual report, highlighting emerging trends, growth drivers, revenue analysis, and forecast outlook. Our insights help businesses to make data-backed strategic decisions with ongoing market dynamics. Our analysts track relevent industries related to the United States (US) Inactive Dried Yeast Market, allowing our clients with actionable intelligence and reliable forecasts tailored to emerging regional needs.
Yes, we provide customisation as per your requirements. To learn more, feel free to contact us on sales@6wresearch.com
1 Executive Summary |
2 Introduction |
2.1 Key Highlights of the Report |
2.2 Report Description |
2.3 Market Scope & Segmentation |
2.4 Research Methodology |
2.5 Assumptions |
3 United States (US) Inactive Dried Yeast Market Overview |
3.1 United States (US) Country Macro Economic Indicators |
3.2 United States (US) Inactive Dried Yeast Market Revenues & Volume, 2022 & 2032F |
3.3 United States (US) Inactive Dried Yeast Market - Industry Life Cycle |
3.4 United States (US) Inactive Dried Yeast Market - Porter's Five Forces |
3.5 United States (US) Inactive Dried Yeast Market Revenues & Volume Share, By Type, 2022 & 2032F |
3.6 United States (US) Inactive Dried Yeast Market Revenues & Volume Share, By Application, 2022 & 2032F |
4 United States (US) Inactive Dried Yeast Market Dynamics |
4.1 Impact Analysis |
4.2 Market Drivers |
4.2.1 Increasing consumer preference for natural and clean label food products |
4.2.2 Growing demand for functional ingredients in food and beverage industry |
4.2.3 Rising awareness about health benefits associated with inactive dried yeast consumption |
4.3 Market Restraints |
4.3.1 Competition from other alternative ingredients in the market |
4.3.2 Fluctuations in raw material prices impacting production costs |
5 United States (US) Inactive Dried Yeast Market Trends |
6 United States (US) Inactive Dried Yeast Market, By Types |
6.1 United States (US) Inactive Dried Yeast Market, By Type |
6.1.1 Overview and Analysis |
6.1.2 United States (US) Inactive Dried Yeast Market Revenues & Volume, By Type, 2022-2032F |
6.1.3 United States (US) Inactive Dried Yeast Market Revenues & Volume, By Feed Grade, 2022-2032F |
6.1.4 United States (US) Inactive Dried Yeast Market Revenues & Volume, By Food Grade, 2022-2032F |
6.1.5 United States (US) Inactive Dried Yeast Market Revenues & Volume, By Pharma Grade, 2022-2032F |
6.2 United States (US) Inactive Dried Yeast Market, By Application |
6.2.1 Overview and Analysis |
6.2.2 United States (US) Inactive Dried Yeast Market Revenues & Volume, By Food, 2022-2032F |
6.2.3 United States (US) Inactive Dried Yeast Market Revenues & Volume, By Fermentation, 2022-2032F |
6.2.4 United States (US) Inactive Dried Yeast Market Revenues & Volume, By Health, 2022-2032F |
6.2.5 United States (US) Inactive Dried Yeast Market Revenues & Volume, By Feed, 2022-2032F |
7 United States (US) Inactive Dried Yeast Market Import-Export Trade Statistics |
7.1 United States (US) Inactive Dried Yeast Market Export to Major Countries |
7.2 United States (US) Inactive Dried Yeast Market Imports from Major Countries |
8 United States (US) Inactive Dried Yeast Market Key Performance Indicators |
8.1 Consumer awareness and perception towards inactive dried yeast |
8.2 Adoption rate of inactive dried yeast in new product launches |
8.3 Market penetration of inactive dried yeast in different food and beverage segments |
8.4 Research and development investment in enhancing the application of inactive dried yeast |
9 United States (US) Inactive Dried Yeast Market - Opportunity Assessment |
9.1 United States (US) Inactive Dried Yeast Market Opportunity Assessment, By Type, 2022 & 2032F |
9.2 United States (US) Inactive Dried Yeast Market Opportunity Assessment, By Application, 2022 & 2032F |
10 United States (US) Inactive Dried Yeast Market - Competitive Landscape |
10.1 United States (US) Inactive Dried Yeast Market Revenue Share, By Companies, 2025 |
10.2 United States (US) Inactive Dried Yeast Market Competitive Benchmarking, By Operating and Technical Parameters |
11 Company Profiles |
12 Recommendations |
13 Disclaimer |
Global Go To Market Strategy - 2030
Export potential enables firms to identify high-growth global markets with greater confidence by combining advanced trade intelligence with a structured quantitative methodology. The framework analyzes emerging demand trends and country-level import patterns while integrating macroeconomic and trade datasets such as GDP and population forecasts, bilateral import–export flows, tariff structures, elasticity differentials between developed and developing economies, geographic distance, and import demand projections. Using weighted trade values from 2020–2024 as the base period to project country-to-country export potential for 2030, these inputs are operationalized through calculated drivers such as gravity model parameters, tariff impact factors, and projected GDP per-capita growth. Through an analysis of hidden potentials, demand hotspots, and market conditions that are most favorable to success, this method enables firms to focus on target countries, maximize returns, and global expansion with data, backed by accuracy.
By factoring in the projected importer demand gap that is currently unmet and could be potential opportunity, it identifies the potential for the Exporter (Country) among 190 countries, against the general trade analysis, which identifies the biggest importer or exporter.
To discover high-growth global markets and optimize your business strategy:
Click Here
Pricing
- Single User License$ 1,995
- Department License$ 2,400
- Site License$ 3,120
- Global License$ 3,795

Leadership Perspectives from Industry Events
Search
Thought Leadership and Analyst Meet


Our Clients
6WResearch In News
- India Air Conditioner Market Set for Strong Rebound in 2026 After Weather-Led Correction and GST-Driven Recovery: 6Wresearch
- ADAS in India: How Automatic Emergency Braking, Blind Spot Detection & Driver Monitoring are Transforming Road Safety
- Doha a strategic location for EV manufacturing hub: IPA Qatar
- Demand for luxury TVs surging in the GCC, says Samsung
- Empowering Growth: The Thriving Journey of Bangladesh’s Cable Industry
- Demand for luxury TVs surging in the GCC, says Samsung
Latest Reports
- Nicaragua RPG Gaming Market (2026-2032)
- New Zealand RPG Gaming Market (2026-2032)
- Netherlands RPG Gaming Market (2026-2032)
- Nauru RPG Gaming Market (2026-2032)
- Namibia RPG Gaming Market (2026-2032)
- Mozambique RPG Gaming Market (2026-2032)
- Montenegro RPG Gaming Market (2026-2032)
- Mongolia RPG Gaming Market (2026-2032)
- Monaco RPG Gaming Market (2026-2032)
- Micronesia RPG Gaming Market (2026-2032)
Industry Events and Analyst Meet

EV India Expo 2026

HIMTEX 2026

India Refining Summit 2026

India EV Show 2026

EV tech India Expo 2026
Whitepaper
- Middle East & Africa Commercial Security Market Click here to view more.
- Middle East & Africa Fire Safety Systems & Equipment Market Click here to view more.
- GCC Drone Market Click here to view more.
- Middle East Lighting Fixture Market Click here to view more.
- GCC Physical & Perimeter Security Market Click here to view more.