United States (US) Iron Castings Market (2026-2032) | Trends, Size, Analysis, Growth, Share, Industry, Companies, Forecast, Outlook, Revenue & Value
Market Forecast By Product (Gray Iron, Ductile Iron, Malleable Iron), By End-User (Automobile, Industrial Machinery, Infrastructure and Construction Machines, Power, Others) And Competitive Landscape
| Product Code: ETC041502 | Publication Date: Jan 2021 | Updated Date: Jun 2026 | Product Type: Report | |
| Publisher: 6Wresearch | Author: Shubham Deep | No. of Pages: 70 | No. of Figures: 35 | No. of Tables: 5 |
United States (US) Iron Castings Market Summary
The united states (us) iron castings market was estimated at USD 145 Million in 2025 and is projected to reach USD 170 Million by 2032, growing at a CAGR of 2.5% from 2026 to 2032.
United States (US) Iron Castings Market Year-wise Growth Rate and Key Drivers
This graph highlights how the United States (US) Iron Castings Market has steadily grown over the past five years, supported by major growth factors.
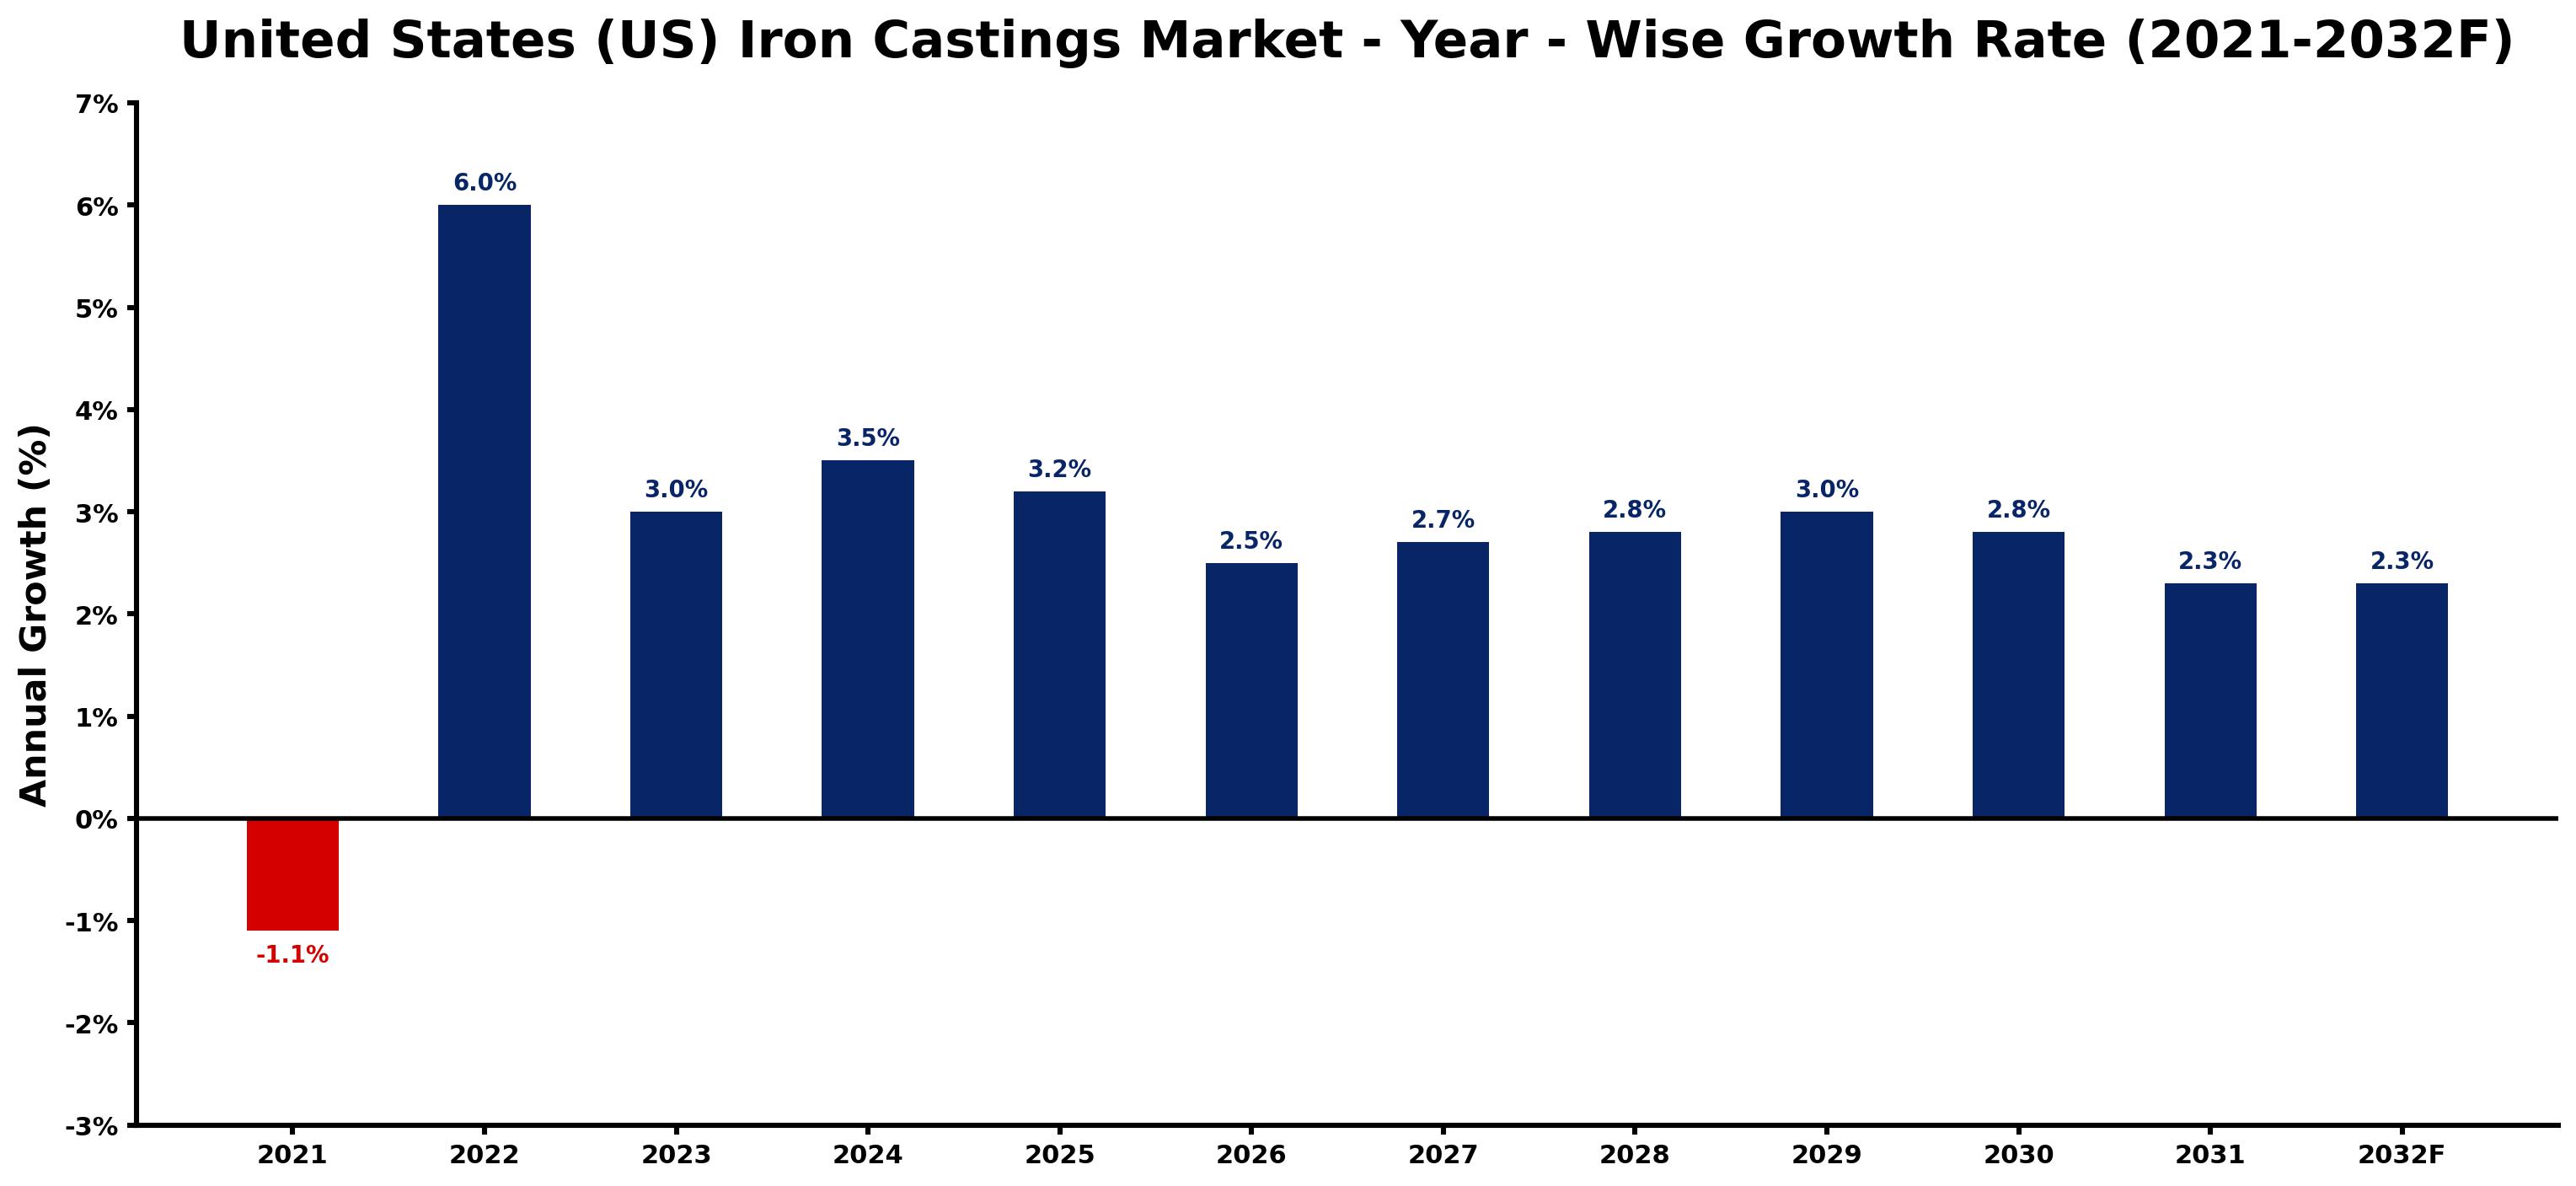
The table below presents the year wise growth rates along with the key drivers influencing the market
| Year | Growth Rate | Major Drivers |
| 2021 | -1.1% | Decreased automotive production stemming from supply chain disruptions curtailed demand for iron castings in 2021. |
| 2022 | 6.0% | Legacy casting facilities initiated upgrades to enhance sustainability and efficiency measures. |
| 2023 | 3.0% | Emerging technologies prompted shifts toward automated production in foundry processes. |
| 2024 | 3.5% | Increasing automotive sector needs stimulated demand for lightweight iron castings solutions. |
| 2025 | 3.2% | Construction industry expansions highlighted the importance of durable casting materials. |
| 2026 | 2.5% | Supply chain optimization efforts led to localized production for quicker delivery times. |
| 2027 | 2.7% | Evolving energy policies influenced the development of specialized castings for renewable industries. |
| 2028 | 2.8% | New industry standards mandated enhanced quality and traceability in iron casting production. |
| 2029 | 3.0% | Corporate sustainability goals created opportunities for recycled material usage in castings. |
| 2030 | 2.8% | Technological partnerships fostered innovation in integrated casting and machining processes. |
| 2031 | 2.3% | Global competitiveness necessitated investments in workforce training for advanced casting techniques. |
| 2032 | 2.3% | Market consolidation efforts positioned firms for scalability in a rapidly changing landscape. |
Note - Market size estimations and growth projections presented in this report are based on 6Wresearch's advanced forecasting approach, validated with industry datasets as of June 2026.
United States (US) Iron Castings Market Synopsis
The United States (US) Iron Castings Market is projected to reach 2.5% and witness significant growth during the forecast period (2026-2032). This market is integral to the broader foundry sector, focusing on the manufacturing of iron-based components through various casting techniques. Iron castings find applications in numerous industries, including automotive, construction, agriculture, and machinery manufacturing, thereby highlighting their versatility and essential nature within industrial processes.
United States (US) Iron Castings Market Growth Drivers
The growth of the United States (US) Iron Castings Market is underpinned by several key drivers:
- Durability and Cost-Effectiveness: The demand for iron castings, known for their strength and longevity, remains robust, particularly in infrastructure projects and heavy machinery, where reliability is paramount.
- Infrastructure Development: Government and private sector investments in infrastructure are expected to stimulate demand for iron castings, reinforcing the necessity for high-quality materials.
- Technological Advancements: Innovations in casting technologies are enhancing production efficiency and quality, increasing the competitiveness of US manufacturers.
- Sustainability Focus: The increasing push for eco-friendly practices is encouraging manufacturers to adopt sustainable methods, further influencing market growth through the production of recyclable materials.
- Automation Integration: The rise of automation and digital tools in the manufacturing process is streamlining operations and improving output quality, which, in turn, enhances market potential.
United States (US) Iron Castings Market Trends and Opportunities
Current trends within the United States (US) Iron Castings Market reveal a shift toward sustainability and advanced manufacturing techniques:
- Sustainable Practices: Manufacturers are increasingly implementing processes aimed at minimizing waste and emissions, aligning with global sustainability goals.
- Precision Casting Demand: Industries such as automotive and aerospace are driving a surge in demand for high-quality, precision castings, compelling manufacturers to invest in advanced capabilities.
- Digital Transformation: The industry is experiencing a digital transformation, with the adoption of Industry 4.0 technologies leading to smarter and more efficient production lines.
- Reshoring Initiatives: With recent global supply chain disruptions, there is a growing trend towards domestic sourcing and reshoring, enhancing local manufacturing capabilities.
- Investment in R&D: Companies are allocating more resources to research and development to innovate and respond to evolving market needs effectively.
United States (US) Iron Castings Market Challenges and Restraints
Despite its anticipated growth, the United States (US) Iron Castings Market faces several challenges that may hinder its progress:
- Global Competition: The market is contending with increasing competition from international producers offering lower-cost alternatives, which may affect the pricing structure.
- Raw Material Price Volatility: Fluctuations in the costs of essential raw materials can substantially impact overall production expenses, creating financial uncertainty for manufacturers.
- Regulatory Pressures: Compliance with stringent environmental and safety regulations can elevate operational costs, compelling manufacturers to adapt their practices.
- Workforce Challenges: An aging labor force and skills shortages are significant challenges, threatening productivity and operational continuity within the industry.
- Technological Adaptation: The need for ongoing investment in advanced technologies to meet consumer demands can strain resources and shift focus from core operational activities.
United States (US) Iron Castings Market Investment Opportunities
The United States (US) Iron Castings Market is poised for various investment opportunities through:
- Sector Growth: Increased demand across sectors such as automotive, construction, and machinery provides ample opportunities for investment in iron casting foundries.
- Specialized Products: Companies focusing on niche markets and high-quality production stand out as attractive investment targets due to their ability to command premium pricing.
- Technological Innovations: Investments in firms developing advanced casting techniques and sustainable processes are likely to yield promising returns as the market evolves.
- Infrastructure Projects: Ongoing infrastructure development initiatives are a significant draw for investors, presenting long-term opportunities for growth in the castings sector.
- Emerging Materials: The growing trend towards lightweight and durable materials positions iron castings as a favorable choice, appealing to those looking to invest in future-oriented manufacturing.
United States (US) Iron Castings Market Government Investment and Initiatives
The US government plays a crucial role in shaping the iron castings landscape through various policies and initiatives:
- Environmental Regulations: Policies such as the Clean Air Act and Clean Water Act are designed to reduce emissions and encourage sustainable practices within the foundry industry.
- Workforce Safety Initiatives: Regulations enforced by entities like OSHA are aimed at enhancing workplace safety, which directly impacts operational practices and costs.
- Trade Policies: Tariffs and trade regulations affect the competitiveness of domestic iron castings, ensuring that local manufacturers can compete effectively against imports.
- Funding for Innovation: Government-backed initiatives often provide funding and grants for research into advanced production technologies and sustainable practices.
- Infrastructure Spending: Public investments in infrastructure development provide a substantial boost to the demand for iron castings, creating opportunities for growth within the sector.
United States (US) Iron Castings Market Latest Developments (May 2025 - June 2026)
Recent developments within the United States (US) Iron Castings Market reflect a dynamic shift towards innovation and sustainability:
- Increased automation in foundry operations has been observed, leading to improved efficiency and reduced production costs, thereby enhancing overall competitiveness.
- The industry has witnessed a growing awareness and adoption of environmentally friendly practices, with more manufacturers striving to meet stricter environmental standards.
- Research collaborations between academic institutions and private sector companies have been fostering innovations in casting techniques, emphasizing quality and sustainability.
- Efforts to address workforce challenges have intensified, with training programs aimed at upskilling the current workforce and attracting new talent to the industry.
- The market has also reacted positively to government initiatives promoting domestic sourcing and reshoring, which have bolstered local production capabilities.
United States (US) Iron Castings Market - Key Attractiveness of the Report
- 10 Years of Market Numbers
- Historical Data Starting from 2022 to 2025
- Base Year: 2025
- Forecast Data until 2032
- Key Performance Indicators Impacting the Market
- Major Upcoming Developments and Projects
Key Highlights of the Report:
- United States (US) Iron Castings Market Outlook
- Market Size of United States (US) Iron Castings Market, 2025
- Forecast of United States (US) Iron Castings Market, 2032F
- Historical Data and Forecast of United States (US) Iron Castings Revenues & Volume for the Period 2022-2032F
- United States (US) Iron Castings Market Trend Evolution
- United States (US) Iron Castings Market Drivers and Challenges
- United States (US) Iron Castings Price Trends
- United States (US) Iron Castings Porter's Five Forces
- United States (US) Iron Castings Industry Life Cycle
- Historical Data and Forecast of United States (US) Iron Castings Market Revenues & Volume By Product for the Period 2022-2032F
- Historical Data and Forecast of United States (US) Iron Castings Market Revenues & Volume By Gray Iron for the Period 2022-2032F
- Historical Data and Forecast of United States (US) Iron Castings Market Revenues & Volume By Ductile Iron for the Period 2022-2032F
- Historical Data and Forecast of United States (US) Iron Castings Market Revenues & Volume By Malleable Iron for the Period 2022-2032F
- Historical Data and Forecast of United States (US) Iron Castings Market Revenues & Volume By End-User for the Period 2022-2032F
- Historical Data and Forecast of United States (US) Iron Castings Market Revenues & Volume By Automobile for the Period 2022-2032F
- Historical Data and Forecast of United States (US) Iron Castings Market Revenues & Volume By Industrial Machinery for the Period 2022-2032F
- Historical Data and Forecast of United States (US) Iron Castings Market Revenues & Volume By Infrastructure and Construction Machines for the Period 2022-2032F
- Historical Data and Forecast of United States (US) Iron Castings Market Revenues & Volume By Power for the Period 2022-2032F
- Historical Data and Forecast of United States (US) Iron Castings Market Revenues & Volume By Others for the Period 2022-2032F
- United States (US) Iron Castings Import Export Trade Statistics
- Market Opportunity Assessment By Product
- Market Opportunity Assessment By End-User
- United States (US) Iron Castings Top Companies Market Share
- United States (US) Iron Castings Competitive Benchmarking By Technical and Operational Parameters
- United States (US) Iron Castings Company Profiles
- United States (US) Iron Castings Key Strategic Recommendations
Frequently Asked Questions About the Market Study (FAQs):
Iron castings are primarily used in industries such as automotive, construction, machinery manufacturing, and agriculture, where durability and strength are critical.
Technological advancements are improving production efficiency, enabling the development of high-quality, precision castings while reducing operational costs.
Sustainability is becoming increasingly important, with manufacturers focusing on eco-friendly practices and materials to meet regulatory standards and consumer demands.
6Wresearch actively monitors the United States (US) Iron Castings Market and publishes its comprehensive annual report, highlighting emerging trends, growth drivers, revenue analysis, and forecast outlook. Our insights help businesses to make data-backed strategic decisions with ongoing market dynamics. Our analysts track relevent industries related to the United States (US) Iron Castings Market, allowing our clients with actionable intelligence and reliable forecasts tailored to emerging regional needs.
Yes, we provide customisation as per your requirements. To learn more, feel free to contact us on sales@6wresearch.com
1 Executive Summary |
2 Introduction |
2.1 Key Highlights of the Report |
2.2 Report Description |
2.3 Market Scope & Segmentation |
2.4 Research Methodology |
2.5 Assumptions |
3 United States (US) Iron Castings Market Overview |
3.1 United States (US) Country Macro Economic Indicators |
3.2 United States (US) Iron Castings Market Revenues & Volume, 2022 & 2032F |
3.3 United States (US) Iron Castings Market - Industry Life Cycle |
3.4 United States (US) Iron Castings Market - Porter's Five Forces |
3.5 United States (US) Iron Castings Market Revenues & Volume Share, By Product, 2022 & 2032F |
3.6 United States (US) Iron Castings Market Revenues & Volume Share, By End-User, 2022 & 2032F |
4 United States (US) Iron Castings Market Dynamics |
4.1 Impact Analysis |
4.2 Market Drivers |
4.2.1 Increasing demand for iron castings in various industries such as automotive, construction, and machinery. |
4.2.2 Growing investments in infrastructure projects leading to higher demand for iron castings. |
4.2.3 Technological advancements in iron casting processes improving efficiency and quality of products. |
4.3 Market Restraints |
4.3.1 Fluctuating raw material prices impacting production costs. |
4.3.2 Intense competition from alternative materials like aluminum and steel in certain applications. |
4.3.3 Environmental regulations and sustainability concerns influencing production practices. |
5 United States (US) Iron Castings Market Trends |
6 United States (US) Iron Castings Market, By Types |
6.1 United States (US) Iron Castings Market, By Product |
6.1.1 Overview and Analysis |
6.1.2 United States (US) Iron Castings Market Revenues & Volume, By Product, 2022-2032F |
6.1.3 United States (US) Iron Castings Market Revenues & Volume, By Gray Iron, 2022-2032F |
6.1.4 United States (US) Iron Castings Market Revenues & Volume, By Ductile Iron, 2022-2032F |
6.1.5 United States (US) Iron Castings Market Revenues & Volume, By Malleable Iron, 2022-2032F |
6.2 United States (US) Iron Castings Market, By End-User |
6.2.1 Overview and Analysis |
6.2.2 United States (US) Iron Castings Market Revenues & Volume, By Automobile, 2022-2032F |
6.2.3 United States (US) Iron Castings Market Revenues & Volume, By Industrial Machinery, 2022-2032F |
6.2.4 United States (US) Iron Castings Market Revenues & Volume, By Infrastructure and Construction Machines, 2022-2032F |
6.2.5 United States (US) Iron Castings Market Revenues & Volume, By Power, 2022-2032F |
6.2.6 United States (US) Iron Castings Market Revenues & Volume, By Others, 2022-2032F |
7 United States (US) Iron Castings Market Import-Export Trade Statistics |
7.1 United States (US) Iron Castings Market Export to Major Countries |
7.2 United States (US) Iron Castings Market Imports from Major Countries |
8 United States (US) Iron Castings Market Key Performance Indicators |
8.1 Scrap rate percentage in iron casting production process. |
8.2 Energy consumption per unit of iron casting produced. |
8.3 Percentage of defects or rework in finished iron castings. |
8.4 Average lead time from order placement to delivery of iron castings. |
9 United States (US) Iron Castings Market - Opportunity Assessment |
9.1 United States (US) Iron Castings Market Opportunity Assessment, By Product, 2022 & 2032F |
9.2 United States (US) Iron Castings Market Opportunity Assessment, By End-User, 2022 & 2032F |
10 United States (US) Iron Castings Market - Competitive Landscape |
10.1 United States (US) Iron Castings Market Revenue Share, By Companies, 2025 |
10.2 United States (US) Iron Castings Market Competitive Benchmarking, By Operating and Technical Parameters |
11 Company Profiles |
12 Recommendations |
13 Disclaimer |
Global Go To Market Strategy - 2030
Export potential enables firms to identify high-growth global markets with greater confidence by combining advanced trade intelligence with a structured quantitative methodology. The framework analyzes emerging demand trends and country-level import patterns while integrating macroeconomic and trade datasets such as GDP and population forecasts, bilateral import–export flows, tariff structures, elasticity differentials between developed and developing economies, geographic distance, and import demand projections. Using weighted trade values from 2020–2024 as the base period to project country-to-country export potential for 2030, these inputs are operationalized through calculated drivers such as gravity model parameters, tariff impact factors, and projected GDP per-capita growth. Through an analysis of hidden potentials, demand hotspots, and market conditions that are most favorable to success, this method enables firms to focus on target countries, maximize returns, and global expansion with data, backed by accuracy.
By factoring in the projected importer demand gap that is currently unmet and could be potential opportunity, it identifies the potential for the Exporter (Country) among 190 countries, against the general trade analysis, which identifies the biggest importer or exporter.
To discover high-growth global markets and optimize your business strategy:
Click Here
Pricing
- Single User License$ 1,995
- Department License$ 2,400
- Site License$ 3,120
- Global License$ 3,795

Leadership Perspectives from Industry Events
Search
Thought Leadership and Analyst Meet


Our Clients
6WResearch In News
- India Air Conditioner Market Set for Strong Rebound in 2026 After Weather-Led Correction and GST-Driven Recovery: 6Wresearch
- ADAS in India: How Automatic Emergency Braking, Blind Spot Detection & Driver Monitoring are Transforming Road Safety
- Doha a strategic location for EV manufacturing hub: IPA Qatar
- Demand for luxury TVs surging in the GCC, says Samsung
- Empowering Growth: The Thriving Journey of Bangladesh’s Cable Industry
- Demand for luxury TVs surging in the GCC, says Samsung
Latest Reports
- Nicaragua RPG Gaming Market (2026-2032)
- New Zealand RPG Gaming Market (2026-2032)
- Netherlands RPG Gaming Market (2026-2032)
- Nauru RPG Gaming Market (2026-2032)
- Namibia RPG Gaming Market (2026-2032)
- Mozambique RPG Gaming Market (2026-2032)
- Montenegro RPG Gaming Market (2026-2032)
- Mongolia RPG Gaming Market (2026-2032)
- Monaco RPG Gaming Market (2026-2032)
- Micronesia RPG Gaming Market (2026-2032)
Industry Events and Analyst Meet

EV India Expo 2026

HIMTEX 2026

India Refining Summit 2026

India EV Show 2026

EV tech India Expo 2026
Whitepaper
- Middle East & Africa Commercial Security Market Click here to view more.
- Middle East & Africa Fire Safety Systems & Equipment Market Click here to view more.
- GCC Drone Market Click here to view more.
- Middle East Lighting Fixture Market Click here to view more.
- GCC Physical & Perimeter Security Market Click here to view more.