United States (US) Lithium Hypochlorite Market (2026-2032) Outlook | Size, Companies, Growth, Revenue, Analysis, Trends, Forecast, Value, Share & Industry
Market Forecast By Form (Tablet, Powder), By Grade (Industrial, Technical), By Application (Chemical Reagent, Disinfectants, Preservative, Bleaching Agent, Fungicide, Neutralizing Nerve Agents, Others), By End-use (Water and Wastewater Treatment, Sports and Recreation, Food, Pharmaceutical, Textile, Cosmetics and Personal Care, Others) And Competitive Landscape
| Product Code: ETC210073 | Publication Date: May 2022 | Updated Date: Jul 2026 | Product Type: Market Research Report | |
| Publisher: 6Wresearch | Author: Shubham Padhi | No. of Pages: 60 | No. of Figures: 40 | No. of Tables: 7 |
United States (US) Lithium Hypochlorite Market Size, Share & Growth Rate
The United States (US) Lithium Hypochlorite Market was estimated at USD 211 Million in 2025 and is projected to reach USD 248 Million by 2032, growing at a CAGR of 2.3% from 2026 to 2032. This growth is largely driven by the rising demand for effective water treatment solutions across multiple sectors, including municipal water supply, recreational facilities, and healthcare systems. As public awareness around hygiene and sanitation increases, the adoption of lithium hypochlorite for disinfection and oxidation processes is expected to gain momentum, bolstering market performance.
United States (US) Lithium Hypochlorite Market Year-wise Growth Rate and Key Drivers
This graph highlights how the United States (US) Lithium Hypochlorite Market has steadily grown over the years, supported by major growth factors.
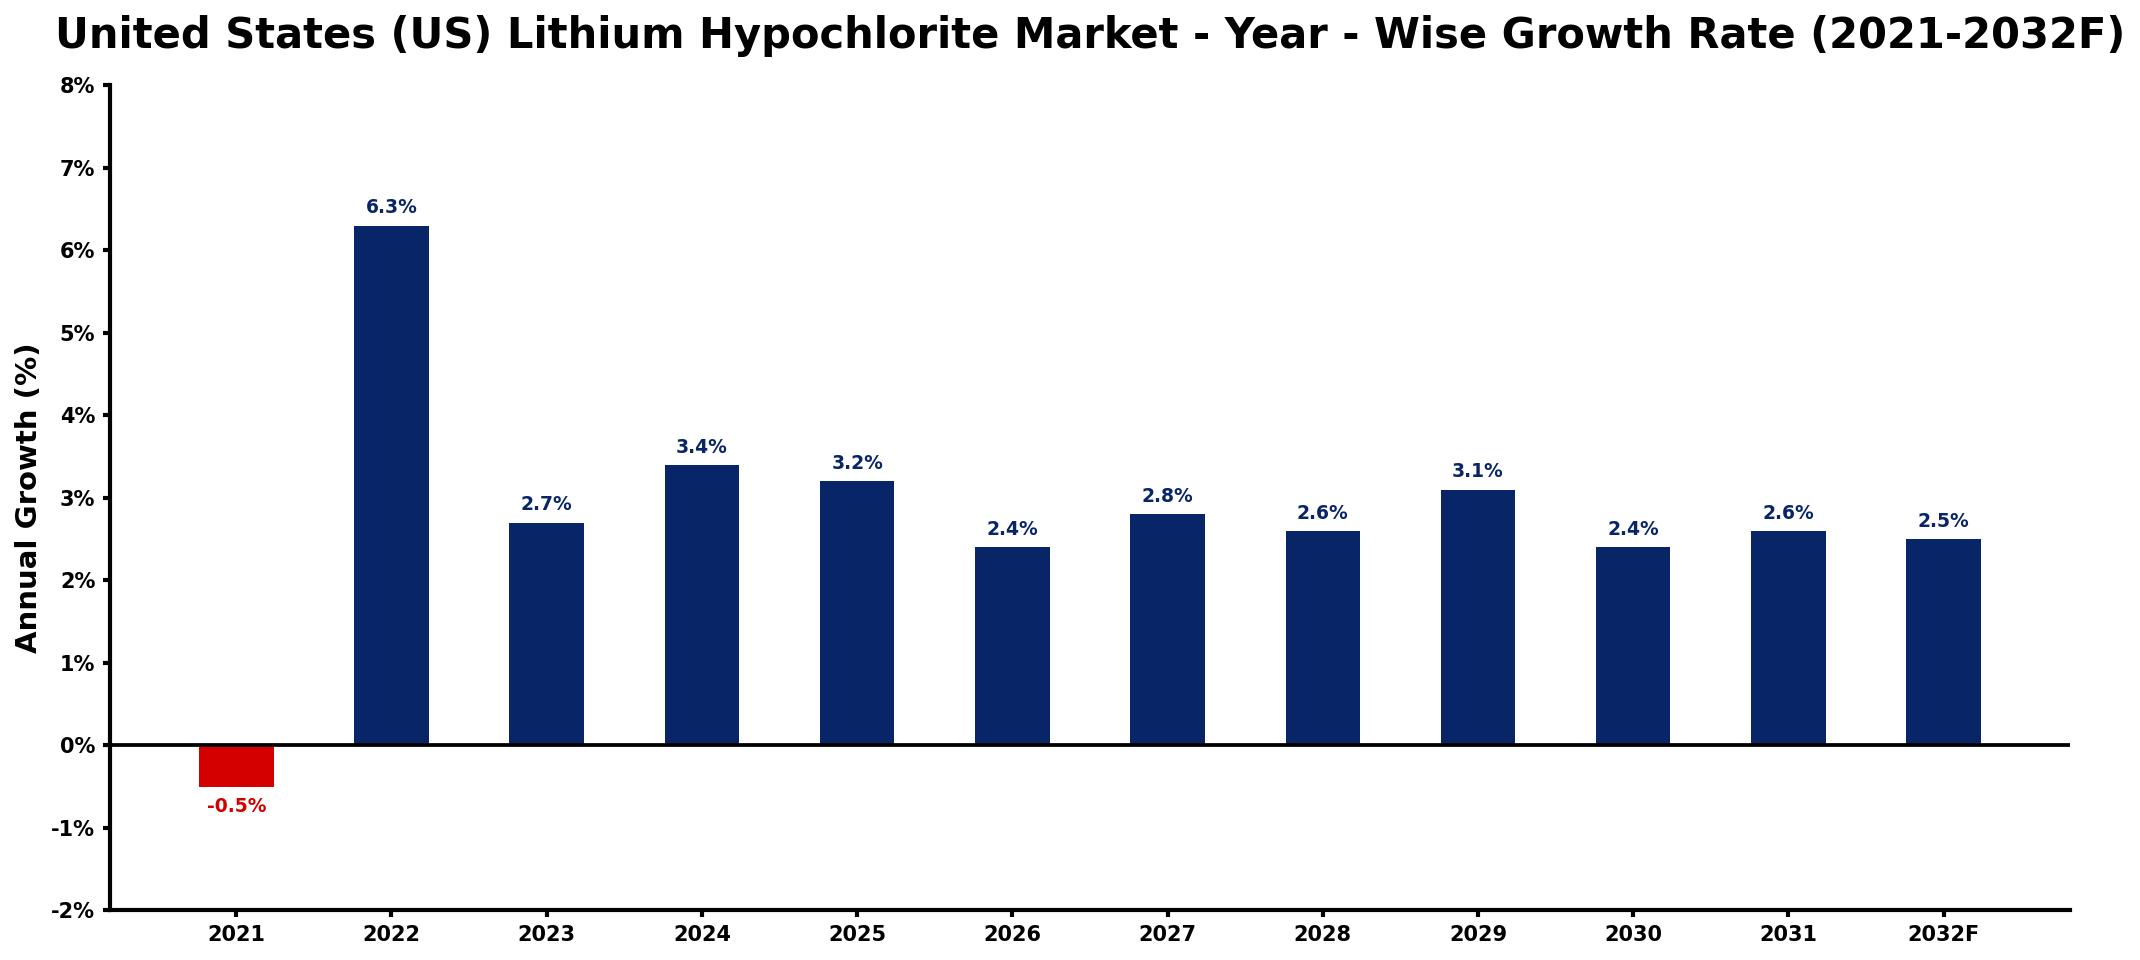
The table below presents the year‑wise growth rates along with the key drivers influencing the market
| Year | Growth Rate | Major Drivers |
| 2021 | -0.5% | decreased industrial water treatment demand |
| 2022 | 6.3% | increased focus on water sanitation |
| 2023 | 2.7% | expansion in swimming pool maintenance |
| 2024 | 3.4% | growing investments in water purification |
| 2025 | 3.2% | rising awareness of public health |
| 2026 | 2.4% | enhanced regulations on water quality |
| 2027 | 2.8% | increased agricultural water safety measures |
| 2028 | 2.6% | expansion of commercial cleaning services |
| 2029 | 3.1% | growing demand for eco-friendly solutions |
| 2030 | 2.4% | increased adoption of sustainable practices |
| 2031 | 2.6% | rising investments in wastewater treatment |
| 2032 | 2.5% | rising infrastructure development spending |
Note: Market size estimations and growth projections presented in this report are based on 6Wresearch's proprietary forecasting methodology, utilizing the latest available industry data, government publications, and primary research inputs.
United States (US) Lithium Hypochlorite Market Synopsis
The US Lithium Hypochlorite Market is characterized by its application in diverse industries, particularly in water treatment facilities and swimming pools. With stringent regulations emphasizing water quality and safety, the demand for lithium hypochlorite as an effective disinfectant is witnessing an upward trend.
Additionally, the increasing shift towards environmentally responsible chemical solutions has positioned lithium hypochlorite as a favorable alternative to traditional chlorine products. This growing inclination is influencing purchasing decisions in both commercial and residential markets.
United States (US) Lithium Hypochlorite Market Key Takeaways
- The market is projected to grow steadily, reflecting the ongoing emphasis on sanitation and water safety.
- Investments in R&D are enhancing product formulations, improving performance and sustainability.
- There is a notable shift towards lithium hypochlorite due to its reduced environmental footprint compared to other disinfectants.
- The regulatory landscape ensures safety, influencing market dynamics and operational practices.
- Partnerships with key sectors such as healthcare and municipal water treatment are critical for growth.
Evaluation of Restraints in United States (US) Lithium Hypochlorite Market
While the US Lithium Hypochlorite Market shows promising growth, it is not without challenges. Volatility in raw material prices, particularly for lithium, can significantly affect production costs and, consequently, profit margins. Additionally, rigorous environmental regulations regarding the handling and disposal of chemicals pose operational hurdles for companies, necessitating compliance and sustainability measures. The competitive landscape is further complicated by the presence of alternative disinfection products, which may siphon off potential market share unless companies focus on continuous innovation and differentiation.
United States (US) Lithium Hypochlorite Market Trends
Current trends indicate a rising preference for lithium hypochlorite in pool maintenance and water treatment applications due to its superior effectiveness. The ongoing focus on health and hygiene, intensified by the pandemic, has accelerated the adoption of this chemical across various sectors. Moreover, manufacturers are increasingly investing in research to improve both the efficacy and environmental sustainability of lithium hypochlorite products, which is transforming the market landscape.
United States (US) Lithium Hypochlorite Market Opportunities
There exist substantial investment opportunities within the US Lithium Hypochlorite Market, particularly in sectors emphasizing sanitation and water quality. As demand for effective water treatment chemicals continues to rise, stakeholders can benefit from investing in companies engaged in production and distribution. Furthermore, establishing strategic partnerships with industries like municipal water services and sanitation firms will likely yield substantial returns as they seek environmentally friendly disinfection solutions.
Government Initiatives in the United States (US) Lithium Hypochlorite Market
While specific policies targeting the Lithium Hypochlorite market are limited, general regulations concerning chemical safety and environmental protection are applicable. The Environmental Protection Agency (EPA) oversees the use and registration of chemicals, including lithium hypochlorite, under the Toxic Substances Control Act (TSCA). Additionally, workplace safety standards set by the Occupational Safety and Health Administration (OSHA) must be adhered to by companies handling these chemicals, ensuring worker and environmental safety.
Future Insights of the United States (US) Lithium Hypochlorite Market
Looking ahead to 2026-2032, the future of the US Lithium Hypochlorite Market appears bright. The growing emphasis on water quality and sanitation practices is expected to drive increased demand. As environmental regulations become more stringent, lithium hypochlorite's role as an effective and sustainable disinfection agent will become increasingly vital. Moreover, the compound's versatility across various applications, including commercial sanitation and industrial processes, reinforces its market potential as businesses continue to prioritize hygiene and safety standards.
United States (US) Lithium Hypochlorite Market Latest Developments (2025 - 2026)
Recent developments in the US Lithium Hypochlorite Market indicate a strong focus on innovation and regulatory compliance. Companies are investing in technology to enhance production efficiency and product formulations, as well as to address environmental concerns. Additionally, ongoing collaborations between manufacturers and municipal entities are emerging, aimed at optimizing water treatment solutions while adhering to new regulatory standards.
United States (US) Lithium Hypochlorite Market - Key Attractiveness of the Report
- 10 Years of Market Numbers
- Historical Data Starting from 2022 to 2025
- Base Year: 2025
- Forecast Data until 2032
- Key Performance Indicators Impacting the Market
- Major Upcoming Developments and Projects
Key Highlights of the Report:
- United States (US) Lithium Hypochlorite Market Outlook
- Market Size of United States (US) Lithium Hypochlorite Market, 2025
- Forecast of United States (US) Lithium Hypochlorite Market, 2032
- Historical Data and Forecast of United States (US) Lithium Hypochlorite Revenues & Volume for the Period 2022-2032F
- United States (US) Lithium Hypochlorite Market Trend Evolution
- United States (US) Lithium Hypochlorite Market Drivers and Challenges
- United States (US) Lithium Hypochlorite Price Trends
- United States (US) Lithium Hypochlorite Porter's Five Forces
- United States (US) Lithium Hypochlorite Industry Life Cycle
- Historical Data and Forecast of United States (US) Lithium Hypochlorite Market Revenues & Volume By Form for the Period 2022-2032F
- Historical Data and Forecast of United States (US) Lithium Hypochlorite Market Revenues & Volume By Tablet for the Period 2022-2032F
- Historical Data and Forecast of United States (US) Lithium Hypochlorite Market Revenues & Volume By Powder for the Period 2022-2032F
- Historical Data and Forecast of United States (US) Lithium Hypochlorite Market Revenues & Volume By Grade for the Period 2022-2032F
- Historical Data and Forecast of United States (US) Lithium Hypochlorite Market Revenues & Volume By Industrial for the Period 2022-2032F
- Historical Data and Forecast of United States (US) Lithium Hypochlorite Market Revenues & Volume By Technical for the Period 2022-2032F
- Historical Data and Forecast of United States (US) Lithium Hypochlorite Market Revenues & Volume By Application for the Period 2022-2032F
- Historical Data and Forecast of United States (US) Lithium Hypochlorite Market Revenues & Volume By Chemical Reagent for the Period 2022-2032F
- Historical Data and Forecast of United States (US) Lithium Hypochlorite Market Revenues & Volume By Disinfectants for the Period 2022-2032F
- Historical Data and Forecast of United States (US) Lithium Hypochlorite Market Revenues & Volume By Preservative for the Period 2022-2032F
- Historical Data and Forecast of United States (US) Lithium Hypochlorite Market Revenues & Volume By Bleaching Agent for the Period 2022-2032F
- Historical Data and Forecast of United States (US) Lithium Hypochlorite Market Revenues & Volume By Fungicide for the Period 2022-2032F
- Historical Data and Forecast of United States (US) Lithium Hypochlorite Market Revenues & Volume By Neutralizing Nerve Agents for the Period 2022-2032F
- Historical Data and Forecast of United States (US) Lithium Hypochlorite Market Revenues & Volume By Others for the Period 2022-2032F
- Historical Data and Forecast of United States (US) Lithium Hypochlorite Market Revenues & Volume By End-use for the Period 2022-2032F
- Historical Data and Forecast of United States (US) Lithium Hypochlorite Market Revenues & Volume By Water and Wastewater Treatment for the Period 2022-2032F
- Historical Data and Forecast of United States (US) Lithium Hypochlorite Market Revenues & Volume By Sports and Recreation for the Period 2022-2032F
- Historical Data and Forecast of United States (US) Lithium Hypochlorite Market Revenues & Volume By Food for the Period 2022-2032F
- Historical Data and Forecast of United States (US) Lithium Hypochlorite Market Revenues & Volume By Pharmaceutical for the Period 2022-2032F
- Historical Data and Forecast of United States (US) Lithium Hypochlorite Market Revenues & Volume By Textile for the Period 2022-2032F
- Historical Data and Forecast of United States (US) Lithium Hypochlorite Market Revenues & Volume By Cosmetics and Personal Care for the Period 2022-2032F
- Historical Data and Forecast of United States (US) Lithium Hypochlorite Market Revenues & Volume By Others for the Period 2022-2032F
- United States (US) Lithium Hypochlorite Import Export Trade Statistics
- Market Opportunity Assessment By Form
- Market Opportunity Assessment By Grade
- Market Opportunity Assessment By Application
- Market Opportunity Assessment By End-use
- United States (US) Lithium Hypochlorite Top Companies Market Share
- United States (US) Lithium Hypochlorite Competitive Benchmarking By Technical and Operational Parameters
- United States (US) Lithium Hypochlorite Company Profiles
- United States (US) Lithium Hypochlorite Key Strategic Recommendations
Frequently Asked Questions About the Market Study (FAQs):
The United States Lithium Hypochlorite Market was valued at USD 211 Million in 2025 and is projected to grow to USD 248 Million by 2032, representing a CAGR of 2.3% from 2026 to 2032.
Demand for lithium hypochlorite is primarily driven by the water treatment sector, including municipal systems and swimming pools, where effective disinfection is crucial.
Manufacturers are increasingly investing in R&D to enhance the sustainability of lithium hypochlorite, focusing on eco-friendly formulations that minimize environmental impact while maintaining effectiveness.
The market faces challenges from stringent regulations concerning chemical safety and environmental impact, necessitating compliance with EPA and OSHA guidelines.
Yes, there are significant growth opportunities through strategic partnerships with municipal water treatment facilities and expansion into residential cleaning markets, driven by heightened awareness around health and hygiene.
6Wresearch actively monitors the United States (US) Lithium Hypochlorite Market and publishes its comprehensive annual report, highlighting emerging trends, growth drivers, revenue analysis, and forecast outlook. Our insights help businesses to make data-backed strategic decisions with ongoing market dynamics. Our analysts track relevent industries related to the United States (US) Lithium Hypochlorite Market, allowing our clients with actionable intelligence and reliable forecasts tailored to emerging regional needs.
Yes, we provide customisation as per your requirements. To learn more, feel free to contact us on sales@6wresearch.com
1 Executive Summary |
2 Introduction |
2.1 Key Highlights of the Report |
2.2 Report Description |
2.3 Market Scope & Segmentation |
2.4 Research Methodology |
2.5 Assumptions |
3 United States (US) Lithium Hypochlorite Market Overview |
3.1 United States (US) Country Macro Economic Indicators |
3.2 United States (US) Lithium Hypochlorite Market Revenues & Volume, 2022 & 2032F |
3.3 United States (US) Lithium Hypochlorite Market - Industry Life Cycle |
3.4 United States (US) Lithium Hypochlorite Market - Porter's Five Forces |
3.5 United States (US) Lithium Hypochlorite Market Revenues & Volume Share, By Form, 2022 & 2032F |
3.6 United States (US) Lithium Hypochlorite Market Revenues & Volume Share, By Grade, 2022 & 2032F |
3.7 United States (US) Lithium Hypochlorite Market Revenues & Volume Share, By Application, 2022 & 2032F |
3.8 United States (US) Lithium Hypochlorite Market Revenues & Volume Share, By End-use, 2022 & 2032F |
4 United States (US) Lithium Hypochlorite Market Dynamics |
4.1 Impact Analysis |
4.2 Market Drivers |
4.2.1 Increasing demand for lithium hypochlorite in water treatment applications due to its effectiveness in disinfection and sterilization. |
4.2.2 Growing awareness about the importance of clean and safe water for public health and sanitation. |
4.2.3 Technological advancements leading to the development of more efficient and environmentally friendly lithium hypochlorite products. |
4.3 Market Restraints |
4.3.1 Fluctuating prices of raw materials used in the production of lithium hypochlorite. |
4.3.2 Stringent environmental regulations regarding the disposal and handling of lithium hypochlorite waste. |
4.3.3 Competition from alternative water treatment solutions that may offer lower costs or better performance in specific applications. |
5 United States (US) Lithium Hypochlorite Market Trends |
6 United States (US) Lithium Hypochlorite Market, By Types |
6.1 United States (US) Lithium Hypochlorite Market, By Form |
6.1.1 Overview and Analysis |
6.1.2 United States (US) Lithium Hypochlorite Market Revenues & Volume, By Form, 2022-2032F |
6.1.3 United States (US) Lithium Hypochlorite Market Revenues & Volume, By Tablet, 2022-2032F |
6.1.4 United States (US) Lithium Hypochlorite Market Revenues & Volume, By Powder, 2022-2032F |
6.2 United States (US) Lithium Hypochlorite Market, By Grade |
6.2.1 Overview and Analysis |
6.2.2 United States (US) Lithium Hypochlorite Market Revenues & Volume, By Industrial, 2022-2032F |
6.2.3 United States (US) Lithium Hypochlorite Market Revenues & Volume, By Technical, 2022-2032F |
6.3 United States (US) Lithium Hypochlorite Market, By Application |
6.3.1 Overview and Analysis |
6.3.2 United States (US) Lithium Hypochlorite Market Revenues & Volume, By Chemical Reagent, 2022-2032F |
6.3.3 United States (US) Lithium Hypochlorite Market Revenues & Volume, By Disinfectants, 2022-2032F |
6.3.4 United States (US) Lithium Hypochlorite Market Revenues & Volume, By Preservative, 2022-2032F |
6.3.5 United States (US) Lithium Hypochlorite Market Revenues & Volume, By Bleaching Agent, 2022-2032F |
6.3.6 United States (US) Lithium Hypochlorite Market Revenues & Volume, By Fungicide, 2022-2032F |
6.3.7 United States (US) Lithium Hypochlorite Market Revenues & Volume, By Neutralizing Nerve Agents, 2022-2032F |
6.4 United States (US) Lithium Hypochlorite Market, By End-use |
6.4.1 Overview and Analysis |
6.4.2 United States (US) Lithium Hypochlorite Market Revenues & Volume, By Water and Wastewater Treatment, 2022-2032F |
6.4.3 United States (US) Lithium Hypochlorite Market Revenues & Volume, By Sports and Recreation, 2022-2032F |
6.4.4 United States (US) Lithium Hypochlorite Market Revenues & Volume, By Food, 2022-2032F |
6.4.5 United States (US) Lithium Hypochlorite Market Revenues & Volume, By Pharmaceutical, 2022-2032F |
6.4.6 United States (US) Lithium Hypochlorite Market Revenues & Volume, By Textile, 2022-2032F |
6.4.7 United States (US) Lithium Hypochlorite Market Revenues & Volume, By Cosmetics and Personal Care, 2022-2032F |
7 United States (US) Lithium Hypochlorite Market Import-Export Trade Statistics |
7.1 United States (US) Lithium Hypochlorite Market Export to Major Countries |
7.2 United States (US) Lithium Hypochlorite Market Imports from Major Countries |
8 United States (US) Lithium Hypochlorite Market Key Performance Indicators |
8.1 Adoption rate of lithium hypochlorite in municipal water treatment facilities. |
8.2 Number of research and development projects focused on improving the efficiency and sustainability of lithium hypochlorite production processes. |
8.3 Percentage of water quality compliance reports mentioning the use of lithium hypochlorite as a disinfection method. |
9 United States (US) Lithium Hypochlorite Market - Opportunity Assessment |
9.1 United States (US) Lithium Hypochlorite Market Opportunity Assessment, By Form, 2022 & 2032F |
9.2 United States (US) Lithium Hypochlorite Market Opportunity Assessment, By Grade, 2022 & 2032F |
9.3 United States (US) Lithium Hypochlorite Market Opportunity Assessment, By Application, 2022 & 2032F |
9.4 United States (US) Lithium Hypochlorite Market Opportunity Assessment, By End-use, 2022 & 2032F |
10 United States (US) Lithium Hypochlorite Market - Competitive Landscape |
10.1 United States (US) Lithium Hypochlorite Market Revenue Share, By Companies, 2025 |
10.2 United States (US) Lithium Hypochlorite Market Competitive Benchmarking, By Operating and Technical Parameters |
11 Company Profiles |
12 Recommendations |
13 Disclaimer |
Global Go To Market Strategy - 2030
Export potential enables firms to identify high-growth global markets with greater confidence by combining advanced trade intelligence with a structured quantitative methodology. The framework analyzes emerging demand trends and country-level import patterns while integrating macroeconomic and trade datasets such as GDP and population forecasts, bilateral import–export flows, tariff structures, elasticity differentials between developed and developing economies, geographic distance, and import demand projections. Using weighted trade values from 2020–2024 as the base period to project country-to-country export potential for 2030, these inputs are operationalized through calculated drivers such as gravity model parameters, tariff impact factors, and projected GDP per-capita growth. Through an analysis of hidden potentials, demand hotspots, and market conditions that are most favorable to success, this method enables firms to focus on target countries, maximize returns, and global expansion with data, backed by accuracy.
By factoring in the projected importer demand gap that is currently unmet and could be potential opportunity, it identifies the potential for the Exporter (Country) among 190 countries, against the general trade analysis, which identifies the biggest importer or exporter.
To discover high-growth global markets and optimize your business strategy:
Click Here
Pricing
- Single User License$ 1,995
- Department License$ 2,400
- Site License$ 3,120
- Global License$ 3,795

Leadership Perspectives from Industry Events
Search
Thought Leadership and Analyst Meet


Our Clients
6WResearch In News
- India Air Conditioner Market Set for Strong Rebound in 2026 After Weather-Led Correction and GST-Driven Recovery: 6Wresearch
- ADAS in India: How Automatic Emergency Braking, Blind Spot Detection & Driver Monitoring are Transforming Road Safety
- Doha a strategic location for EV manufacturing hub: IPA Qatar
- Demand for luxury TVs surging in the GCC, says Samsung
- Empowering Growth: The Thriving Journey of Bangladesh’s Cable Industry
- Demand for luxury TVs surging in the GCC, says Samsung
Latest Reports
- Nicaragua RPG Gaming Market (2026-2032)
- New Zealand RPG Gaming Market (2026-2032)
- Netherlands RPG Gaming Market (2026-2032)
- Nauru RPG Gaming Market (2026-2032)
- Namibia RPG Gaming Market (2026-2032)
- Mozambique RPG Gaming Market (2026-2032)
- Montenegro RPG Gaming Market (2026-2032)
- Mongolia RPG Gaming Market (2026-2032)
- Monaco RPG Gaming Market (2026-2032)
- Micronesia RPG Gaming Market (2026-2032)
Industry Events and Analyst Meet

EV India Expo 2026

HIMTEX 2026

India Refining Summit 2026

India EV Show 2026

EV tech India Expo 2026
Whitepaper
- Middle East & Africa Commercial Security Market Click here to view more.
- Middle East & Africa Fire Safety Systems & Equipment Market Click here to view more.
- GCC Drone Market Click here to view more.
- Middle East Lighting Fixture Market Click here to view more.
- GCC Physical & Perimeter Security Market Click here to view more.