United States (US) Mortar Market (2026-2032) | Value, Share, Size, Growth, Trends, Analysis, Companies, Outlook, Revenue, Industry, Forecast
Market Forecast By Type (Wet Mixed Mortar, Dry Mortar), By Application (Construction Industry, Home Decoration Industry, Others) And Competitive Landscape
| Product Code: ETC042521 | Publication Date: Jan 2021 | Updated Date: Jun 2026 | Product Type: Report | |
| Publisher: 6Wresearch | Author: Bhawna Singh | No. of Pages: 70 | No. of Figures: 35 | No. of Tables: 5 |
United States (US) Mortar Market Summary
The united states (us) mortar market was estimated at USD 153 Million in 2025 and is projected to reach USD 181 Million by 2032, growing at a CAGR of 3.0% from 2026 to 2032.
United States (US) Mortar Market Growth Rate Analysis (2021-2032)
The US mortar market experienced a notable recovery post-pandemic, rebounding from a decline of -0.6% in 2021 to a robust growth of 5.8% in 2022. This upward trajectory is driven by increased construction activities and heightened consumer demand, particularly in infrastructure development and residential projects. From 2023 to 2027, growth rates stabilize between 3.0% and 3.4%, reflecting ongoing investments in energy-efficient construction practices and digitalization in building processes. However, a slight slowdown is anticipated toward the end of the decade, with growth tapering to 2.4% by 2030. This adjustment could be attributed to potential market saturation and shifts in technology adoption rates that impact traditional mortar applications.
United States (US) Mortar Market Year-wise Growth Rate and Key Drivers
This graph highlights how the United States (US) Mortar Market has steadily grown over the past five years, supported by major growth factors.
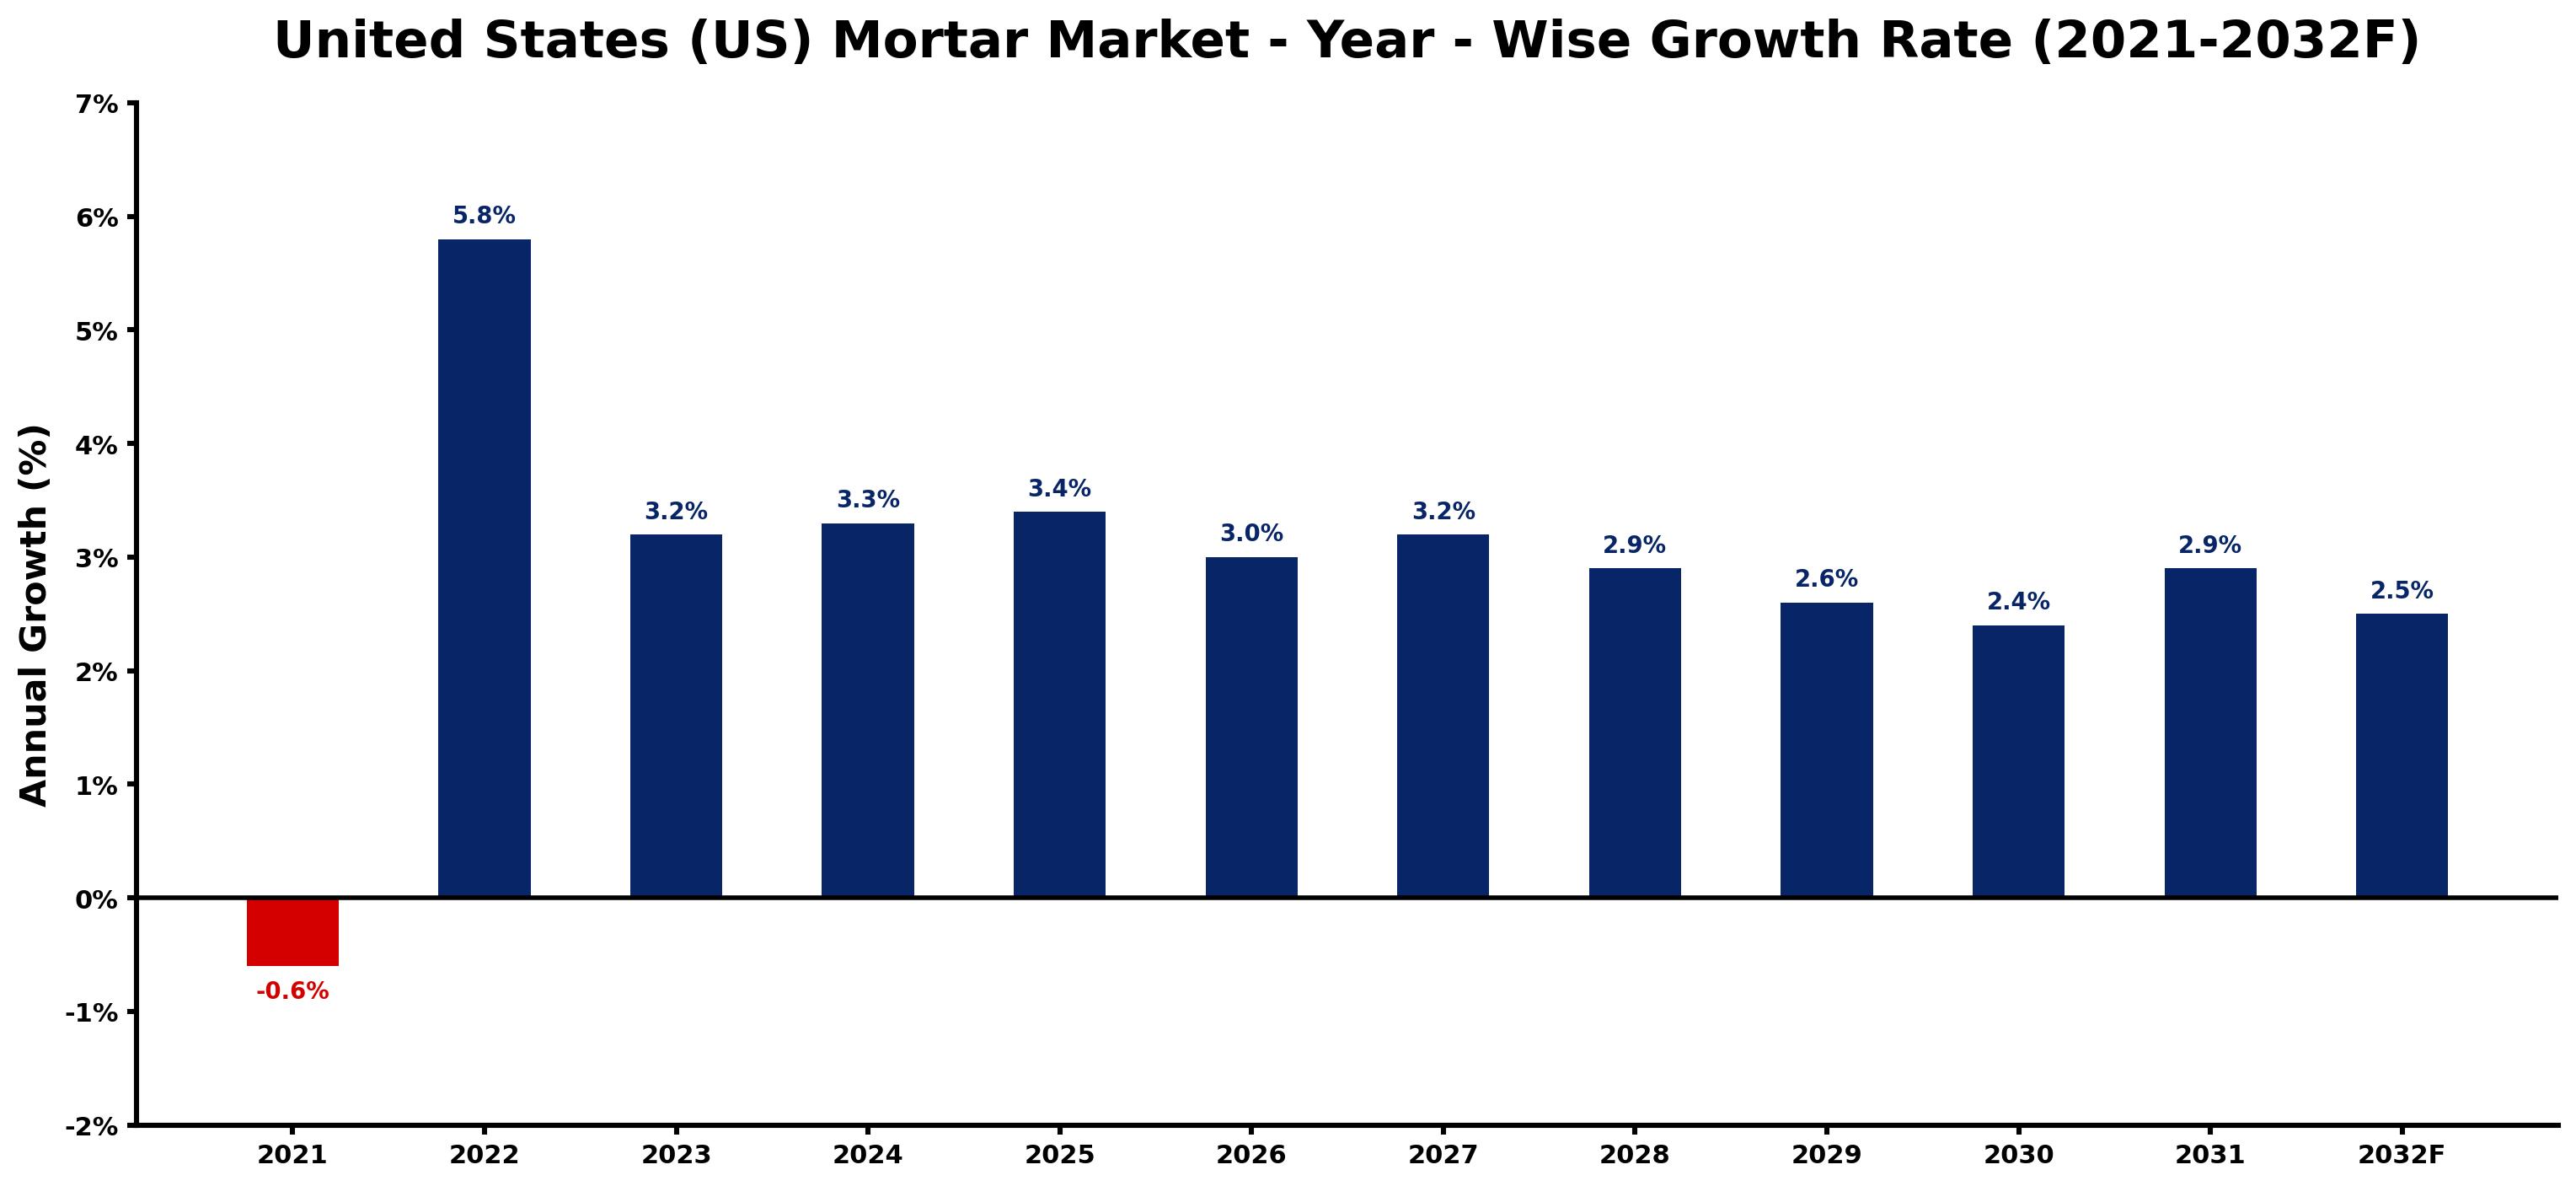
The table below presents the year wise growth rates along with the key drivers influencing the market
| Year | Growth Rate | Major Drivers |
| 2021 | -0.6% | Supply chain disruptions during the pandemic hindered construction projects, leading to reduced demand for mortar products. |
| 2022 | 5.8% | Increased home renovation activities highlighted the need for versatile mortar solutions. |
| 2023 | 3.2% | Construction industry recovery emphasized sustainable products, boosting eco-friendly mortar formulations. |
| 2024 | 3.3% | Technological improvements in mixing processes enhanced mortar quality and application efficiency. |
| 2025 | 3.4% | Urban infrastructure developments created significant opportunities for advanced mortar applications. |
| 2026 | 3.0% | A shift towards modular construction techniques necessitated innovations in mortar products. |
| 2027 | 3.2% | The expansion of green building initiatives drove interest in low-VOC mortar solutions. |
| 2028 | 2.9% | Rising construction costs prompted builders to seek value-engineered mortar alternatives. |
| 2029 | 2.6% | Increased focus on energy-efficient buildings influenced demand for thermal insulation mortars. |
| 2030 | 2.4% | Emerging smart city projects integrated advanced mortar solutions for urban resilience. |
| 2031 | 2.9% | Supply chain enhancements ensured consistent availability of specialized mortar products nationwide. |
| 2032 | 2.5% | Evolving consumer preferences towards aesthetics elevated the role of decorative mortars. |
Note - Market size estimations and growth projections presented in this report are based on 6Wresearch's advanced forecasting approach, validated with industry datasets as of June 2026.
United States (US) Mortar Market Synopsis
The United States (US) Mortar Market is projected to reach 3.0% and witness significant growth during the forecast period (2026-2032). As a fundamental component of the construction industry, mortar serves a pivotal role in binding bricks and stones, thereby enabling the structural integrity of various projects. Several driving forces such as urbanization, enhanced infrastructure development, and escalating demand for both residential and commercial properties are propelling growth in this sector. This market is witnessing increasing diversity in mortar formulations, including options like cement mortar and lime mortar, tailored to meet specific construction needs. Additionally, there is a substantial shift towards sustainable and energy-efficient construction practices, further influencing market dynamics.
United States (US) Mortar Market Growth Drivers
The growth of the United States (US) Mortar Market can be attributed to several critical factors:
- The ongoing urbanization trend is significantly increasing the demand for construction materials, thereby boosting the mortar market.
- Infrastructure development initiatives, including highways, bridges, and public transportation projects, are creating substantial opportunities for mortar suppliers.
- Residential construction, driven by a growing population and increasing homeownership demand, is fostering higher consumption of various mortar types.
- The rise in commercial real estate activities, including office buildings and retail spaces, enhances the need for mortar in construction efforts.
- Technological advancements in mortar production processes, leading to enhanced product performance, are attracting consumers toward innovative offerings.
United States (US) Mortar Market Trends and Opportunities
The United States (US) Mortar Market is currently characterized by noteworthy trends that present opportunities for stakeholders:
- There is a significant trend towards specialty mortars designed for specific applications, such as high-performance and waterproof formulations, which are gaining traction in the market.
- Pre-mixed and ready-to-use mortar products are becoming increasingly popular due to their convenience and efficiency, catering to the demands of labor-driven construction projects.
- The emphasis on sustainability is leading manufacturers to innovate eco-friendly mortar solutions that align with environmental goals and regulatory standards.
- Research and development investments are focusing on creating advanced mortar products that offer improved durability, flexibility, and setting capabilities.
- Collaboration between construction firms and mortar manufacturers is becoming common to tailor products that meet unique project requirements.
United States (US) Mortar Market Challenges and Restraints
Despite the favorable growth trajectory of the United States (US) Mortar Market, several challenges persist:
- Intense competition among manufacturers is leading to price wars, which can diminish profit margins and create market instability.
- Volatility in raw material prices, particularly for ingredients like cement and sand, poses a significant challenge to maintaining production costs.
- Economic fluctuations and uncertainties can affect overall construction activity levels, impacting demand for mortar products.
- Regulatory changes focused on environmental impacts necessitate continuous adaptation and investment in product development.
- The construction industry currently faces labor shortages, which may hinder the effective application of mortar products on job sites.
United States (US) Mortar Market Investment Opportunities
The United States (US) Mortar Market holds substantial investment prospects for both domestic and international investors:
- The expected growth in the construction sector indicates a corresponding increase in demand for various mortar products, presenting lucrative investment avenues.
- Investing in businesses focused on developing eco-friendly and high-performance mortar products may yield significant returns as market preferences shift.
- Opportunities exist in the supply chain, particularly for companies that provide materials and technologies benefiting mortar production.
- Public sector infrastructure projects present a reliable avenue for investment, as government funding continues to prioritize construction initiatives.
- Market trends favoring pre-mixed and ready-to-use mortars indicate a growing segment for investments in manufacturing and distribution capabilities.
United States (US) Mortar Market Government Investment and Initiatives
Government policy plays a pivotal role in shaping the landscape of the United States (US) Mortar Market. Regulatory frameworks dictate the safety, quality, and environmental standards necessary for mortar usage in construction:
- Local, state, and federal building codes are continuously updated to ensure that all construction materials, including mortar, meet stringent safety and performance benchmarks.
- Government initiatives aimed at promoting sustainable building practices are influencing the development and adoption of eco-friendly mortar solutions.
- Public spending on infrastructure projects, such as roads, bridges, and public facilities, stimulates demand for mortar products across various construction segments.
- Incentives for eco-friendly building materials are pushing manufacturers to innovate and adhere to stricter environmental standards in mortar production.
- Trade policies and tariffs on imported building materials can also impact market dynamics by influencing competition and pricing within the mortar sector.
United States (US) Mortar Market Latest Developments (May 2025 - June 2026)
In recent months, the United States (US) Mortar Market has exhibited notable directional shifts, driven by the evolving construction landscape:
- Manufacturers are increasingly focusing on enhancing the sustainability of their products in response to growing regulatory pressures and consumer preferences.
- There has been a broader trend towards automation and digitalization in the manufacturing processes, aimed at improving efficiencies and reducing costs.
- New alliances between construction firms and raw material suppliers are being formed to streamline procurement and enhance product offerings.
- Investments in research and development have intensified, leading to innovations in specialty mortars that cater to specific technical requirements.
- The market is witnessing a rise in awareness around the importance of compliance with environmental and safety standards, affecting product formulation and marketing strategies.
United States (US) Mortar Market - Key Attractiveness of the Report
- 10 Years of Market Numbers
- Historical Data Starting from 2022 to 2025
- Base Year: 2025
- Forecast Data until 2032
- Key Performance Indicators Impacting the Market
- Major Upcoming Developments and Projects
Key Highlights of the Report:
- United States (US) Mortar Market Outlook
- Market Size of United States (US) Mortar Market, 2025
- Forecast of United States (US) Mortar Market, 2032F
- Historical Data and Forecast of United States (US) Mortar Revenues & Volume for the Period 2022-2032F
- United States (US) Mortar Market Trend Evolution
- United States (US) Mortar Market Drivers and Challenges
- United States (US) Mortar Price Trends
- United States (US) Mortar Porter's Five Forces
- United States (US) Mortar Industry Life Cycle
- Historical Data and Forecast of United States (US) Mortar Market Revenues & Volume By Type for the Period 2022-2032F
- Historical Data and Forecast of United States (US) Mortar Market Revenues & Volume By Wet Mixed Mortar for the Period 2022-2032F
- Historical Data and Forecast of United States (US) Mortar Market Revenues & Volume By Dry Mortar for the Period 2022-2032F
- Historical Data and Forecast of United States (US) Mortar Market Revenues & Volume By Application for the Period 2022-2032F
- Historical Data and Forecast of United States (US) Mortar Market Revenues & Volume By Construction Industry for the Period 2022-2032F
- Historical Data and Forecast of United States (US) Mortar Market Revenues & Volume By Home Decoration Industry for the Period 2022-2032F
- Historical Data and Forecast of United States (US) Mortar Market Revenues & Volume By Others for the Period 2022-2032F
- United States (US) Mortar Import Export Trade Statistics
- Market Opportunity Assessment By Type
- Market Opportunity Assessment By Application
- United States (US) Mortar Top Companies Market Share
- United States (US) Mortar Competitive Benchmarking By Technical and Operational Parameters
- United States (US) Mortar Company Profiles
- United States (US) Mortar Key Strategic Recommendations
Frequently Asked Questions About the Market Study (FAQs):
The growth is primarily driven by urbanization, infrastructure projects, and an increase in residential and commercial constructions.
Manufacturers face challenges such as intense competition, fluctuating raw material prices, and the need for innovation in sustainable products.
Government policies dictate safety and environmental regulations, impacting product development and market dynamics.
Investment opportunities are driven by rising demand for mortar products and innovations in eco-friendly and high-performance formulations.
6Wresearch actively monitors the United States (US) Mortar Market and publishes its comprehensive annual report, highlighting emerging trends, growth drivers, revenue analysis, and forecast outlook. Our insights help businesses to make data-backed strategic decisions with ongoing market dynamics. Our analysts track relevent industries related to the United States (US) Mortar Market, allowing our clients with actionable intelligence and reliable forecasts tailored to emerging regional needs.
Yes, we provide customisation as per your requirements. To learn more, feel free to contact us on sales@6wresearch.com
1 Executive Summary |
2 Introduction |
2.1 Key Highlights of the Report |
2.2 Report Description |
2.3 Market Scope & Segmentation |
2.4 Research Methodology |
2.5 Assumptions |
3 United States (US) Mortar Market Overview |
3.1 United States (US) Country Macro Economic Indicators |
3.2 United States (US) Mortar Market Revenues & Volume, 2022 & 2032F |
3.3 United States (US) Mortar Market - Industry Life Cycle |
3.4 United States (US) Mortar Market - Porter's Five Forces |
3.5 United States (US) Mortar Market Revenues & Volume Share, By Type, 2022 & 2032F |
3.6 United States (US) Mortar Market Revenues & Volume Share, By Application, 2022 & 2032F |
4 United States (US) Mortar Market Dynamics |
4.1 Impact Analysis |
4.2 Market Drivers |
4.2.1 Increasing demand for new construction and renovation projects in the United States |
4.2.2 Growth in the infrastructure development sector |
4.2.3 Rising population leading to the need for more residential and commercial buildings |
4.3 Market Restraints |
4.3.1 Fluctuating raw material prices affecting production costs |
4.3.2 Environmental regulations impacting the choice of materials used in mortar production |
4.3.3 Competition from alternative building materials like drywall and precast concrete |
5 United States (US) Mortar Market Trends |
6 United States (US) Mortar Market, By Types |
6.1 United States (US) Mortar Market, By Type |
6.1.1 Overview and Analysis |
6.1.2 United States (US) Mortar Market Revenues & Volume, By Type, 2022-2032F |
6.1.3 United States (US) Mortar Market Revenues & Volume, By Wet Mixed Mortar, 2022-2032F |
6.1.4 United States (US) Mortar Market Revenues & Volume, By Dry Mortar, 2022-2032F |
6.2 United States (US) Mortar Market, By Application |
6.2.1 Overview and Analysis |
6.2.2 United States (US) Mortar Market Revenues & Volume, By Construction Industry, 2022-2032F |
6.2.3 United States (US) Mortar Market Revenues & Volume, By Home Decoration Industry, 2022-2032F |
6.2.4 United States (US) Mortar Market Revenues & Volume, By Others, 2022-2032F |
7 United States (US) Mortar Market Import-Export Trade Statistics |
7.1 United States (US) Mortar Market Export to Major Countries |
7.2 United States (US) Mortar Market Imports from Major Countries |
8 United States (US) Mortar Market Key Performance Indicators |
8.1 Average price of raw materials used in mortar production |
8.2 Number of new construction permits issued in the United States |
8.3 Rate of urbanization in key metropolitan areas influencing demand for mortar |
9 United States (US) Mortar Market - Opportunity Assessment |
9.1 United States (US) Mortar Market Opportunity Assessment, By Type, 2022 & 2032F |
9.2 United States (US) Mortar Market Opportunity Assessment, By Application, 2022 & 2032F |
10 United States (US) Mortar Market - Competitive Landscape |
10.1 United States (US) Mortar Market Revenue Share, By Companies, 2025 |
10.2 United States (US) Mortar Market Competitive Benchmarking, By Operating and Technical Parameters |
11 Company Profiles |
12 Recommendations |
13 Disclaimer |
Global Go To Market Strategy - 2030
Export potential enables firms to identify high-growth global markets with greater confidence by combining advanced trade intelligence with a structured quantitative methodology. The framework analyzes emerging demand trends and country-level import patterns while integrating macroeconomic and trade datasets such as GDP and population forecasts, bilateral import–export flows, tariff structures, elasticity differentials between developed and developing economies, geographic distance, and import demand projections. Using weighted trade values from 2020–2024 as the base period to project country-to-country export potential for 2030, these inputs are operationalized through calculated drivers such as gravity model parameters, tariff impact factors, and projected GDP per-capita growth. Through an analysis of hidden potentials, demand hotspots, and market conditions that are most favorable to success, this method enables firms to focus on target countries, maximize returns, and global expansion with data, backed by accuracy.
By factoring in the projected importer demand gap that is currently unmet and could be potential opportunity, it identifies the potential for the Exporter (Country) among 190 countries, against the general trade analysis, which identifies the biggest importer or exporter.
To discover high-growth global markets and optimize your business strategy:
Click Here
Pricing
- Single User License$ 1,995
- Department License$ 2,400
- Site License$ 3,120
- Global License$ 3,795

Leadership Perspectives from Industry Events
Search
Thought Leadership and Analyst Meet


Our Clients
6WResearch In News
- India Air Conditioner Market Set for Strong Rebound in 2026 After Weather-Led Correction and GST-Driven Recovery: 6Wresearch
- ADAS in India: How Automatic Emergency Braking, Blind Spot Detection & Driver Monitoring are Transforming Road Safety
- Doha a strategic location for EV manufacturing hub: IPA Qatar
- Demand for luxury TVs surging in the GCC, says Samsung
- Empowering Growth: The Thriving Journey of Bangladesh’s Cable Industry
- Demand for luxury TVs surging in the GCC, says Samsung
Latest Reports
- Nicaragua RPG Gaming Market (2026-2032)
- New Zealand RPG Gaming Market (2026-2032)
- Netherlands RPG Gaming Market (2026-2032)
- Nauru RPG Gaming Market (2026-2032)
- Namibia RPG Gaming Market (2026-2032)
- Mozambique RPG Gaming Market (2026-2032)
- Montenegro RPG Gaming Market (2026-2032)
- Mongolia RPG Gaming Market (2026-2032)
- Monaco RPG Gaming Market (2026-2032)
- Micronesia RPG Gaming Market (2026-2032)
Industry Events and Analyst Meet

HIMTEX 2026

India Refining Summit 2026

India EV Show 2026

EV tech India Expo 2026

Auto Tech Asia 2026
Whitepaper
- Middle East & Africa Commercial Security Market Click here to view more.
- Middle East & Africa Fire Safety Systems & Equipment Market Click here to view more.
- GCC Drone Market Click here to view more.
- Middle East Lighting Fixture Market Click here to view more.
- GCC Physical & Perimeter Security Market Click here to view more.