United States (US) Nano Copper Oxide Market (2026-2032) Outlook | Share, Growth, Size, Companies, Analysis, Trends, Value, Forecast, Industry & Revenue
Market Forecast By Type (Powder, Dispersed), By Application (Electricals & Electronics, Paints & Coatings, Catalysts, Energy Storage) And Competitive Landscape
| Product Code: ETC197653 | Publication Date: May 2022 | Updated Date: Jun 2026 | Product Type: Market Research Report | |
| Publisher: 6Wresearch | Author: Dhaval Chaurasia | No. of Pages: 60 | No. of Figures: 40 | No. of Tables: 7 |
United States (US) Nano Copper Oxide Market Size, Share & Growth Rate
The United States (US) Nano Copper Oxide Market was estimated at USD 155 Million in 2025 and is projected to reach USD 182 Million by 2032, growing at a CAGR of 2.3% from 2026 to 2032. This growth trajectory is primarily driven by the surging demand for high-performance materials in electronics, healthcare, and energy sectors, which leverage the unique properties of nano copper oxide. Coupled with increased investments in research and development, the market stands poised for considerable expansion as industries continue to seek innovative and sustainable solutions.
United States (US) Nano Copper Oxide Market Year-wise Growth Rate and Key Drivers
This graph highlights how the United States (US) Nano Copper Oxide Market has steadily grown over the years, supported by major growth factors.
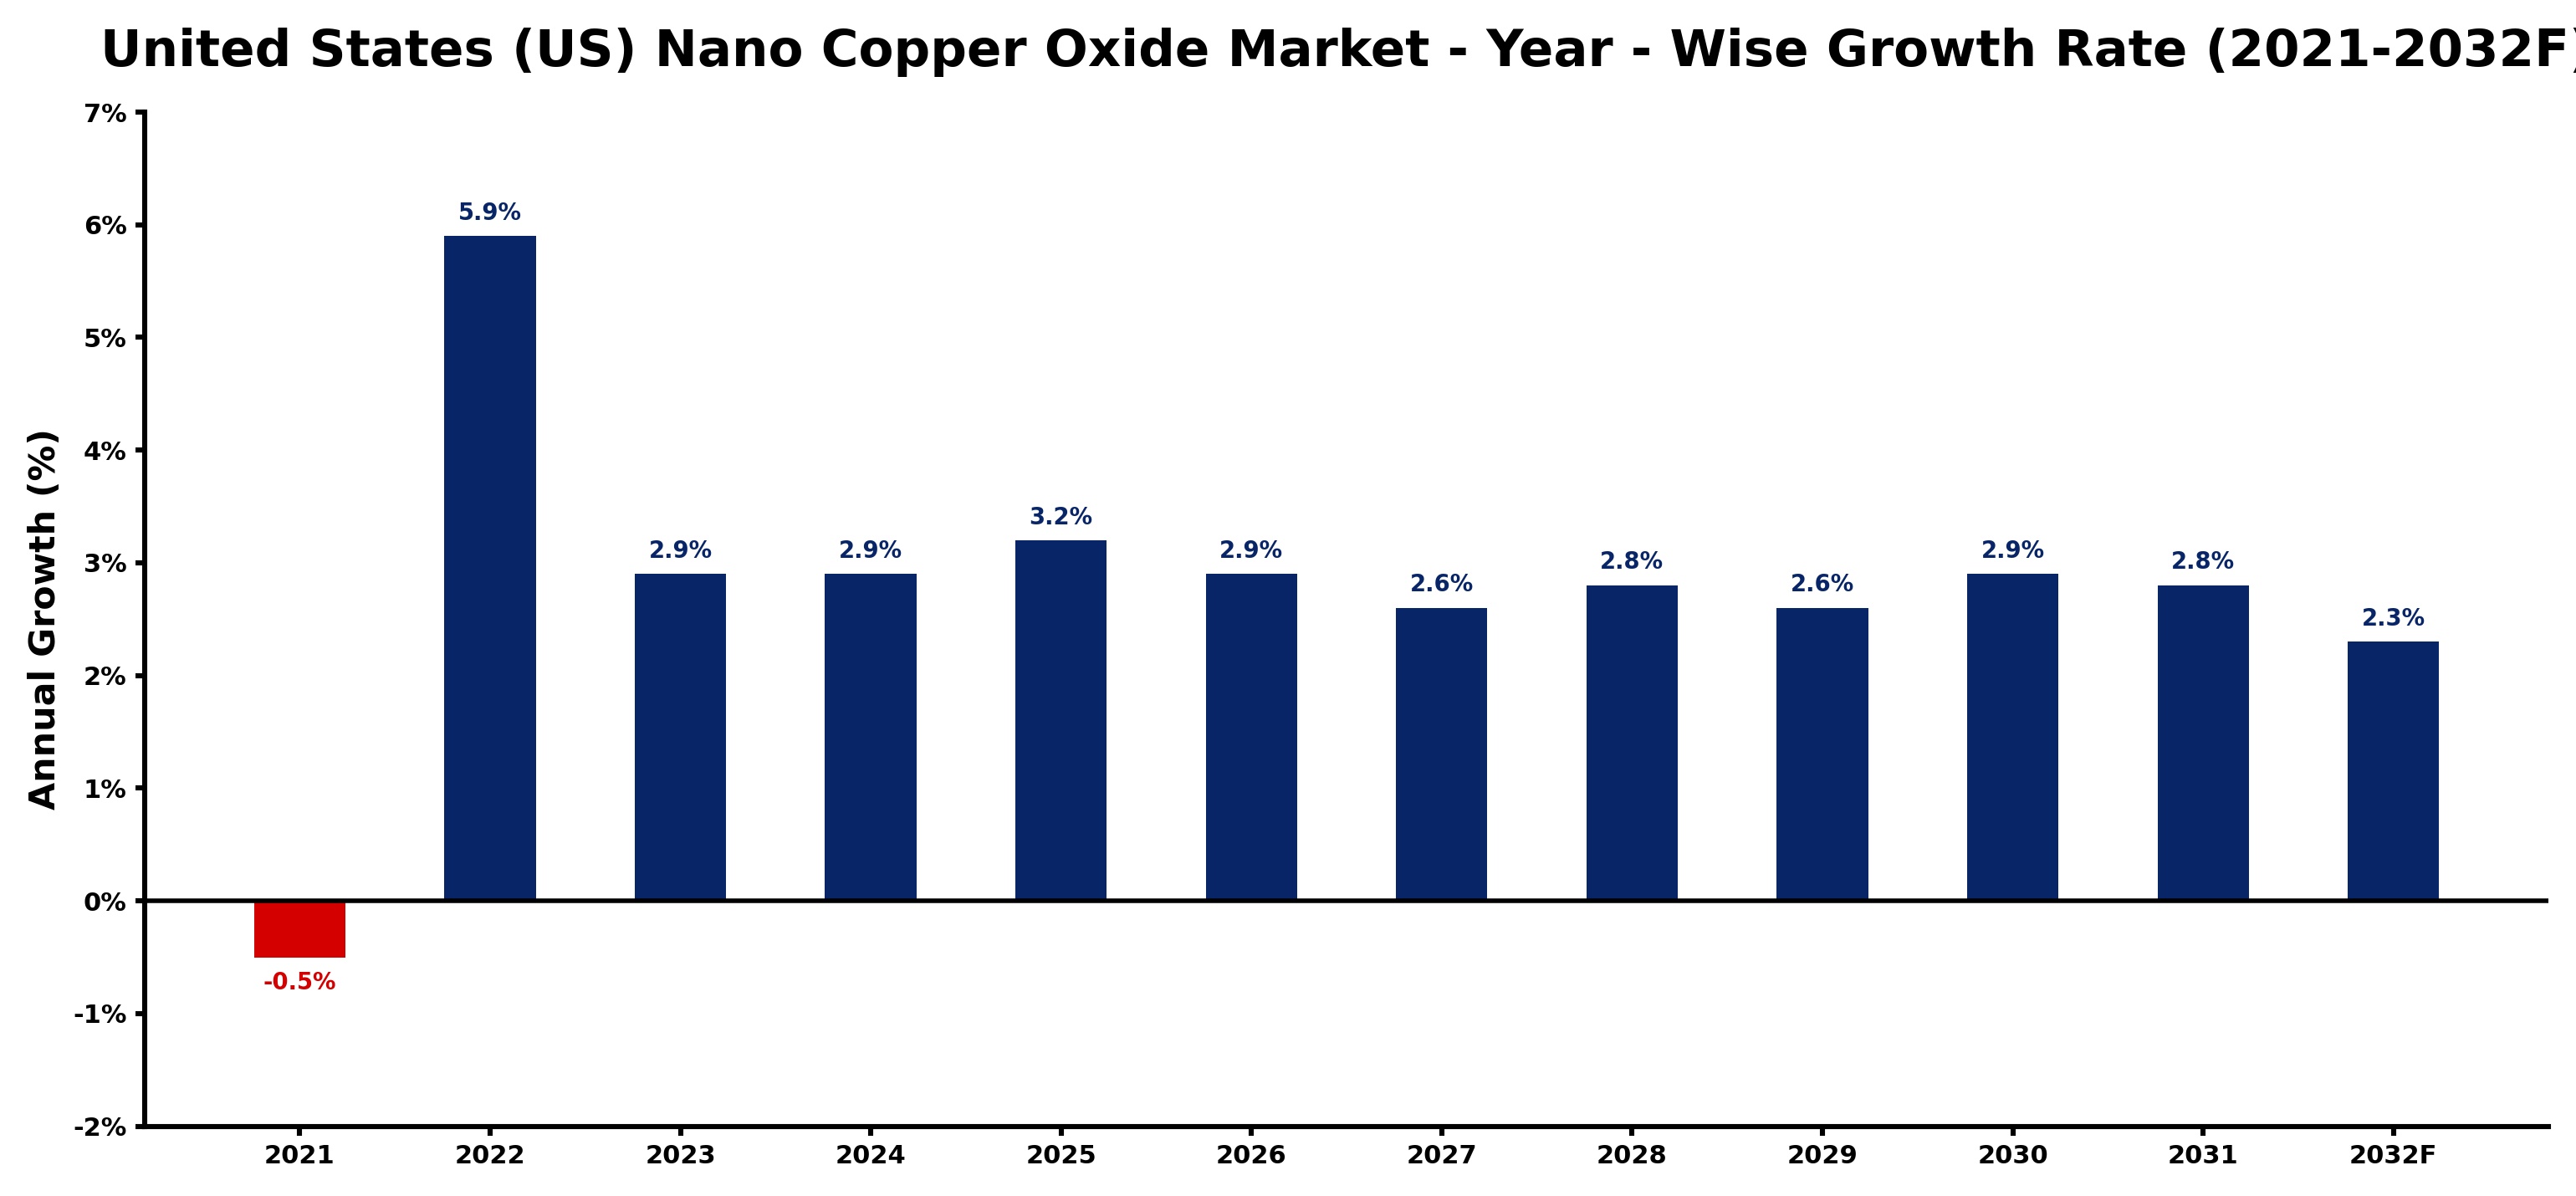
The table below presents the year‑wise growth rates along with the key drivers influencing the market
| Year | Growth Rate | Major Drivers |
| 2021 | -0.5% | Supply chain disruptions limited availability |
| 2022 | 5.9% | Increased demand for electronics |
| 2023 | 2.9% | Advancements in nanotechnology applications |
| 2024 | 2.9% | Growing renewable energy sector demand |
| 2025 | 3.2% | Rising automotive industry utilization |
| 2026 | 2.9% | Expansion in healthcare applications |
| 2027 | 2.6% | Increased focus on sustainability practices |
| 2028 | 2.8% | Emerging markets driving consumption growth |
| 2029 | 2.6% | Technological innovations enhancing production |
| 2030 | 2.9% | Collaborations boosting research initiatives |
| 2031 | 2.8% | Regulatory support for nanomaterials |
| 2032 | 2.3% | Consumer awareness of benefits rising |
Note - Market size estimations and growth projections presented in this report are based on 6Wresearch’s advanced forecasting approach, validated with industry datasets as of June 2026.
United States (US) Nano Copper Oxide Market Synopsis
The strongest force shaping the United States (US) Nano Copper Oxide Market is the rapid advancement of nanotechnology and its versatile applications. Industries are increasingly utilizing nano copper oxide for its exceptional properties, such as high thermal conductivity and antimicrobial effects, driving broader adoption across various sectors.
Additionally, the rising emphasis on sustainable and eco-friendly technologies has intensified the focus on nano copper oxide. This material's potential to enhance product performance while meeting environmental regulations is encouraging businesses to integrate it into their manufacturing processes, thereby fostering market growth.
United States (US) Nano Copper Oxide Market Key Takeaways
- Strong demand from electronics, healthcare, and energy sectors is propelling market growth.
- Investment in R&D is crucial for innovation and development of new applications.
- Regulatory frameworks are evolving to ensure safe usage while promoting sustainable practices.
- Increased awareness of the benefits of nano copper oxide is gradually expanding its market acceptance.
- Challenges related to production costs and material alternatives continue to influence market dynamics.
Evaluation of Restraints in United States (US) Nano Copper Oxide Market
Despite its promising potential, the United States (US) Nano Copper Oxide Market faces several restraints that could limit growth. High production costs associated with nano copper oxide manufacturing present a significant barrier, making it less competitive compared to traditional materials. Furthermore, there is a notable lack of awareness regarding its advantages among end-users, which inhibits widespread adoption. These factors necessitate ongoing education and strategic marketing efforts to illuminate the material's benefits, particularly as industries shift towards more innovative solutions.
United States (US) Nano Copper Oxide Market Trends
Several current and emerging trends are shaping the United States (US) Nano Copper Oxide Market. The increasing adoption of nano copper oxide in the development of antimicrobial coatings is notable, particularly in healthcare environments where hygiene and safety are paramount. Additionally, the use of nano copper oxide in energy-efficient technologies, such as catalysts and sensors, is gaining traction as industries look to reduce their carbon footprint. These trends are aligned with a broader movement toward sustainable practices that prioritize both performance and environmental responsibility.
United States (US) Nano Copper Oxide Market Opportunities
Investment opportunities in the United States (US) Nano Copper Oxide Market are rich and varied. With its unique properties, nano copper oxide is increasingly sought after for high-performance applications, which opens avenues for investors in production and product development. There is a growing interest in startups that innovate in nanomaterial applications, particularly those that address specific industry needs. Collaborations between corporations and research institutions could further unlock potential, enhancing capabilities in R&D and expanding market reach.
Government Initiatives in the United States (US) Nano Copper Oxide Market
Government policies surrounding the United States (US) Nano Copper Oxide Market focus heavily on safety and environmental protection. Agencies such as the Environmental Protection Agency (EPA) regulate nano copper oxide under existing frameworks to assess its health impacts and ecological safety. Compliance with these regulations is critical for companies aiming to build consumer trust while ensuring access to the market. Policies are also being adjusted to encourage the responsible use of nanomaterials, facilitating the growth of this innovative sector.
Future Insights of the United States (US) Nano Copper Oxide Market
Looking ahead to 2026-2032, the United States (US) Nano Copper Oxide Market is poised for robust growth driven by the continuous evolution of nanotechnology. As industries increasingly recognize the value of integrating nano copper oxide into various applications, demand is expected to soar. Advancements in manufacturing processes, coupled with heightened awareness of the benefits of nanomaterials, will likely propel market dynamics forward. This period presents a significant opportunity for innovation, and companies that can navigate the market effectively are well-positioned to capitalize on emerging trends.
United States (US) Nano Copper Oxide Market Latest Developments (May 2025 - June 2026)
Recent developments in the United States (US) Nano Copper Oxide Market indicate a growing momentum towards collaborative research initiatives. Companies are increasingly partnering with academic institutions to explore novel applications for nano copper oxide, particularly in the realms of advanced materials and sustainable technology. Furthermore, industry conferences and trade shows have highlighted innovative breakthroughs in production processes that aim to reduce costs while maintaining quality, signaling a proactive approach to overcoming existing market barriers.
United States (US) Nano Copper Oxide Market - Key Attractiveness of the Report
- 10 Years of Market Numbers
- Historical Data Starting from 2022 to 2025
- Base Year: 2025
- Forecast Data until 2032
- Key Performance Indicators Impacting the Market
- Major Upcoming Developments and Projects
Key Highlights of the Report:
- United States (US) Nano Copper Oxide Market Outlook
- Market Size of United States (US) Nano Copper Oxide Market, 2025
- Forecast of United States (US) Nano Copper Oxide Market, 2032
- Historical Data and Forecast of United States (US) Nano Copper Oxide Revenues & Volume for the Period 2022-2032F
- United States (US) Nano Copper Oxide Market Trend Evolution
- United States (US) Nano Copper Oxide Market Drivers and Challenges
- United States (US) Nano Copper Oxide Price Trends
- United States (US) Nano Copper Oxide Porter's Five Forces
- United States (US) Nano Copper Oxide Industry Life Cycle
- Historical Data and Forecast of United States (US) Nano Copper Oxide Market Revenues & Volume By Type for the Period 2022-2032F
- Historical Data and Forecast of United States (US) Nano Copper Oxide Market Revenues & Volume By Powder for the Period 2022-2032F
- Historical Data and Forecast of United States (US) Nano Copper Oxide Market Revenues & Volume By Dispersed for the Period 2022-2032F
- Historical Data and Forecast of United States (US) Nano Copper Oxide Market Revenues & Volume By Application for the Period 2022-2032F
- Historical Data and Forecast of United States (US) Nano Copper Oxide Market Revenues & Volume By Electricals & Electronics for the Period 2022-2032F
- Historical Data and Forecast of United States (US) Nano Copper Oxide Market Revenues & Volume By Paints & Coatings for the Period 2022-2032F
- Historical Data and Forecast of United States (US) Nano Copper Oxide Market Revenues & Volume By Catalysts for the Period 2022-2032F
- Historical Data and Forecast of United States (US) Nano Copper Oxide Market Revenues & Volume By Energy Storage for the Period 2022-2032F
- United States (US) Nano Copper Oxide Import Export Trade Statistics
- Market Opportunity Assessment By Type
- Market Opportunity Assessment By Application
- United States (US) Nano Copper Oxide Top Companies Market Share
- United States (US) Nano Copper Oxide Competitive Benchmarking By Technical and Operational Parameters
- United States (US) Nano Copper Oxide Company Profiles
- United States (US) Nano Copper Oxide Key Strategic Recommendations
United States (US) Nano Copper Oxide Market - Frequently Asked Questions
The primary drivers include increasing demand for advanced electronics, antimicrobial coatings, and catalysts, coupled with substantial investments in research and development.
The United States (US) Nano Copper Oxide Market was estimated at USD 155 Million in 2025, projected to reach USD 182 Million by 2032, growing at a CAGR of 2.3% from 2026 to 2032.
Nano copper oxide is widely used in electronics for conductive materials, in healthcare for antimicrobial coatings, and in energy as catalysts and sensors.
Yes, regulations regarding safety and environmental impact are stringent, and companies must comply with guidelines from agencies like the EPA and OSHA.
High production costs and limited awareness regarding the benefits of nano copper oxide among potential end-users are significant challenges that the industry must address.
6Wresearch actively monitors the United States (US) Nano Copper Oxide Market and publishes its comprehensive annual report, highlighting emerging trends, growth drivers, revenue analysis, and forecast outlook. Our insights help businesses to make data-backed strategic decisions with ongoing market dynamics. Our analysts track relevent industries related to the United States (US) Nano Copper Oxide Market, allowing our clients with actionable intelligence and reliable forecasts tailored to emerging regional needs.
Yes, we provide customisation as per your requirements. To learn more, feel free to contact us on sales@6wresearch.com
1 Executive Summary |
2 Introduction |
2.1 Key Highlights of the Report |
2.2 Report Description |
2.3 Market Scope & Segmentation |
2.4 Research Methodology |
2.5 Assumptions |
3 United States (US) Nano Copper Oxide Market Overview |
3.1 United States (US) Country Macro Economic Indicators |
3.2 United States (US) Nano Copper Oxide Market Revenues & Volume, 2022 & 2032F |
3.3 United States (US) Nano Copper Oxide Market - Industry Life Cycle |
3.4 United States (US) Nano Copper Oxide Market - Porter's Five Forces |
3.5 United States (US) Nano Copper Oxide Market Revenues & Volume Share, By Type, 2022 & 2032F |
3.6 United States (US) Nano Copper Oxide Market Revenues & Volume Share, By Application, 2022 & 2032F |
4 United States (US) Nano Copper Oxide Market Dynamics |
4.1 Impact Analysis |
4.2 Market Drivers |
4.2.1 Increasing demand for nano copper oxide in electronics and electrical industries due to its superior properties such as high thermal conductivity and electrical conductivity. |
4.2.2 Growing investments in research and development for innovative applications of nano copper oxide in sectors like healthcare, energy, and catalysis. |
4.3 Market Restraints |
4.3.1 High production costs associated with manufacturing nano copper oxide at a commercial scale. |
4.3.2 Stringent regulations and environmental concerns related to the use and disposal of nano copper oxide. |
5 United States (US) Nano Copper Oxide Market Trends |
6 United States (US) Nano Copper Oxide Market, By Types |
6.1 United States (US) Nano Copper Oxide Market, By Type |
6.1.1 Overview and Analysis |
6.1.2 United States (US) Nano Copper Oxide Market Revenues & Volume, By Type, 2022-2032F |
6.1.3 United States (US) Nano Copper Oxide Market Revenues & Volume, By Powder, 2022-2032F |
6.1.4 United States (US) Nano Copper Oxide Market Revenues & Volume, By Dispersed, 2022-2032F |
6.2 United States (US) Nano Copper Oxide Market, By Application |
6.2.1 Overview and Analysis |
6.2.2 United States (US) Nano Copper Oxide Market Revenues & Volume, By Electricals & Electronics, 2022-2032F |
6.2.3 United States (US) Nano Copper Oxide Market Revenues & Volume, By Paints & Coatings, 2022-2032F |
6.2.4 United States (US) Nano Copper Oxide Market Revenues & Volume, By Catalysts, 2022-2032F |
6.2.5 United States (US) Nano Copper Oxide Market Revenues & Volume, By Energy Storage, 2022-2032F |
7 United States (US) Nano Copper Oxide Market Import-Export Trade Statistics |
7.1 United States (US) Nano Copper Oxide Market Export to Major Countries |
7.2 United States (US) Nano Copper Oxide Market Imports from Major Countries |
8 United States (US) Nano Copper Oxide Market Key Performance Indicators |
8.1 Research and development expenditure by key players in the nano copper oxide market. |
8.2 Number of patents filed for new applications of nano copper oxide. |
8.3 Adoption rate of nano copper oxide in emerging industries like healthcare and energy. |
9 United States (US) Nano Copper Oxide Market - Opportunity Assessment |
9.1 United States (US) Nano Copper Oxide Market Opportunity Assessment, By Type, 2022 & 2032F |
9.2 United States (US) Nano Copper Oxide Market Opportunity Assessment, By Application, 2022 & 2032F |
10 United States (US) Nano Copper Oxide Market - Competitive Landscape |
10.1 United States (US) Nano Copper Oxide Market Revenue Share, By Companies, 2025 |
10.2 United States (US) Nano Copper Oxide Market Competitive Benchmarking, By Operating and Technical Parameters |
11 Company Profiles |
12 Recommendations |
13 Disclaimer |
Global Go To Market Strategy - 2030
Export potential enables firms to identify high-growth global markets with greater confidence by combining advanced trade intelligence with a structured quantitative methodology. The framework analyzes emerging demand trends and country-level import patterns while integrating macroeconomic and trade datasets such as GDP and population forecasts, bilateral import–export flows, tariff structures, elasticity differentials between developed and developing economies, geographic distance, and import demand projections. Using weighted trade values from 2020–2024 as the base period to project country-to-country export potential for 2030, these inputs are operationalized through calculated drivers such as gravity model parameters, tariff impact factors, and projected GDP per-capita growth. Through an analysis of hidden potentials, demand hotspots, and market conditions that are most favorable to success, this method enables firms to focus on target countries, maximize returns, and global expansion with data, backed by accuracy.
By factoring in the projected importer demand gap that is currently unmet and could be potential opportunity, it identifies the potential for the Exporter (Country) among 190 countries, against the general trade analysis, which identifies the biggest importer or exporter.
To discover high-growth global markets and optimize your business strategy:
Click Here
Pricing
- Single User License$ 1,995
- Department License$ 2,400
- Site License$ 3,120
- Global License$ 3,795

Leadership Perspectives from Industry Events
Search
Thought Leadership and Analyst Meet


Our Clients
6WResearch In News
- India Air Conditioner Market Set for Strong Rebound in 2026 After Weather-Led Correction and GST-Driven Recovery: 6Wresearch
- ADAS in India: How Automatic Emergency Braking, Blind Spot Detection & Driver Monitoring are Transforming Road Safety
- Doha a strategic location for EV manufacturing hub: IPA Qatar
- Demand for luxury TVs surging in the GCC, says Samsung
- Empowering Growth: The Thriving Journey of Bangladesh’s Cable Industry
- Demand for luxury TVs surging in the GCC, says Samsung
Latest Reports
- Nicaragua RPG Gaming Market (2026-2032)
- New Zealand RPG Gaming Market (2026-2032)
- Netherlands RPG Gaming Market (2026-2032)
- Nauru RPG Gaming Market (2026-2032)
- Namibia RPG Gaming Market (2026-2032)
- Mozambique RPG Gaming Market (2026-2032)
- Montenegro RPG Gaming Market (2026-2032)
- Mongolia RPG Gaming Market (2026-2032)
- Monaco RPG Gaming Market (2026-2032)
- Micronesia RPG Gaming Market (2026-2032)
Industry Events and Analyst Meet

EV India Expo 2026

HIMTEX 2026

India Refining Summit 2026

India EV Show 2026

EV tech India Expo 2026
Whitepaper
- Middle East & Africa Commercial Security Market Click here to view more.
- Middle East & Africa Fire Safety Systems & Equipment Market Click here to view more.
- GCC Drone Market Click here to view more.
- Middle East Lighting Fixture Market Click here to view more.
- GCC Physical & Perimeter Security Market Click here to view more.