United States (US) Nitrogen Market Outlook | Companies, Growth, Industry, Value, Revenue, Analysis, Share, Trends, Size, Forecast & COVID-19 IMPACT
Market Forecast By End Users (Metal manufacturing & fabrication, Oil & Gas, Petrochemical, Pharmaceutical & Healthcare, Chemical, Food & Beverages, Electronics), By Form (Gas, Liquid), By Applications (Adhesives, Sealants used as rubber roof repair, Tubeless tire liners) And Competitive Landscape
| Product Code: ETC416697 | Publication Date: Oct 2022 | Updated Date: Aug 2025 | Product Type: Market Research Report | |
| Publisher: 6Wresearch | Author: Shubham Padhi | No. of Pages: 75 | No. of Figures: 35 | No. of Tables: 20 |
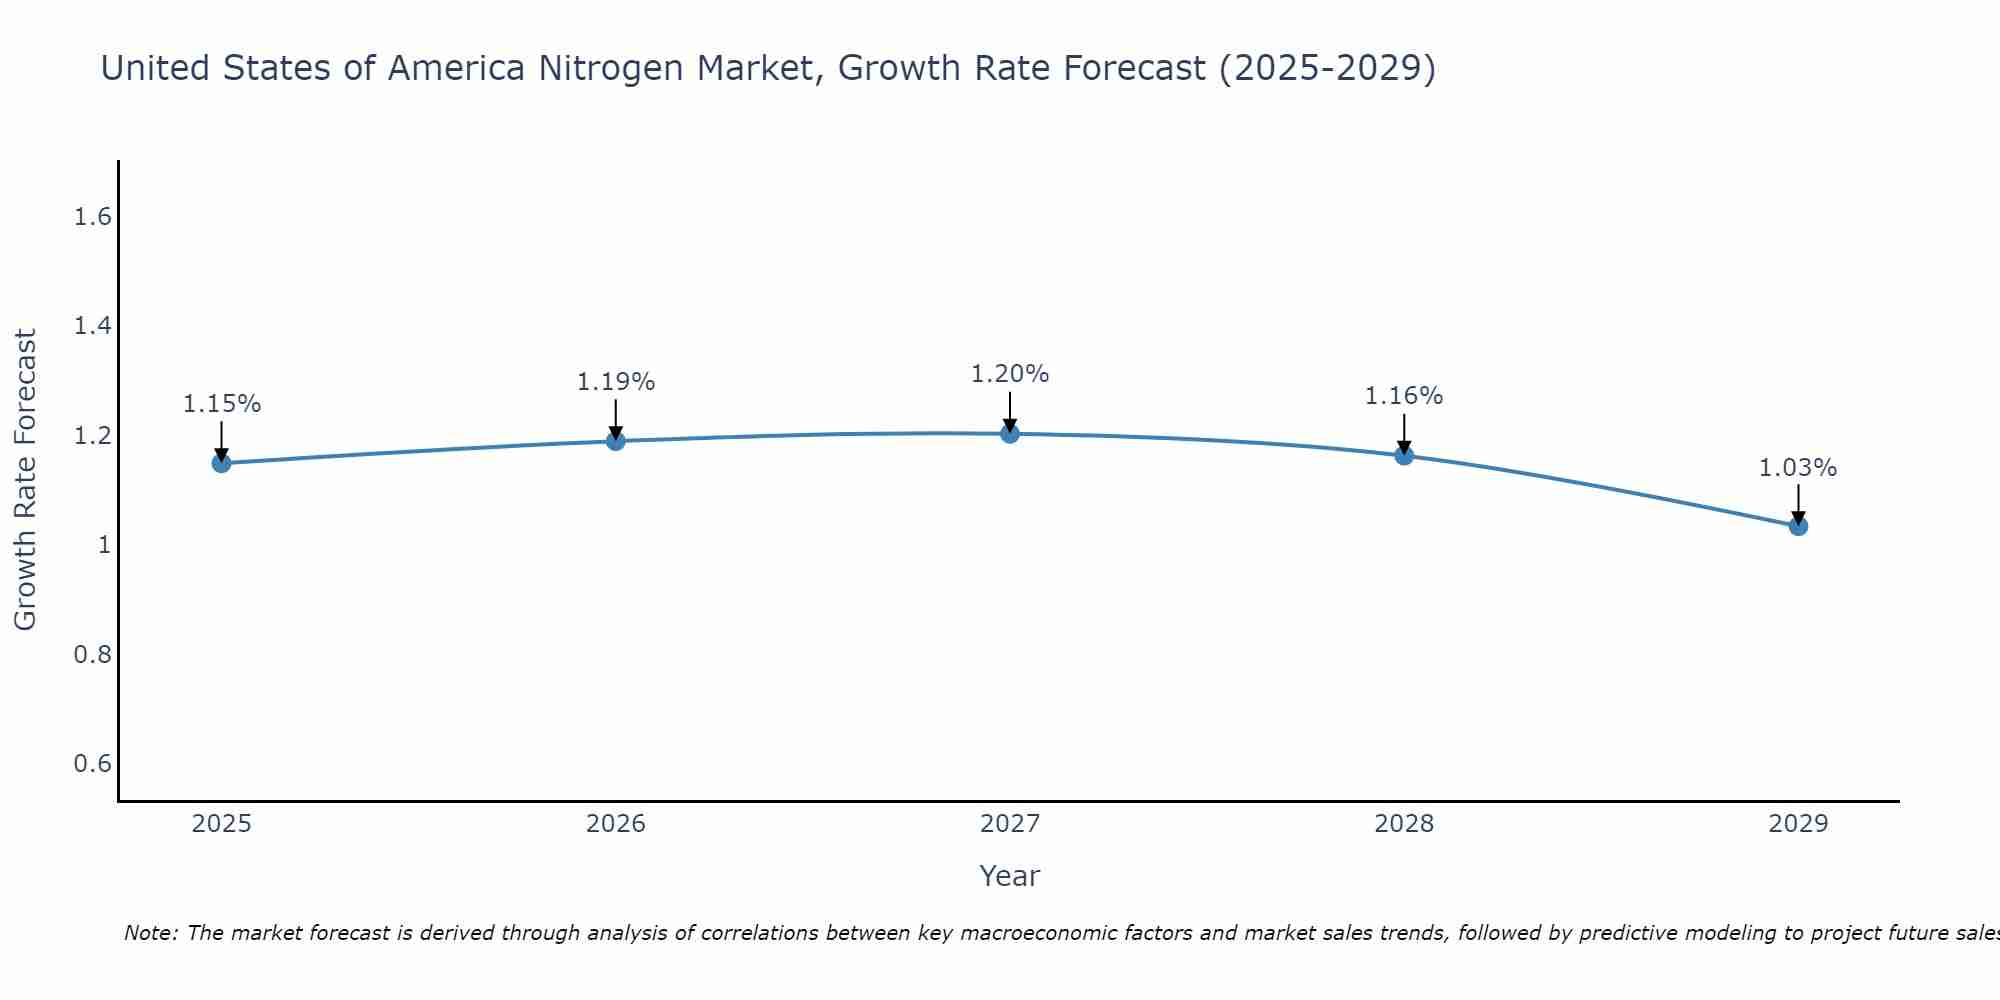
United States of America Nitrogen Market Size Growth Rate
The United States of America Nitrogen Market is projected to witness mixed growth rate patterns during 2025 to 2029. Growth accelerates to 1.20% in 2027, following an initial rate of 1.15%, before easing to 1.03% at the end of the period.
United States (US) Nitrogen Market Synopsis
The United States Nitrogen Market is a crucial segment of the country`s agriculture and chemical industries. Nitrogen is a key component in fertilizers, serving as a vital nutrient for plant growth and crop yield. The market is primarily driven by the demand for nitrogen-based fertilizers in agricultural activities across the country. The US is one of the largest consumers and producers of nitrogen fertilizers globally, with major companies such as CF Industries, Yara International, and Nutrien dominating the market. Factors influencing the market include fluctuating commodity prices, government regulations on agricultural practices, and technological advancements in nitrogen production processes. The market is expected to witness steady growth in the coming years, supported by the increasing need for sustainable agriculture practices and rising population driving food demand.
United States (US) Nitrogen Market Trends
The United States Nitrogen Market is currently experiencing several key trends. One major trend is the increasing demand for nitrogen fertilizers in the agriculture sector due to the growing population and the need to improve crop yields. Additionally, there is a shift towards more sustainable nitrogen management practices to reduce environmental impact, such as the use of precision agriculture techniques and controlled-release fertilizers. Another trend is the rising production of nitrogen products in the US, driven by investments in new production facilities and capacity expansions. Furthermore, the market is witnessing a trend towards consolidation and strategic partnerships among key players to strengthen their market positions and enhance distribution networks. Overall, these trends are shaping the US Nitrogen Market towards more sustainable practices and increased production capacity to meet growing demand.
United States (US) Nitrogen Market Challenges
In the US Nitrogen Market, one of the key challenges is overcapacity due to excess production capacity compared to demand, leading to price volatility and intense competition among producers. This overcapacity has been exacerbated by the influx of low-cost nitrogen imports, particularly from countries like China and Russia. Additionally, fluctuations in natural gas prices, a key input in nitrogen production, can impact the profitability of domestic nitrogen producers. Environmental regulations and increasing pressure to adopt sustainable practices are also posing challenges for nitrogen producers in terms of compliance costs and operational changes. Overall, navigating these challenges requires US nitrogen market players to focus on efficiency improvements, diversification of product offerings, and strategic partnerships to remain competitive in a rapidly evolving market landscape.
United States (US) Nitrogen Market Investment Opportunities
The United States Nitrogen Market offers various investment opportunities due to the increasing demand for nitrogen-based fertilizers in agriculture. Investing in nitrogen production facilities or companies involved in nitrogen manufacturing could be lucrative as the market continues to grow. Additionally, investing in agricultural companies that heavily rely on nitrogen fertilizers, such as corn or soybean producers, can also be a strategic move to capitalize on the market`s growth. Furthermore, with the rising trend towards sustainable agriculture practices, there is a growing demand for environmentally friendly nitrogen products, presenting opportunities for investments in companies focusing on sustainable nitrogen production technologies. Overall, the US Nitrogen Market presents diverse investment opportunities for those looking to capitalize on the agricultural sector`s growth and evolving trends.
Jordan Agar Market Government Policies
The US government implements various policies related to the Nitrogen Market, primarily focusing on environmental regulations and agricultural subsidies. The Environmental Protection Agency (EPA) sets limits on nitrogen emissions from industrial sources to reduce air and water pollution. Additionally, the Department of Agriculture provides subsidies and incentives to farmers to promote sustainable nitrogen use, such as through conservation programs and research funding for efficient fertilizer application techniques. These policies aim to balance the need for nitrogen in agriculture with the environmental concerns associated with its overuse, fostering a more sustainable and responsible approach to nitrogen management in the US market.
United States (US) Nitrogen Market Future Outlook
The future outlook for the United States Nitrogen Market appears positive, driven by growing demand from various end-use industries such as agriculture, chemical manufacturing, and pharmaceuticals. Factors such as population growth, increasing food production needs, and the rising adoption of nitrogen-based fertilizers in the agriculture sector are expected to fuel market growth. Additionally, technological advancements in nitrogen production processes and a shift towards sustainable and environmentally friendly nitrogen products are likely to create new opportunities in the market. However, challenges such as fluctuating raw material prices, regulatory constraints, and competition from alternative nitrogen sources may pose some hurdles. Overall, the US Nitrogen Market is anticipated to witness steady growth in the coming years, supported by robust demand dynamics and industry innovations.
Key Highlights of the Report:
- United States (US) Nitrogen Market Outlook
- Market Size of United States (US) Nitrogen Market, 2021
- Forecast of United States (US) Nitrogen Market, 2031
- Historical Data and Forecast of United States (US) Nitrogen Revenues & Volume for the Period 2018 - 2031
- United States (US) Nitrogen Market Trend Evolution
- United States (US) Nitrogen Market Drivers and Challenges
- United States (US) Nitrogen Price Trends
- United States (US) Nitrogen Porter's Five Forces
- United States (US) Nitrogen Industry Life Cycle
- Historical Data and Forecast of United States (US) Nitrogen Market Revenues & Volume By End Users for the Period 2018 - 2031
- Historical Data and Forecast of United States (US) Nitrogen Market Revenues & Volume By Metal manufacturing & fabrication for the Period 2018 - 2031
- Historical Data and Forecast of United States (US) Nitrogen Market Revenues & Volume By Oil & Gas for the Period 2018 - 2031
- Historical Data and Forecast of United States (US) Nitrogen Market Revenues & Volume By Petrochemical for the Period 2018 - 2031
- Historical Data and Forecast of United States (US) Nitrogen Market Revenues & Volume By Pharmaceutical & Healthcare for the Period 2018 - 2031
- Historical Data and Forecast of United States (US) Nitrogen Market Revenues & Volume By Chemical for the Period 2018 - 2031
- Historical Data and Forecast of United States (US) Nitrogen Market Revenues & Volume By Food & Beverages for the Period 2018 - 2031
- Historical Data and Forecast of United States (US) Nitrogen Market Revenues & Volume By Electronics for the Period 2018 - 2031
- Historical Data and Forecast of United States (US) Nitrogen Market Revenues & Volume By Form for the Period 2018 - 2031
- Historical Data and Forecast of United States (US) Nitrogen Market Revenues & Volume By Gas for the Period 2018 - 2031
- Historical Data and Forecast of United States (US) Nitrogen Market Revenues & Volume By Liquid for the Period 2018 - 2031
- Historical Data and Forecast of United States (US) Nitrogen Market Revenues & Volume By Applications for the Period 2018 - 2031
- Historical Data and Forecast of United States (US) Nitrogen Market Revenues & Volume By Adhesives for the Period 2018 - 2031
- Historical Data and Forecast of United States (US) Nitrogen Market Revenues & Volume By Sealants used as rubber roof repair for the Period 2018 - 2031
- Historical Data and Forecast of United States (US) Nitrogen Market Revenues & Volume By Tubeless tire liners for the Period 2018 - 2031
- United States (US) Nitrogen Import Export Trade Statistics
- Market Opportunity Assessment By End Users
- Market Opportunity Assessment By Form
- Market Opportunity Assessment By Applications
- United States (US) Nitrogen Top Companies Market Share
- United States (US) Nitrogen Competitive Benchmarking By Technical and Operational Parameters
- United States (US) Nitrogen Company Profiles
- United States (US) Nitrogen Key Strategic Recommendations
Frequently Asked Questions About the Market Study (FAQs):
6Wresearch actively monitors the United States (US) Nitrogen Market and publishes its comprehensive annual report, highlighting emerging trends, growth drivers, revenue analysis, and forecast outlook. Our insights help businesses to make data-backed strategic decisions with ongoing market dynamics. Our analysts track relevent industries related to the United States (US) Nitrogen Market, allowing our clients with actionable intelligence and reliable forecasts tailored to emerging regional needs.
Yes, we provide customisation as per your requirements. To learn more, feel free to contact us on sales@6wresearch.com
1 Executive Summary |
2 Introduction |
2.1 Key Highlights of the Report |
2.2 Report Description |
2.3 Market Scope & Segmentation |
2.4 Research Methodology |
2.5 Assumptions |
3 United States (US) Nitrogen Market Overview |
3.1 United States (US) Country Macro Economic Indicators |
3.2 United States (US) Nitrogen Market Revenues & Volume, 2021 & 2031F |
3.3 United States (US) Nitrogen Market - Industry Life Cycle |
3.4 United States (US) Nitrogen Market - Porter's Five Forces |
3.5 United States (US) Nitrogen Market Revenues & Volume Share, By End Users, 2021 & 2031F |
3.6 United States (US) Nitrogen Market Revenues & Volume Share, By Form, 2021 & 2031F |
3.7 United States (US) Nitrogen Market Revenues & Volume Share, By Applications, 2021 & 2031F |
4 United States (US) Nitrogen Market Dynamics |
4.1 Impact Analysis |
4.2 Market Drivers |
4.2.1 Increasing demand for nitrogen-based fertilizers in the agriculture sector |
4.2.2 Growth in industrial applications of nitrogen compounds, such as ammonia and urea |
4.2.3 Technological advancements leading to improved nitrogen production processes |
4.3 Market Restraints |
4.3.1 Volatility in raw material prices affecting nitrogen production costs |
4.3.2 Environmental concerns related to nitrogen pollution and its impact on ecosystems |
4.3.3 Competition from alternative fertilizers and nitrogen sources |
5 United States (US) Nitrogen Market Trends |
6 United States (US) Nitrogen Market, By Types |
6.1 United States (US) Nitrogen Market, By End Users |
6.1.1 Overview and Analysis |
6.1.2 United States (US) Nitrogen Market Revenues & Volume, By End Users, 2021-2031F |
6.1.3 United States (US) Nitrogen Market Revenues & Volume, By Metal manufacturing & fabrication, 2021-2031F |
6.1.4 United States (US) Nitrogen Market Revenues & Volume, By Oil & Gas, 2021-2031F |
6.1.5 United States (US) Nitrogen Market Revenues & Volume, By Petrochemical, 2021-2031F |
6.1.6 United States (US) Nitrogen Market Revenues & Volume, By Pharmaceutical & Healthcare, 2021-2031F |
6.1.7 United States (US) Nitrogen Market Revenues & Volume, By Chemical, 2021-2031F |
6.1.8 United States (US) Nitrogen Market Revenues & Volume, By Food & Beverages, 2021-2031F |
6.2 United States (US) Nitrogen Market, By Form |
6.2.1 Overview and Analysis |
6.2.2 United States (US) Nitrogen Market Revenues & Volume, By Gas, 2021-2031F |
6.2.3 United States (US) Nitrogen Market Revenues & Volume, By Liquid, 2021-2031F |
6.3 United States (US) Nitrogen Market, By Applications |
6.3.1 Overview and Analysis |
6.3.2 United States (US) Nitrogen Market Revenues & Volume, By Adhesives, 2021-2031F |
6.3.3 United States (US) Nitrogen Market Revenues & Volume, By Sealants used as rubber roof repair, 2021-2031F |
6.3.4 United States (US) Nitrogen Market Revenues & Volume, By Tubeless tire liners, 2021-2031F |
7 United States (US) Nitrogen Market Import-Export Trade Statistics |
7.1 United States (US) Nitrogen Market Export to Major Countries |
7.2 United States (US) Nitrogen Market Imports from Major Countries |
8 United States (US) Nitrogen Market Key Performance Indicators |
8.1 Average selling price of nitrogen-based fertilizers |
8.2 Nitrogen production capacity utilization rate |
8.3 Adoption rate of nitrogen-efficient agricultural practices |
8.4 Investment in research and development for nitrogen production technologies |
8.5 Regulatory compliance related to nitrogen emissions and pollution control |
9 United States (US) Nitrogen Market - Opportunity Assessment |
9.1 United States (US) Nitrogen Market Opportunity Assessment, By End Users, 2021 & 2031F |
9.2 United States (US) Nitrogen Market Opportunity Assessment, By Form, 2021 & 2031F |
9.3 United States (US) Nitrogen Market Opportunity Assessment, By Applications, 2021 & 2031F |
10 United States (US) Nitrogen Market - Competitive Landscape |
10.1 United States (US) Nitrogen Market Revenue Share, By Companies, 2021 |
10.2 United States (US) Nitrogen Market Competitive Benchmarking, By Operating and Technical Parameters |
11 Company Profiles |
12 Recommendations |
13 Disclaimer |
Global Go To Market Strategy - 2030
Export potential enables firms to identify high-growth global markets with greater confidence by combining advanced trade intelligence with a structured quantitative methodology. The framework analyzes emerging demand trends and country-level import patterns while integrating macroeconomic and trade datasets such as GDP and population forecasts, bilateral import–export flows, tariff structures, elasticity differentials between developed and developing economies, geographic distance, and import demand projections. Using weighted trade values from 2020–2024 as the base period to project country-to-country export potential for 2030, these inputs are operationalized through calculated drivers such as gravity model parameters, tariff impact factors, and projected GDP per-capita growth. Through an analysis of hidden potentials, demand hotspots, and market conditions that are most favorable to success, this method enables firms to focus on target countries, maximize returns, and global expansion with data, backed by accuracy.
By factoring in the projected importer demand gap that is currently unmet and could be potential opportunity, it identifies the potential for the Exporter (Country) among 190 countries, against the general trade analysis, which identifies the biggest importer or exporter.
To discover high-growth global markets and optimize your business strategy:
Click Here
Pricing
- Single User License$ 1,995
- Department License$ 2,400
- Site License$ 3,120
- Global License$ 3,795

Leadership Perspectives from Industry Events
Search
Thought Leadership and Analyst Meet


Our Clients
6WResearch In News
- India Air Conditioner Market Set for Strong Rebound in 2026 After Weather-Led Correction and GST-Driven Recovery: 6Wresearch
- ADAS in India: How Automatic Emergency Braking, Blind Spot Detection & Driver Monitoring are Transforming Road Safety
- Doha a strategic location for EV manufacturing hub: IPA Qatar
- Demand for luxury TVs surging in the GCC, says Samsung
- Empowering Growth: The Thriving Journey of Bangladesh’s Cable Industry
- Demand for luxury TVs surging in the GCC, says Samsung
Latest Reports
- Poland Fire Protection Systems Market (2026-2032)
- Cape Verde Portable Hand-Thrown Extinguisher Market (2026-2032)
- Canada Portable Hand-Thrown Extinguisher Market (2026-2032)
- Cameroon Portable Hand-Thrown Extinguisher Market (2026-2032)
- Burundi Portable Hand-Thrown Extinguisher Market (2026-2032)
- Burkina Faso Portable Hand-Thrown Extinguisher Market (2026-2032)
- Bulgaria Portable Hand-Thrown Extinguisher Market (2026-2032)
- Brunei Portable Hand-Thrown Extinguisher Market (2026-2032)
- Botswana Portable Hand-Thrown Extinguisher Market (2026-2032)
- Bosnia and Herzegovina Portable Hand-Thrown Extinguisher Market (2026-2032)
Industry Events and Analyst Meet

HIMTEX 2026

India Refining Summit 2026

India EV Show 2026

EV tech India Expo 2026

Auto Tech Asia 2026
Whitepaper
- Middle East & Africa Commercial Security Market Click here to view more.
- Middle East & Africa Fire Safety Systems & Equipment Market Click here to view more.
- GCC Drone Market Click here to view more.
- Middle East Lighting Fixture Market Click here to view more.
- GCC Physical & Perimeter Security Market Click here to view more.