United States (US) Non Alcoholic Beverages Market Outlook | Analysis, Value, COVID-19 IMPACT, Companies, Size, Revenue, Share, Trends, Industry, Forecast & Growth
Market Forecast By Type (Alcoholic Beverages, Non-Alcoholic Beverages, Bottled Water, Carbonated Soft Drinks, Fruit Juice, Milk), By Packaging Type (Cartons, Cans, Bottles, Others), By Distribution Channel (Online, Offline, Supermarkets, Departmental Stores, Specialty Stores) And Competitive Landscape
| Product Code: ETC189073 | Publication Date: May 2022 | Updated Date: Nov 2025 | Product Type: Market Research Report | |
| Publisher: 6Wresearch | Author: Summon Dutta | No. of Pages: 60 | No. of Figures: 40 | No. of Tables: 7 |
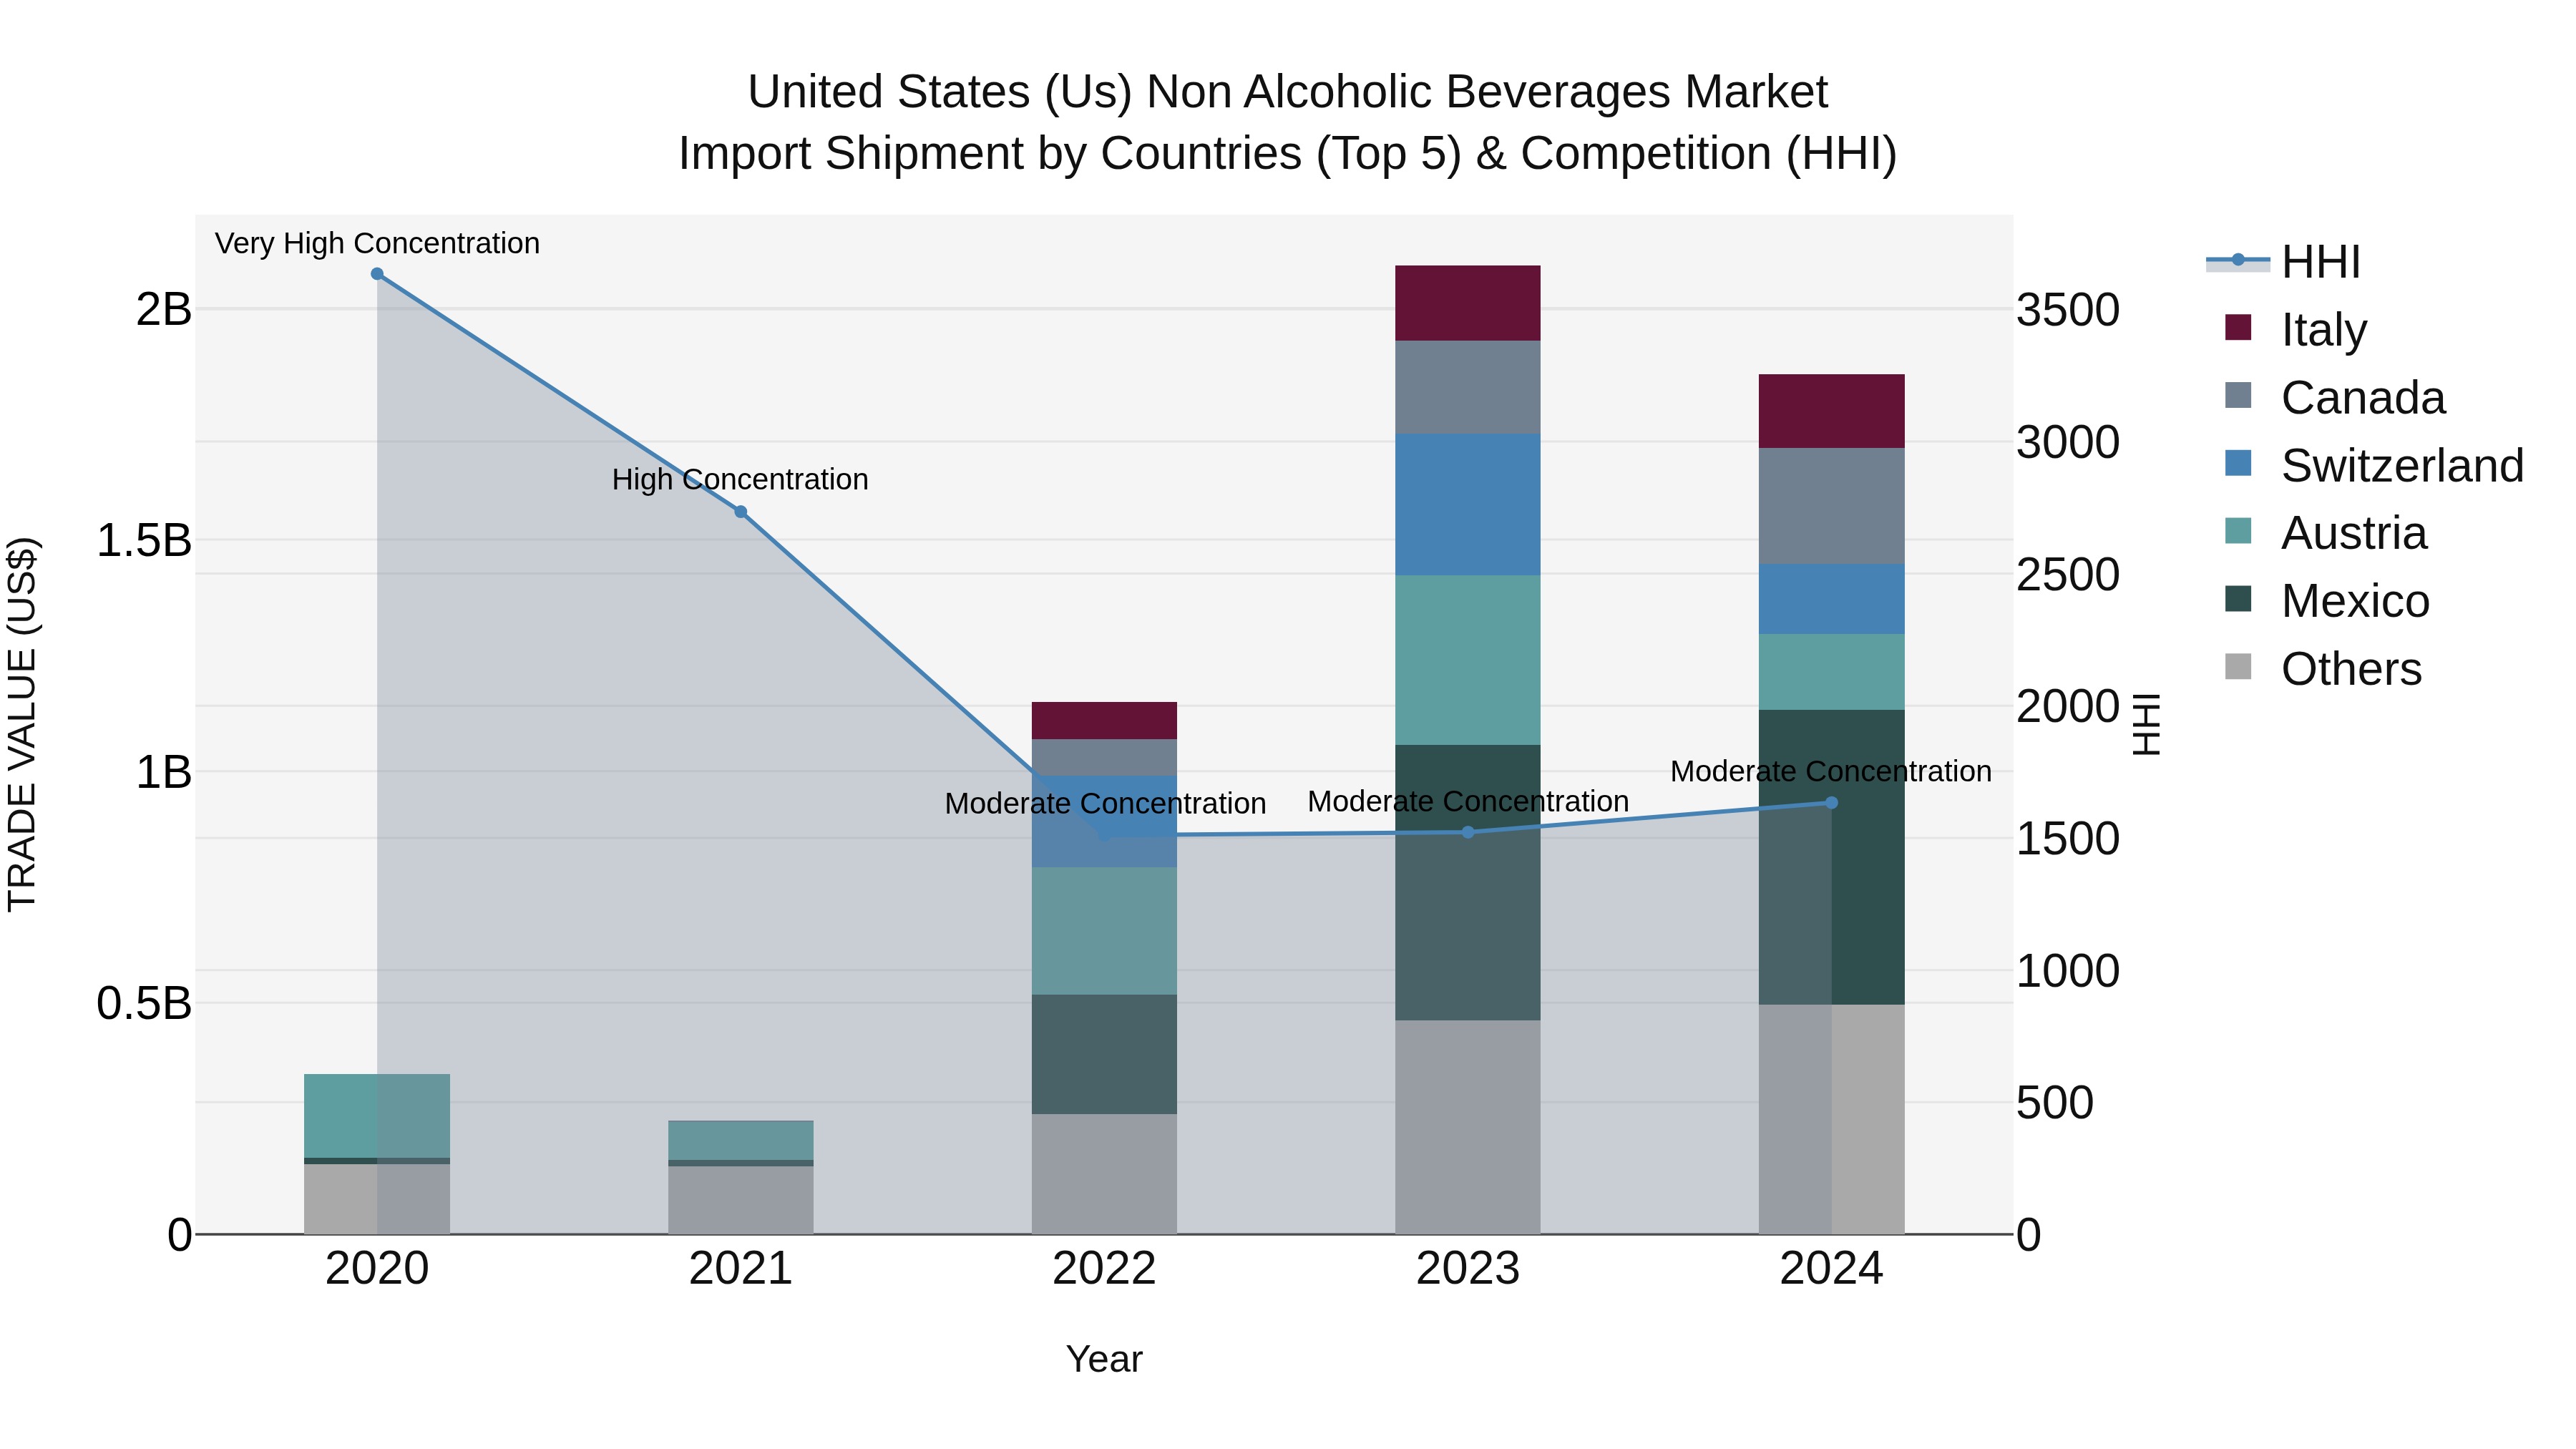
United States (US) Non Alcoholic Beverages Market Top 5 Importing Countries and Market Competition (HHI) Analysis
In 2024, the United States continued to see a steady flow of non-alcoholic beverage imports, with Mexico, Canada, Austria, Italy, and Switzerland leading the way. Despite moderate concentration levels, the industry experienced significant growth with a CAGR of 52.13% from 2020 to 2024. However, there was a slight decline in the growth rate from 2023 to 2024 at -11.18%, indicating a potential shift in market dynamics. The diverse range of countries exporting to the USA highlights the popularity and demand for non-alcoholic beverages in the American market.
United States (US) Non Alcoholic Beverages Market Overview
The United States Non-Alcoholic Beverages Market is a robust and diverse industry that includes a wide range of products such as carbonated soft drinks, bottled water, energy drinks, juices, and ready-to-drink teas and coffees. With health and wellness trends driving consumer preferences, there has been a shift towards healthier options like sparkling water, functional beverages, and plant-based drinks. Major players in the market include Coca-Cola, PepsiCo, Keurig Dr Pepper, and Nestlé among others, who continually innovate and introduce new products to meet changing consumer demands. The market is also witnessing a growing trend towards sustainability and eco-friendly packaging solutions. Overall, the US Non-Alcoholic Beverages Market is competitive, dynamic, and responsive to evolving consumer needs and preferences.
United States (US) Non Alcoholic Beverages Market Trends
The US non-alcoholic beverages market is experiencing several key trends. Health and wellness continue to drive demand, with consumers seeking beverages with natural ingredients, low sugar content, and functional benefits such as hydration or energy boost. Plant-based and sustainable options are gaining popularity as consumers become more conscious of environmental impact. Premiumization is also a growing trend, with an increasing demand for high-quality, artisanal beverages and unique flavors. The rise of e-commerce is changing the distribution landscape, allowing smaller brands to reach a wider audience. Additionally, there is a growing interest in innovative packaging solutions, such as eco-friendly materials and convenient formats like on-the-go single serves. Overall, the US non-alcoholic beverages market is evolving to meet the changing preferences and lifestyles of consumers.
United States (US) Non Alcoholic Beverages Market Challenges
In the US Non-Alcoholic Beverages Market, some key challenges include increasing competition from both established brands and emerging startups, shifting consumer preferences towards healthier and more natural products, stringent regulations regarding labeling and health claims, and the growing concern over environmental sustainability and packaging waste. Additionally, fluctuating raw material prices, distribution challenges, and the impact of global economic factors can also pose obstacles for companies operating in this market. Successfully navigating these challenges requires companies to innovate with new product offerings, invest in sustainable practices, adapt to changing consumer trends, and effectively differentiate themselves in a crowded marketplace.
United States (US) Non Alcoholic Beverages Market Investment Opportunities
Investment opportunities in the US Non-Alcoholic Beverages Market include the growing demand for healthier beverage options such as functional drinks, plant-based beverages, and low-sugar alternatives. Companies that focus on innovative product development, sustainable packaging, and strategic marketing to target health-conscious consumers are well-positioned for growth. Additionally, the rise of e-commerce platforms and direct-to-consumer sales channels provide opportunities for market expansion and increased brand visibility. Investing in companies that prioritize sustainability, adaptability to changing consumer preferences, and strong distribution networks can lead to success in the competitive non-alcoholic beverages market in the US.
United States (US) Non Alcoholic Beverages Market Government Policy
The US government imposes regulations on the non-alcoholic beverages market to ensure consumer safety and fair competition. The Food and Drug Administration (FDA) oversees labeling requirements, ingredient approvals, and food safety standards for beverages. The Department of Agriculture (USDA) regulates the production and marketing of certain beverages like fruit juices. Additionally, the Federal Trade Commission (FTC) monitors advertising practices to prevent deceptive marketing. Health initiatives like the Sugar-Sweetened Beverage Tax have been proposed at the state level to reduce consumption of sugary drinks. Overall, government policies in the US non-alcoholic beverages market aim to protect consumers, promote public health, and maintain a competitive marketplace.
United States (US) Non Alcoholic Beverages Market Future Outlook
The United States Non-Alcoholic Beverages Market is expected to witness steady growth in the coming years driven by increasing health consciousness among consumers, growing demand for innovative and functional beverages, and the rise of non-alcoholic alternatives to traditional alcoholic drinks. The market is set to benefit from the growing trend towards natural, organic, and low-sugar beverages, as well as the increasing popularity of plant-based and functional beverages. With a focus on sustainability and eco-friendly packaging gaining momentum, companies are likely to introduce more environmentally friendly products to cater to the changing preferences of consumers. The market is also expected to see further innovation in terms of flavors, ingredients, and packaging formats, as well as increased investments in marketing and distribution channels to reach a wider consumer base.
Key Highlights of the Report:
- United States (US) Non Alcoholic Beverages Market Outlook
- Market Size of United States (US) Non Alcoholic Beverages Market, 2021
- Forecast of United States (US) Non Alcoholic Beverages Market, 2031
- Historical Data and Forecast of United States (US) Non Alcoholic Beverages Revenues & Volume for the Period 2018 - 2031
- United States (US) Non Alcoholic Beverages Market Trend Evolution
- United States (US) Non Alcoholic Beverages Market Drivers and Challenges
- United States (US) Non Alcoholic Beverages Price Trends
- United States (US) Non Alcoholic Beverages Porter's Five Forces
- United States (US) Non Alcoholic Beverages Industry Life Cycle
- Historical Data and Forecast of United States (US) Non Alcoholic Beverages Market Revenues & Volume By Type for the Period 2018 - 2031
- Historical Data and Forecast of United States (US) Non Alcoholic Beverages Market Revenues & Volume By Alcoholic Beverages for the Period 2018 - 2031
- Historical Data and Forecast of United States (US) Non Alcoholic Beverages Market Revenues & Volume By Non-Alcoholic Beverages for the Period 2018 - 2031
- Historical Data and Forecast of United States (US) Non Alcoholic Beverages Market Revenues & Volume By Bottled Water for the Period 2018 - 2031
- Historical Data and Forecast of United States (US) Non Alcoholic Beverages Market Revenues & Volume By Carbonated Soft Drinks for the Period 2018 - 2031
- Historical Data and Forecast of United States (US) Non Alcoholic Beverages Market Revenues & Volume By Fruit Juice for the Period 2018 - 2031
- Historical Data and Forecast of United States (US) Non Alcoholic Beverages Market Revenues & Volume By Milk for the Period 2018 - 2031
- Historical Data and Forecast of United States (US) Non Alcoholic Beverages Market Revenues & Volume By Packaging Type for the Period 2018 - 2031
- Historical Data and Forecast of United States (US) Non Alcoholic Beverages Market Revenues & Volume By Cartons for the Period 2018 - 2031
- Historical Data and Forecast of United States (US) Non Alcoholic Beverages Market Revenues & Volume By Cans for the Period 2018 - 2031
- Historical Data and Forecast of United States (US) Non Alcoholic Beverages Market Revenues & Volume By Bottles for the Period 2018 - 2031
- Historical Data and Forecast of United States (US) Non Alcoholic Beverages Market Revenues & Volume By Others for the Period 2018 - 2031
- Historical Data and Forecast of United States (US) Non Alcoholic Beverages Market Revenues & Volume By Distribution Channel for the Period 2018 - 2031
- Historical Data and Forecast of United States (US) Non Alcoholic Beverages Market Revenues & Volume By Online for the Period 2018 - 2031
- Historical Data and Forecast of United States (US) Non Alcoholic Beverages Market Revenues & Volume By Offline for the Period 2018 - 2031
- Historical Data and Forecast of United States (US) Non Alcoholic Beverages Market Revenues & Volume By Supermarkets for the Period 2018 - 2031
- Historical Data and Forecast of United States (US) Non Alcoholic Beverages Market Revenues & Volume By Departmental Stores for the Period 2018 - 2031
- Historical Data and Forecast of United States (US) Non Alcoholic Beverages Market Revenues & Volume By Specialty Stores for the Period 2018 - 2031
- United States (US) Non Alcoholic Beverages Import Export Trade Statistics
- Market Opportunity Assessment By Type
- Market Opportunity Assessment By Packaging Type
- Market Opportunity Assessment By Distribution Channel
- United States (US) Non Alcoholic Beverages Top Companies Market Share
- United States (US) Non Alcoholic Beverages Competitive Benchmarking By Technical and Operational Parameters
- United States (US) Non Alcoholic Beverages Company Profiles
- United States (US) Non Alcoholic Beverages Key Strategic Recommendations
Frequently Asked Questions About the Market Study (FAQs):
6Wresearch actively monitors the United States (US) Non Alcoholic Beverages Market and publishes its comprehensive annual report, highlighting emerging trends, growth drivers, revenue analysis, and forecast outlook. Our insights help businesses to make data-backed strategic decisions with ongoing market dynamics. Our analysts track relevent industries related to the United States (US) Non Alcoholic Beverages Market, allowing our clients with actionable intelligence and reliable forecasts tailored to emerging regional needs.
Yes, we provide customisation as per your requirements. To learn more, feel free to contact us on sales@6wresearch.com
1 Executive Summary |
2 Introduction |
2.1 Key Highlights of the Report |
2.2 Report Description |
2.3 Market Scope & Segmentation |
2.4 Research Methodology |
2.5 Assumptions |
3 United States (US) Non Alcoholic Beverages Market Overview |
3.1 United States (US) Country Macro Economic Indicators |
3.2 United States (US) Non Alcoholic Beverages Market Revenues & Volume, 2021 & 2031F |
3.3 United States (US) Non Alcoholic Beverages Market - Industry Life Cycle |
3.4 United States (US) Non Alcoholic Beverages Market - Porter's Five Forces |
3.5 United States (US) Non Alcoholic Beverages Market Revenues & Volume Share, By Type, 2021 & 2031F |
3.6 United States (US) Non Alcoholic Beverages Market Revenues & Volume Share, By Packaging Type, 2021 & 2031F |
3.7 United States (US) Non Alcoholic Beverages Market Revenues & Volume Share, By Distribution Channel, 2021 & 2031F |
4 United States (US) Non Alcoholic Beverages Market Dynamics |
4.1 Impact Analysis |
4.2 Market Drivers |
4.2.1 Increasing health consciousness and awareness about the harmful effects of sugary drinks |
4.2.2 Growing demand for functional and wellness beverages |
4.2.3 Rising disposable income leading to higher spending on premium non-alcoholic beverages |
4.3 Market Restraints |
4.3.1 Stringent government regulations on ingredients and labeling requirements |
4.3.2 Competition from substitute products like ready-to-drink coffee and energy drinks |
5 United States (US) Non Alcoholic Beverages Market Trends |
6 United States (US) Non Alcoholic Beverages Market, By Types |
6.1 United States (US) Non Alcoholic Beverages Market, By Type |
6.1.1 Overview and Analysis |
6.1.2 United States (US) Non Alcoholic Beverages Market Revenues & Volume, By Type, 2021-2031F |
6.1.3 United States (US) Non Alcoholic Beverages Market Revenues & Volume, By Alcoholic Beverages, 2021-2031F |
6.1.4 United States (US) Non Alcoholic Beverages Market Revenues & Volume, By Non-Alcoholic Beverages, 2021-2031F |
6.1.5 United States (US) Non Alcoholic Beverages Market Revenues & Volume, By Bottled Water, 2021-2031F |
6.1.6 United States (US) Non Alcoholic Beverages Market Revenues & Volume, By Carbonated Soft Drinks, 2021-2031F |
6.1.7 United States (US) Non Alcoholic Beverages Market Revenues & Volume, By Fruit Juice, 2021-2031F |
6.1.8 United States (US) Non Alcoholic Beverages Market Revenues & Volume, By Milk, 2021-2031F |
6.2 United States (US) Non Alcoholic Beverages Market, By Packaging Type |
6.2.1 Overview and Analysis |
6.2.2 United States (US) Non Alcoholic Beverages Market Revenues & Volume, By Cartons, 2021-2031F |
6.2.3 United States (US) Non Alcoholic Beverages Market Revenues & Volume, By Cans, 2021-2031F |
6.2.4 United States (US) Non Alcoholic Beverages Market Revenues & Volume, By Bottles, 2021-2031F |
6.2.5 United States (US) Non Alcoholic Beverages Market Revenues & Volume, By Others, 2021-2031F |
6.3 United States (US) Non Alcoholic Beverages Market, By Distribution Channel |
6.3.1 Overview and Analysis |
6.3.2 United States (US) Non Alcoholic Beverages Market Revenues & Volume, By Online, 2021-2031F |
6.3.3 United States (US) Non Alcoholic Beverages Market Revenues & Volume, By Offline, 2021-2031F |
6.3.4 United States (US) Non Alcoholic Beverages Market Revenues & Volume, By Supermarkets, 2021-2031F |
6.3.5 United States (US) Non Alcoholic Beverages Market Revenues & Volume, By Departmental Stores, 2021-2031F |
6.3.6 United States (US) Non Alcoholic Beverages Market Revenues & Volume, By Specialty Stores, 2021-2031F |
7 United States (US) Non Alcoholic Beverages Market Import-Export Trade Statistics |
7.1 United States (US) Non Alcoholic Beverages Market Export to Major Countries |
7.2 United States (US) Non Alcoholic Beverages Market Imports from Major Countries |
8 United States (US) Non Alcoholic Beverages Market Key Performance Indicators |
8.1 Consumer engagement on social media platforms for non-alcoholic beverages brands |
8.2 Number of new product launches in the non-alcoholic beverages segment |
8.3 Growth in online sales and e-commerce penetration for non-alcoholic beverages |
8.4 Adoption rate of sustainable packaging solutions in the non-alcoholic beverages industry |
8.5 Percentage increase in consumption of sugar-free or low-calorie non-alcoholic beverages |
9 United States (US) Non Alcoholic Beverages Market - Opportunity Assessment |
9.1 United States (US) Non Alcoholic Beverages Market Opportunity Assessment, By Type, 2021 & 2031F |
9.2 United States (US) Non Alcoholic Beverages Market Opportunity Assessment, By Packaging Type, 2021 & 2031F |
9.3 United States (US) Non Alcoholic Beverages Market Opportunity Assessment, By Distribution Channel, 2021 & 2031F |
10 United States (US) Non Alcoholic Beverages Market - Competitive Landscape |
10.1 United States (US) Non Alcoholic Beverages Market Revenue Share, By Companies, 2021 |
10.2 United States (US) Non Alcoholic Beverages Market Competitive Benchmarking, By Operating and Technical Parameters |
11 Company Profiles |
12 Recommendations |
13 Disclaimer |
Global Go To Market Strategy - 2030
Export potential enables firms to identify high-growth global markets with greater confidence by combining advanced trade intelligence with a structured quantitative methodology. The framework analyzes emerging demand trends and country-level import patterns while integrating macroeconomic and trade datasets such as GDP and population forecasts, bilateral import–export flows, tariff structures, elasticity differentials between developed and developing economies, geographic distance, and import demand projections. Using weighted trade values from 2020–2024 as the base period to project country-to-country export potential for 2030, these inputs are operationalized through calculated drivers such as gravity model parameters, tariff impact factors, and projected GDP per-capita growth. Through an analysis of hidden potentials, demand hotspots, and market conditions that are most favorable to success, this method enables firms to focus on target countries, maximize returns, and global expansion with data, backed by accuracy.
By factoring in the projected importer demand gap that is currently unmet and could be potential opportunity, it identifies the potential for the Exporter (Country) among 190 countries, against the general trade analysis, which identifies the biggest importer or exporter.
To discover high-growth global markets and optimize your business strategy:
Click Here
Pricing
- Single User License$ 1,995
- Department License$ 2,400
- Site License$ 3,120
- Global License$ 3,795

Leadership Perspectives from Industry Events
Search
Thought Leadership and Analyst Meet


Our Clients
6WResearch In News
- India Air Conditioner Market Set for Strong Rebound in 2026 After Weather-Led Correction and GST-Driven Recovery: 6Wresearch
- ADAS in India: How Automatic Emergency Braking, Blind Spot Detection & Driver Monitoring are Transforming Road Safety
- Doha a strategic location for EV manufacturing hub: IPA Qatar
- Demand for luxury TVs surging in the GCC, says Samsung
- Empowering Growth: The Thriving Journey of Bangladesh’s Cable Industry
- Demand for luxury TVs surging in the GCC, says Samsung
Latest Reports
- Nicaragua RPG Gaming Market (2026-2032)
- New Zealand RPG Gaming Market (2026-2032)
- Netherlands RPG Gaming Market (2026-2032)
- Nauru RPG Gaming Market (2026-2032)
- Namibia RPG Gaming Market (2026-2032)
- Mozambique RPG Gaming Market (2026-2032)
- Montenegro RPG Gaming Market (2026-2032)
- Mongolia RPG Gaming Market (2026-2032)
- Monaco RPG Gaming Market (2026-2032)
- Micronesia RPG Gaming Market (2026-2032)
Industry Events and Analyst Meet

EV India Expo 2026

HIMTEX 2026

India Refining Summit 2026

India EV Show 2026

EV tech India Expo 2026
Whitepaper
- Middle East & Africa Commercial Security Market Click here to view more.
- Middle East & Africa Fire Safety Systems & Equipment Market Click here to view more.
- GCC Drone Market Click here to view more.
- Middle East Lighting Fixture Market Click here to view more.
- GCC Physical & Perimeter Security Market Click here to view more.