United States (US) Oxygenated Solvents Market (2025-2031) Outlook | Companies, Trends, Size, Revenue, Industry, Forecast, Value, Analysis, Share & Growth
Market Forecast By Source (Conventional , Bio & Green), By Type (Alcohols, Esters, Glycols, Glycol Ethers, Ketones), By Application (Paints & Coatings, Pharmaceuticals, Cleaners, Crop Protection) And Competitive Landscape
| Product Code: ETC4489262 | Publication Date: Jul 2023 | Updated Date: Nov 2025 | Product Type: Report | |
| Publisher: 6Wresearch | Author: Vasudha | No. of Pages: 85 | No. of Figures: 45 | No. of Tables: 25 |
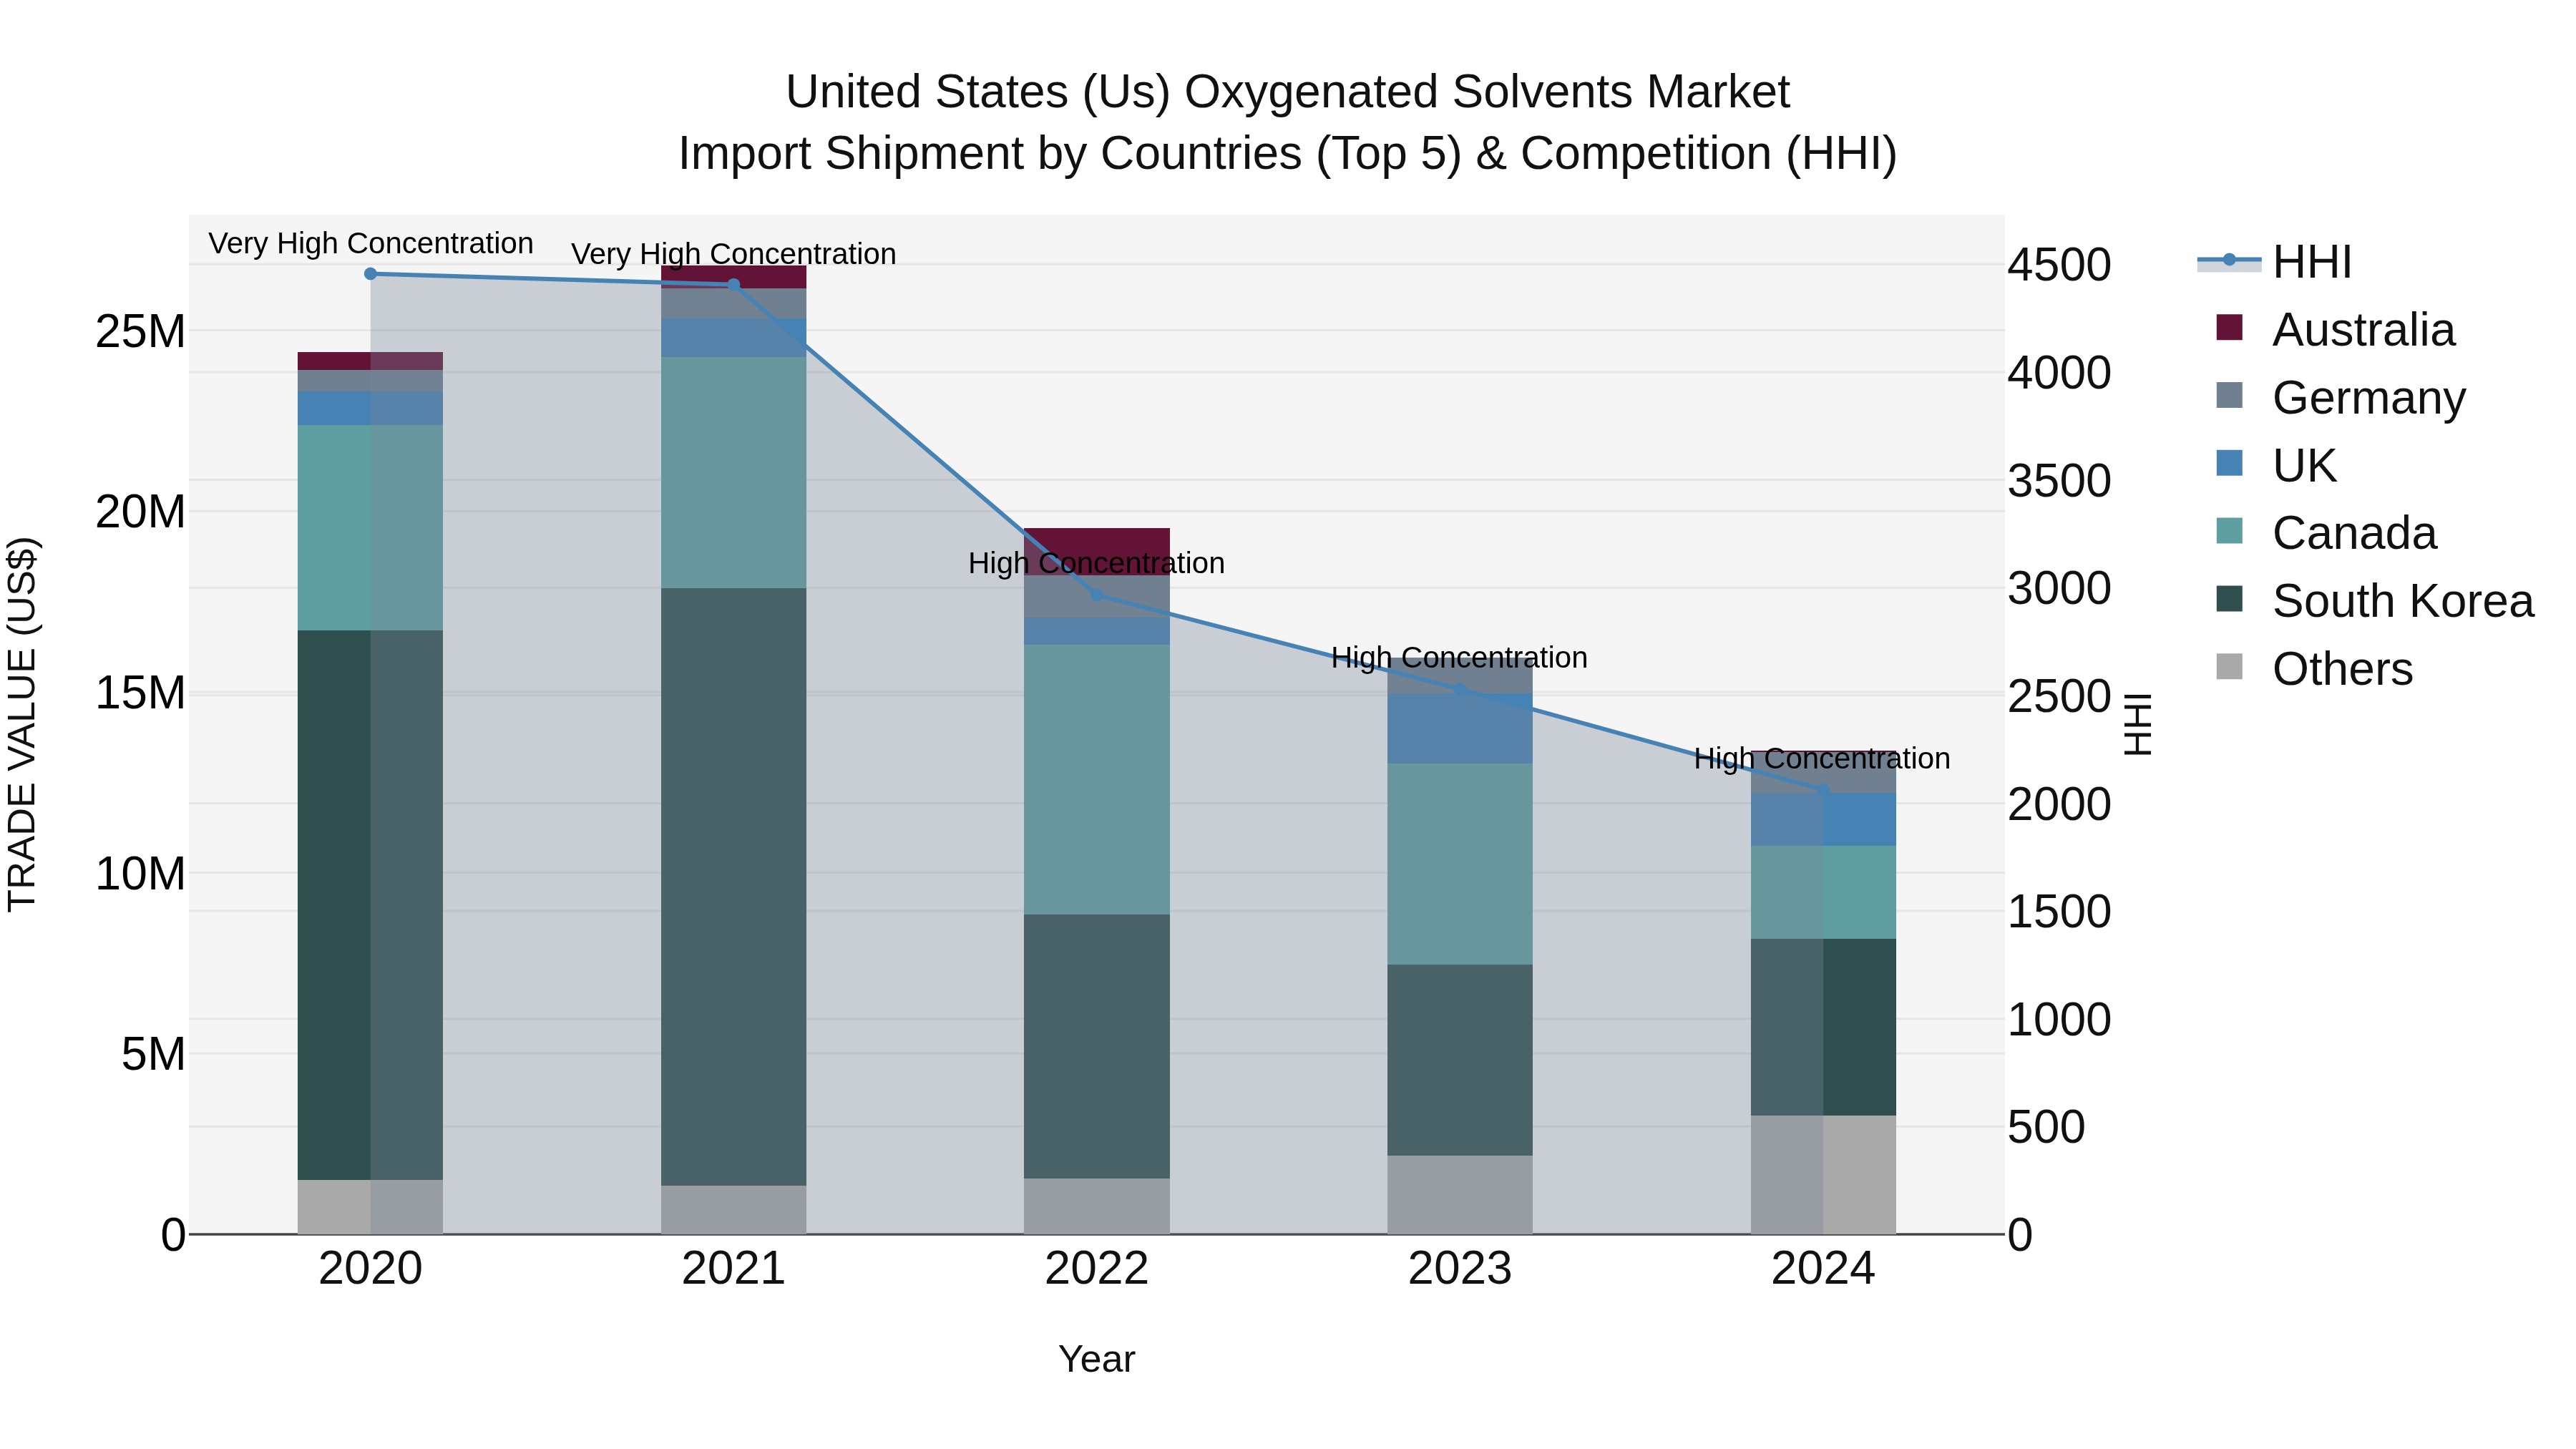
United States (US) Oxygenated Solvents Market Top 5 Importing Countries and Market Competition (HHI) Analysis
The United States continued to rely on imports of oxygenated solvents in 2024, with top exporting countries being South Korea, Canada, Mexico, UK, and Germany. Despite a high concentration level indicated by the Herfindahl-Hirschman Index (HHI), the industry experienced a significant decline in both the compound annual growth rate (CAGR) from 2020 to 2024 at -13.95% and the growth rate specifically in 2024 at -16.17%. This suggests a challenging landscape for US importers of oxygenated solvents, potentially influenced by various market dynamics and factors impacting global trade.
United States (US) Oxygenated Solvents Market Overview
The United States Oxygenated Solvents Market is a mature and well-established industry that encompasses a wide range of solvent products used in various applications such as paints and coatings, pharmaceuticals, adhesives, and cleaning solutions. The market is driven by factors such as the growing demand for eco-friendly and low-VOC solvents, stringent environmental regulations, and increasing industrial activities. Key players in the market include Eastman Chemical Company, Dow Chemical Company, and BASF SE, who are continuously investing in research and development to introduce innovative products and cater to the evolving needs of end-users. The market is expected to witness steady growth in the coming years, with a focus on sustainability, performance, and cost-effectiveness driving product developments and market expansion strategies.
United States (US) Oxygenated Solvents Market Trends and Opportunities
The United States Oxygenated Solvents Market is currently experiencing growth due to increasing demand from various industries such as paints and coatings, pharmaceuticals, and personal care products. Growing awareness about the environmental benefits of using oxygenated solvents, which are considered safer and more sustainable compared to conventional solvents, is also driving market growth. Additionally, the shift towards using bio-based oxygenated solvents is creating opportunities for manufacturers to innovate and develop eco-friendly products. With stringent regulations on VOC emissions and increasing focus on sustainability, the market is expected to continue expanding. Key players in the market are investing in research and development to introduce new products with advanced properties, catering to the evolving needs of various end-user industries.
United States (US) Oxygenated Solvents Market Challenges
The US Oxygenated Solvents Market faces several challenges, including regulatory pressure to reduce emissions and shift towards more sustainable and environmentally friendly solvents. The market is also impacted by fluctuating raw material prices, which can affect production costs and ultimately pricing strategies. Additionally, competition from alternative solvents, such as bio-based or water-based solutions, presents a challenge in terms of market share and differentiation. Moreover, the market`s growth is influenced by the overall economic conditions and demand from end-user industries, such as paints and coatings, pharmaceuticals, and cosmetics. Adapting to these challenges by investing in research and development for innovative products, enhancing sustainability practices, and establishing strong partnerships with suppliers and customers will be essential for companies operating in the US Oxygenated Solvents Market to remain competitive and sustainable in the long term.
United States (US) Oxygenated Solvents Market Drivers
The United States Oxygenated Solvents Market is primarily driven by increasing demand from end-use industries such as paints and coatings, pharmaceuticals, and personal care products. The growth in construction activities and infrastructure development in the country also contribute to the market expansion, as oxygenated solvents are widely used in the production of paints, adhesives, and cleaning products. Additionally, stringent environmental regulations promoting the use of eco-friendly solvents further propel the market growth, as oxygenated solvents are considered less harmful compared to traditional solvents. The ongoing trend of technological advancements and innovation in solvent formulations to improve performance characteristics and reduce environmental impact also plays a key role in driving the market forward.
United States (US) Oxygenated Solvents Market Government Policy
In the United States, the Oxygenated Solvents Market is subject to various government policies and regulations aimed at ensuring environmental and health safety. The Environmental Protection Agency (EPA) regulates the use of oxygenated solvents through programs like the Clean Air Act, which sets emission standards for volatile organic compounds (VOCs) that can be emitted from solvents. Additionally, the Occupational Safety and Health Administration (OSHA) mandates workplace safety standards for handling these solvents to protect workers from exposure risks. The Toxic Substances Control Act (TSCA) also governs the manufacturing, processing, distribution, use, and disposal of chemicals like oxygenated solvents to safeguard human health and the environment. Compliance with these regulations is crucial for businesses operating in the US Oxygenated Solvents Market to ensure sustainable and responsible practices.
United States (US) Oxygenated Solvents Market Future Outlook
The future outlook for the United States Oxygenated Solvents Market appears promising, with sustained growth expected due to increasing demand across various industries such as paints and coatings, pharmaceuticals, and personal care products. Factors driving this growth include the rising emphasis on eco-friendly and sustainable solvents, as well as the ongoing research and development efforts to enhance the performance of oxygenated solvents. Additionally, the implementation of stringent environmental regulations is likely to propel the market further as companies seek alternatives to traditional solvents. With a growing focus on reducing carbon footprint and promoting green chemistry practices, the US Oxygenated Solvents Market is anticipated to witness steady expansion in the coming years, presenting opportunities for innovation and market development.
Key Highlights of the Report:
- United States (US) Oxygenated Solvents Market Outlook
- Market Size of United States (US) Oxygenated Solvents Market, 2024
- Forecast of United States (US) Oxygenated Solvents Market, 2031
- Historical Data and Forecast of United States (US) Oxygenated Solvents Revenues & Volume for the Period 2021 - 2031
- United States (US) Oxygenated Solvents Market Trend Evolution
- United States (US) Oxygenated Solvents Market Drivers and Challenges
- United States (US) Oxygenated Solvents Price Trends
- United States (US) Oxygenated Solvents Porter's Five Forces
- United States (US) Oxygenated Solvents Industry Life Cycle
- Historical Data and Forecast of United States (US) Oxygenated Solvents Market Revenues & Volume By Source for the Period 2021 - 2031
- Historical Data and Forecast of United States (US) Oxygenated Solvents Market Revenues & Volume By Conventional for the Period 2021 - 2031
- Historical Data and Forecast of United States (US) Oxygenated Solvents Market Revenues & Volume By Bio & Green for the Period 2021 - 2031
- Historical Data and Forecast of United States (US) Oxygenated Solvents Market Revenues & Volume By Type for the Period 2021 - 2031
- Historical Data and Forecast of United States (US) Oxygenated Solvents Market Revenues & Volume By Alcohols for the Period 2021 - 2031
- Historical Data and Forecast of United States (US) Oxygenated Solvents Market Revenues & Volume By Esters for the Period 2021 - 2031
- Historical Data and Forecast of United States (US) Oxygenated Solvents Market Revenues & Volume By Glycols for the Period 2021 - 2031
- Historical Data and Forecast of United States (US) Oxygenated Solvents Market Revenues & Volume By Glycol Ethers for the Period 2021 - 2031
- Historical Data and Forecast of United States (US) Oxygenated Solvents Market Revenues & Volume By Ketones for the Period 2021 - 2031
- Historical Data and Forecast of United States (US) Oxygenated Solvents Market Revenues & Volume By Application for the Period 2021 - 2031
- Historical Data and Forecast of United States (US) Oxygenated Solvents Market Revenues & Volume By Paints & Coatings for the Period 2021 - 2031
- Historical Data and Forecast of United States (US) Oxygenated Solvents Market Revenues & Volume By Pharmaceuticals for the Period 2021 - 2031
- Historical Data and Forecast of United States (US) Oxygenated Solvents Market Revenues & Volume By Cleaners for the Period 2021 - 2031
- Historical Data and Forecast of United States (US) Oxygenated Solvents Market Revenues & Volume By Crop Protection for the Period 2021 - 2031
- United States (US) Oxygenated Solvents Import Export Trade Statistics
- Market Opportunity Assessment By Source
- Market Opportunity Assessment By Type
- Market Opportunity Assessment By Application
- United States (US) Oxygenated Solvents Top Companies Market Share
- United States (US) Oxygenated Solvents Competitive Benchmarking By Technical and Operational Parameters
- United States (US) Oxygenated Solvents Company Profiles
- United States (US) Oxygenated Solvents Key Strategic Recommendations
Frequently Asked Questions About the Market Study (FAQs):
6Wresearch actively monitors the United States (US) Oxygenated Solvents Market and publishes its comprehensive annual report, highlighting emerging trends, growth drivers, revenue analysis, and forecast outlook. Our insights help businesses to make data-backed strategic decisions with ongoing market dynamics. Our analysts track relevent industries related to the United States (US) Oxygenated Solvents Market, allowing our clients with actionable intelligence and reliable forecasts tailored to emerging regional needs.
Yes, we provide customisation as per your requirements. To learn more, feel free to contact us on sales@6wresearch.com
1 Executive Summary |
2 Introduction |
2.1 Key Highlights of the Report |
2.2 Report Description |
2.3 Market Scope & Segmentation |
2.4 Research Methodology |
2.5 Assumptions |
3 United States (US) Oxygenated Solvents Market Overview |
3.1 United States (US) Country Macro Economic Indicators |
3.2 United States (US) Oxygenated Solvents Market Revenues & Volume, 2021 & 2031F |
3.3 United States (US) Oxygenated Solvents Market - Industry Life Cycle |
3.4 United States (US) Oxygenated Solvents Market - Porter's Five Forces |
3.5 United States (US) Oxygenated Solvents Market Revenues & Volume Share, By Source, 2021 & 2031F |
3.6 United States (US) Oxygenated Solvents Market Revenues & Volume Share, By Type, 2021 & 2031F |
3.7 United States (US) Oxygenated Solvents Market Revenues & Volume Share, By Application, 2021 & 2031F |
4 United States (US) Oxygenated Solvents Market Dynamics |
4.1 Impact Analysis |
4.2 Market Drivers |
4.2.1 Increasing demand for environmentally friendly solvents |
4.2.2 Growth in end-use industries such as paints and coatings, pharmaceuticals, and electronics |
4.2.3 Rising adoption of oxygenated solvents in cleaning applications |
4.3 Market Restraints |
4.3.1 Fluctuating raw material prices |
4.3.2 Stringent regulations regarding VOC emissions |
4.3.3 Competition from alternative solvents such as bio-based solvents |
5 United States (US) Oxygenated Solvents Market Trends |
6 United States (US) Oxygenated Solvents Market, By Types |
6.1 United States (US) Oxygenated Solvents Market, By Source |
6.1.1 Overview and Analysis |
6.1.2 United States (US) Oxygenated Solvents Market Revenues & Volume, By Source, 2021 - 2031F |
6.1.3 United States (US) Oxygenated Solvents Market Revenues & Volume, By Conventional , 2021 - 2031F |
6.1.4 United States (US) Oxygenated Solvents Market Revenues & Volume, By Bio & Green, 2021 - 2031F |
6.2 United States (US) Oxygenated Solvents Market, By Type |
6.2.1 Overview and Analysis |
6.2.2 United States (US) Oxygenated Solvents Market Revenues & Volume, By Alcohols, 2021 - 2031F |
6.2.3 United States (US) Oxygenated Solvents Market Revenues & Volume, By Esters, 2021 - 2031F |
6.2.4 United States (US) Oxygenated Solvents Market Revenues & Volume, By Glycols, 2021 - 2031F |
6.2.5 United States (US) Oxygenated Solvents Market Revenues & Volume, By Glycol Ethers, 2021 - 2031F |
6.2.6 United States (US) Oxygenated Solvents Market Revenues & Volume, By Ketones, 2021 - 2031F |
6.3 United States (US) Oxygenated Solvents Market, By Application |
6.3.1 Overview and Analysis |
6.3.2 United States (US) Oxygenated Solvents Market Revenues & Volume, By Paints & Coatings, 2021 - 2031F |
6.3.3 United States (US) Oxygenated Solvents Market Revenues & Volume, By Pharmaceuticals, 2021 - 2031F |
6.3.4 United States (US) Oxygenated Solvents Market Revenues & Volume, By Cleaners, 2021 - 2031F |
6.3.5 United States (US) Oxygenated Solvents Market Revenues & Volume, By Crop Protection, 2021 - 2031F |
7 United States (US) Oxygenated Solvents Market Import-Export Trade Statistics |
7.1 United States (US) Oxygenated Solvents Market Export to Major Countries |
7.2 United States (US) Oxygenated Solvents Market Imports from Major Countries |
8 United States (US) Oxygenated Solvents Market Key Performance Indicators |
8.1 Adoption rate of oxygenated solvents in key industries |
8.2 Research and development investment in new solvent technologies |
8.3 Environmental impact assessments and certifications for oxygenated solvents |
9 United States (US) Oxygenated Solvents Market - Opportunity Assessment |
9.1 United States (US) Oxygenated Solvents Market Opportunity Assessment, By Source, 2021 & 2031F |
9.2 United States (US) Oxygenated Solvents Market Opportunity Assessment, By Type, 2021 & 2031F |
9.3 United States (US) Oxygenated Solvents Market Opportunity Assessment, By Application, 2021 & 2031F |
10 United States (US) Oxygenated Solvents Market - Competitive Landscape |
10.1 United States (US) Oxygenated Solvents Market Revenue Share, By Companies, 2024 |
10.2 United States (US) Oxygenated Solvents Market Competitive Benchmarking, By Operating and Technical Parameters |
11 Company Profiles |
12 Recommendations |
13 Disclaimer |
Global Go To Market Strategy - 2030
Export potential enables firms to identify high-growth global markets with greater confidence by combining advanced trade intelligence with a structured quantitative methodology. The framework analyzes emerging demand trends and country-level import patterns while integrating macroeconomic and trade datasets such as GDP and population forecasts, bilateral import–export flows, tariff structures, elasticity differentials between developed and developing economies, geographic distance, and import demand projections. Using weighted trade values from 2020–2024 as the base period to project country-to-country export potential for 2030, these inputs are operationalized through calculated drivers such as gravity model parameters, tariff impact factors, and projected GDP per-capita growth. Through an analysis of hidden potentials, demand hotspots, and market conditions that are most favorable to success, this method enables firms to focus on target countries, maximize returns, and global expansion with data, backed by accuracy.
By factoring in the projected importer demand gap that is currently unmet and could be potential opportunity, it identifies the potential for the Exporter (Country) among 190 countries, against the general trade analysis, which identifies the biggest importer or exporter.
To discover high-growth global markets and optimize your business strategy:
Click Here
Pricing
- Single User License$ 1,995
- Department License$ 2,400
- Site License$ 3,120
- Global License$ 3,795

Leadership Perspectives from Industry Events
Search
Thought Leadership and Analyst Meet


Our Clients
6WResearch In News
- India Air Conditioner Market Set for Strong Rebound in 2026 After Weather-Led Correction and GST-Driven Recovery: 6Wresearch
- ADAS in India: How Automatic Emergency Braking, Blind Spot Detection & Driver Monitoring are Transforming Road Safety
- Doha a strategic location for EV manufacturing hub: IPA Qatar
- Demand for luxury TVs surging in the GCC, says Samsung
- Empowering Growth: The Thriving Journey of Bangladesh’s Cable Industry
- Demand for luxury TVs surging in the GCC, says Samsung
Latest Reports
- Poland Fire Protection Systems Market (2026-2032)
- Cape Verde Portable Hand-Thrown Extinguisher Market (2026-2032)
- Canada Portable Hand-Thrown Extinguisher Market (2026-2032)
- Cameroon Portable Hand-Thrown Extinguisher Market (2026-2032)
- Burundi Portable Hand-Thrown Extinguisher Market (2026-2032)
- Burkina Faso Portable Hand-Thrown Extinguisher Market (2026-2032)
- Bulgaria Portable Hand-Thrown Extinguisher Market (2026-2032)
- Brunei Portable Hand-Thrown Extinguisher Market (2026-2032)
- Botswana Portable Hand-Thrown Extinguisher Market (2026-2032)
- Bosnia and Herzegovina Portable Hand-Thrown Extinguisher Market (2026-2032)
Industry Events and Analyst Meet

HIMTEX 2026

India Refining Summit 2026

India EV Show 2026

EV tech India Expo 2026

Auto Tech Asia 2026
Whitepaper
- Middle East & Africa Commercial Security Market Click here to view more.
- Middle East & Africa Fire Safety Systems & Equipment Market Click here to view more.
- GCC Drone Market Click here to view more.
- Middle East Lighting Fixture Market Click here to view more.
- GCC Physical & Perimeter Security Market Click here to view more.