United States (US) Paints Market (2020-2026) | Growth, Industry, Forecast, Trends, Size, Value, Share, Revenue, Companies, Outlook, Analysis & COVID-19 IMPACT
Market Forecast By Resin (Acrylic, Alkyd, Epoxy, Polyurethane, Polyester), By Technology (Waterborne, Solventborne, Powder), By Application (Architectural, Industrial) And Competitive Landscape
| Product Code: ETC017541 | Publication Date: Jun 2023 | Updated Date: Nov 2025 | Product Type: Report | |
| Publisher: 6Wresearch | Author: Ravi Bhandari | No. of Pages: 70 | No. of Figures: 35 | No. of Tables: 5 |
United States Paints Market Year-wise Growth Rate (2021-2031F)
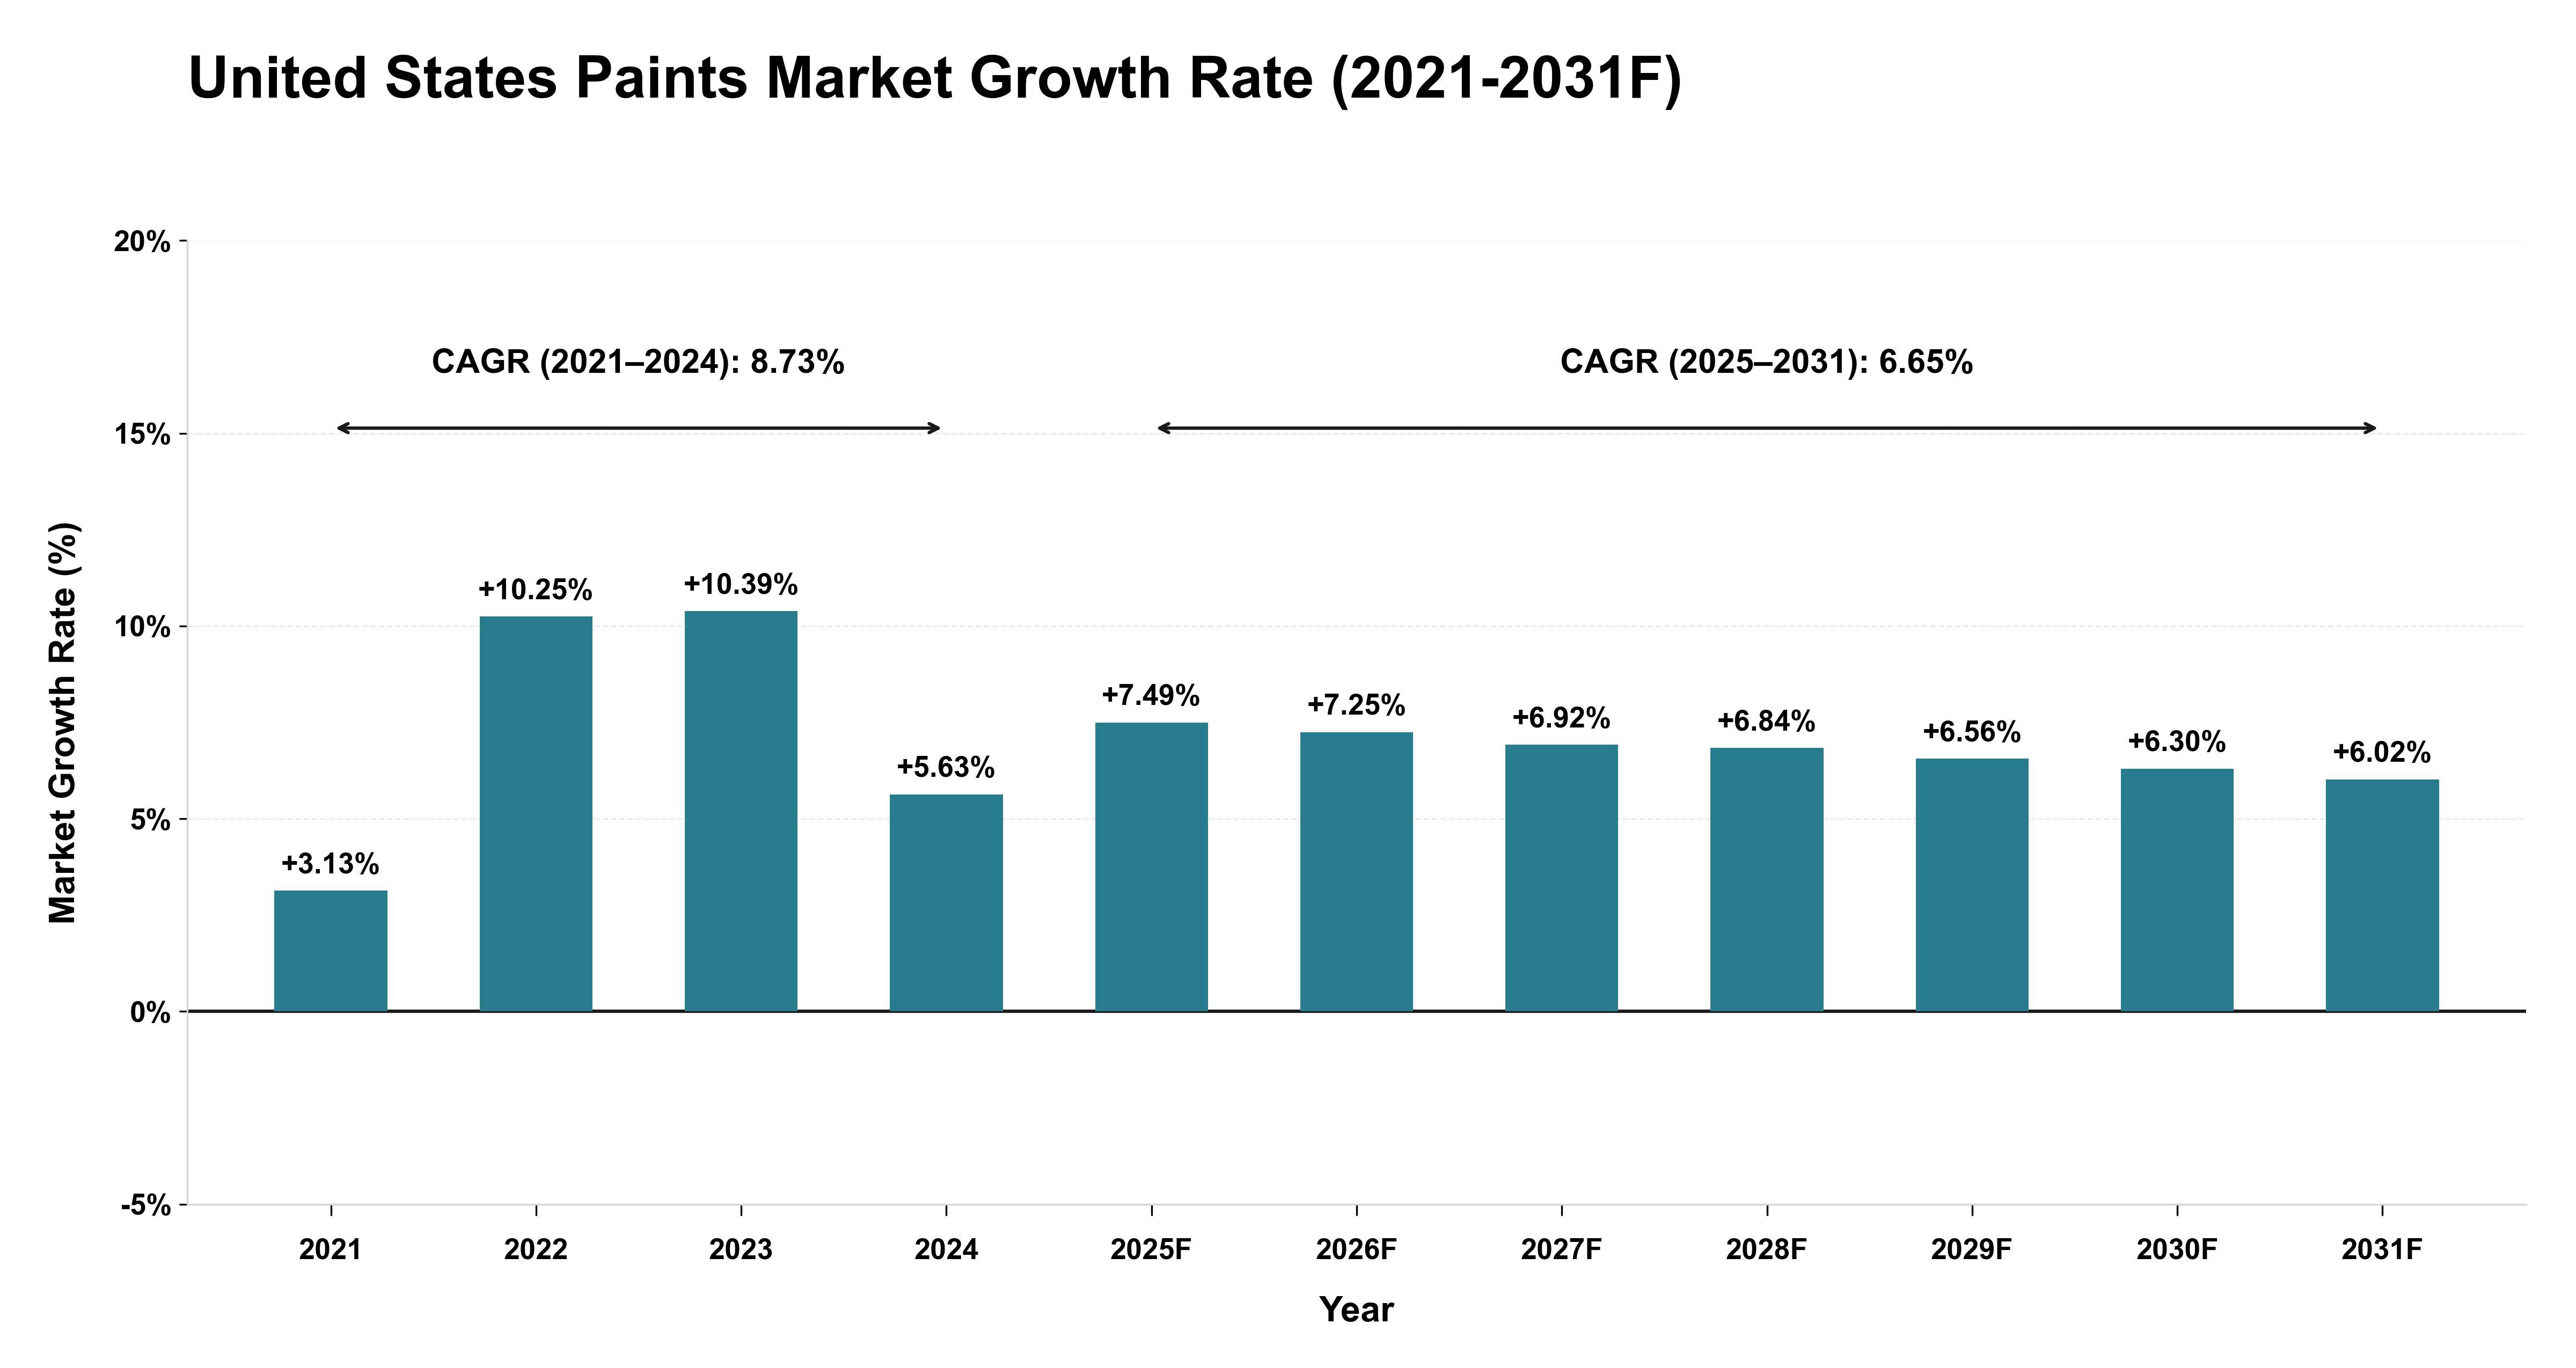
The United States Paints Market demonstrated robust growth during 2021-2024, with an annual CAGR of 8.73%. This period saw significant accelerations in 2022 and 2023, driven by increased demand from the construction and renovation sectors, coupled with technological advancements in eco-friendly paint formulations. The slight deceleration in growth in 2024 can be attributed to supply chain disruptions impacting raw material availability. Looking ahead to 2025-2031, the market is expected to maintain steady growth, albeit at a slightly lower pace with a forecasted CAGR of 6.65%. This phase will be characterized by more stable demand patterns as the construction industry reaches a more mature stage and regulatory factors push for sustainable paint solutions, influencing consumption patterns towards greener alternatives.
United States (Us) Paints Market Synopsis
The United States (US) Paints Market is expected to grow at a compound annual growth rate (CAGR) of 3.6% during the forecast period from 2020-2026. The market was valued at USD xx million in 2019 and is projected to reach USD xx million by 2026. Increasing consumer preference for eco-friendly paints coupled with growing demand for low VOC paints are some of the key factors driving the growth of this market. Growing construction activities across all sectors such as residential, commercial and industrial further fuel its demand over the forecast period. Additionally, increasing prevalence of do-it-yourself projects among end users have augmented its usage in home d?cor activities like wall painting which has resulted in an upsurge in sales volumes among various types of decorative paints used within households and other retail outlets catering these products. Moreover, recent developments employed by major players such as introductiona nd launch new colors collections along with improved performance qualities such as better adhesion properties have made these products more attractive amongst consumers thus resulting into increased paint sales
Furthermore ,technological advancements including development of water based acrylic emulsion technology has led to production high performing paints that utilise lower amount o volatile organic compounds (VOCs) which result into reductionof environmental pollution generated due to their use . This factor combined with government regulations towards reduced VOC emission standards imposed on paint manufacturers have further boosted product adoption . However ,high cost associated with premium quality sustainable paints may hamper industry expansion over short term.
Key Highlights of the Report:
- United States (US) Paints Market Outlook
- Market Size of United States (US) Paints Market, 2019
- Forecast of United States (US) Paints Market, 2026
- Historical Data and Forecast of United States (US) Paints Revenues & Volume for the Period 2016 - 2026
- United States (US) Paints Market Trend Evolution
- United States (US) Paints Market Drivers and Challenges
- United States (US) Paints Price Trends
- United States (US) Paints Porter's Five Forces
- United States (US) Paints Industry Life Cycle
- Historical Data and Forecast of United States (US) Paints Market Revenues & Volume By Resin for the Period 2016 - 2026
- Historical Data and Forecast of United States (US) Paints Market Revenues & Volume By Acrylic for the Period 2016 - 2026
- Historical Data and Forecast of United States (US) Paints Market Revenues & Volume By Alkyd for the Period 2016 - 2026
- Historical Data and Forecast of United States (US) Paints Market Revenues & Volume By Epoxy for the Period 2016 - 2026
- Historical Data and Forecast of United States (US) Paints Market Revenues & Volume By Polyurethane for the Period 2016 - 2026
- Historical Data and Forecast of United States (US) Paints Market Revenues & Volume By Polyester for the Period 2016 - 2026
- Historical Data and Forecast of United States (US) Paints Market Revenues & Volume By Technology for the Period 2016 - 2026
- Historical Data and Forecast of United States (US) Paints Market Revenues & Volume By Waterborne for the Period 2016 - 2026
- Historical Data and Forecast of United States (US) Paints Market Revenues & Volume By Solventborne for the Period 2016 - 2026
- Historical Data and Forecast of United States (US) Paints Market Revenues & Volume By Powder for the Period 2016 - 2026
- Historical Data and Forecast of United States (US) Paints Market Revenues & Volume By Application for the Period 2016 - 2026
- Historical Data and Forecast of United States (US) Paints Market Revenues & Volume By Architectural for the Period 2016 - 2026
- Historical Data and Forecast of United States (US) Paints Market Revenues & Volume By Industrial for the Period 2016 - 2026
- United States (US) Paints Import Export Trade Statistics
- Market Opportunity Assessment By Resin
- Market Opportunity Assessment By Technology
- Market Opportunity Assessment By Application
- United States (US) Paints Top Companies Market Share
- United States (US) Paints Competitive Benchmarking By Technical and Operational Parameters
- United States (US) Paints Company Profiles
- United States (US) Paints Key Strategic Recommendations
Frequently Asked Questions About the Market Study (FAQs):
6Wresearch actively monitors the United States (US) Paints Market and publishes its comprehensive annual report, highlighting emerging trends, growth drivers, revenue analysis, and forecast outlook. Our insights help businesses to make data-backed strategic decisions with ongoing market dynamics. Our analysts track relevent industries related to the United States (US) Paints Market, allowing our clients with actionable intelligence and reliable forecasts tailored to emerging regional needs.
Yes, we provide customisation as per your requirements. To learn more, feel free to contact us on sales@6wresearch.com
1 Executive Summary |
2 Introduction |
2.1 Key Highlights of the Report |
2.2 Report Description |
2.3 Market Scope & Segmentation |
2.4 Research Methodology |
2.5 Assumptions |
3 United States (US) Paints Market Overview |
3.1 United States (US) Country Macro Economic Indicators |
3.2 United States (US) Paints Market Revenues & Volume, 2019 & 2026F |
3.3 United States (US) Paints Market - Industry Life Cycle |
3.4 United States (US) Paints Market - Porter's Five Forces |
3.5 United States (US) Paints Market Revenues & Volume Share, By Resin, 2019 & 2026F |
3.6 United States (US) Paints Market Revenues & Volume Share, By Technology, 2019 & 2026F |
3.7 United States (US) Paints Market Revenues & Volume Share, By Application, 2019 & 2026F |
4 United States (US) Paints Market Dynamics |
4.1 Impact Analysis |
4.2 Market Drivers |
4.2.1 Growing construction industry in the US |
4.2.2 Increasing demand for eco-friendly and sustainable paint products |
4.2.3 Innovation in paint technology and product offerings |
4.3 Market Restraints |
4.3.1 Fluctuating raw material prices |
4.3.2 Stringent regulations regarding volatile organic compounds (VOCs) in paints |
4.3.3 Competition from alternative surface coatings like wallpapers and tiles |
5 United States (US) Paints Market Trends |
6 United States (US) Paints Market, By Types |
6.1 United States (US) Paints Market, By Resin |
6.1.1 Overview and Analysis |
6.1.2 United States (US) Paints Market Revenues & Volume, By Resin, 2016 - 2026F |
6.1.3 United States (US) Paints Market Revenues & Volume, By Acrylic, 2016 - 2026F |
6.1.4 United States (US) Paints Market Revenues & Volume, By Alkyd, 2016 - 2026F |
6.1.5 United States (US) Paints Market Revenues & Volume, By Epoxy, 2016 - 2026F |
6.1.6 United States (US) Paints Market Revenues & Volume, By Polyurethane, 2016 - 2026F |
6.1.7 United States (US) Paints Market Revenues & Volume, By Polyester, 2016 - 2026F |
6.2 United States (US) Paints Market, By Technology |
6.2.1 Overview and Analysis |
6.2.2 United States (US) Paints Market Revenues & Volume, By Waterborne, 2016 - 2026F |
6.2.3 United States (US) Paints Market Revenues & Volume, By Solventborne, 2016 - 2026F |
6.2.4 United States (US) Paints Market Revenues & Volume, By Powder, 2016 - 2026F |
6.3 United States (US) Paints Market, By Application |
6.3.1 Overview and Analysis |
6.3.2 United States (US) Paints Market Revenues & Volume, By Architectural, 2016 - 2026F |
6.3.3 United States (US) Paints Market Revenues & Volume, By Industrial, 2016 - 2026F |
7 United States (US) Paints Market Import-Export Trade Statistics |
7.1 United States (US) Paints Market Export to Major Countries |
7.2 United States (US) Paints Market Imports from Major Countries |
8 United States (US) Paints Market Key Performance Indicators |
8.1 Adoption rate of low-VOC or VOC-free paints in the market |
8.2 Number of new product launches in the paint industry |
8.3 Investment in research and development for sustainable paint solutions |
8.4 Growth in demand for specialty paints (e.g., anti-microbial, heat-resistant) |
9 United States (US) Paints Market - Opportunity Assessment |
9.1 United States (US) Paints Market Opportunity Assessment, By Resin, 2019 & 2026F |
9.2 United States (US) Paints Market Opportunity Assessment, By Technology, 2019 & 2026F |
9.3 United States (US) Paints Market Opportunity Assessment, By Application, 2019 & 2026F |
10 United States (US) Paints Market - Competitive Landscape |
10.1 United States (US) Paints Market Revenue Share, By Companies, 2019 |
10.2 United States (US) Paints Market Competitive Benchmarking, By Operating and Technical Parameters |
11 Company Profiles |
12 Recommendations |
13 Disclaimer |
Global Go To Market Strategy - 2030
Export potential enables firms to identify high-growth global markets with greater confidence by combining advanced trade intelligence with a structured quantitative methodology. The framework analyzes emerging demand trends and country-level import patterns while integrating macroeconomic and trade datasets such as GDP and population forecasts, bilateral import–export flows, tariff structures, elasticity differentials between developed and developing economies, geographic distance, and import demand projections. Using weighted trade values from 2020–2024 as the base period to project country-to-country export potential for 2030, these inputs are operationalized through calculated drivers such as gravity model parameters, tariff impact factors, and projected GDP per-capita growth. Through an analysis of hidden potentials, demand hotspots, and market conditions that are most favorable to success, this method enables firms to focus on target countries, maximize returns, and global expansion with data, backed by accuracy.
By factoring in the projected importer demand gap that is currently unmet and could be potential opportunity, it identifies the potential for the Exporter (Country) among 190 countries, against the general trade analysis, which identifies the biggest importer or exporter.
To discover high-growth global markets and optimize your business strategy:
Click Here
Pricing
- Single User License$ 1,995
- Department License$ 2,400
- Site License$ 3,120
- Global License$ 3,795

Leadership Perspectives from Industry Events
Search
Thought Leadership and Analyst Meet


Our Clients
6WResearch In News
- India Air Conditioner Market Set for Strong Rebound in 2026 After Weather-Led Correction and GST-Driven Recovery: 6Wresearch
- ADAS in India: How Automatic Emergency Braking, Blind Spot Detection & Driver Monitoring are Transforming Road Safety
- Doha a strategic location for EV manufacturing hub: IPA Qatar
- Demand for luxury TVs surging in the GCC, says Samsung
- Empowering Growth: The Thriving Journey of Bangladesh’s Cable Industry
- Demand for luxury TVs surging in the GCC, says Samsung
Latest Reports
- Nicaragua RPG Gaming Market (2026-2032)
- New Zealand RPG Gaming Market (2026-2032)
- Netherlands RPG Gaming Market (2026-2032)
- Nauru RPG Gaming Market (2026-2032)
- Namibia RPG Gaming Market (2026-2032)
- Mozambique RPG Gaming Market (2026-2032)
- Montenegro RPG Gaming Market (2026-2032)
- Mongolia RPG Gaming Market (2026-2032)
- Monaco RPG Gaming Market (2026-2032)
- Micronesia RPG Gaming Market (2026-2032)
Industry Events and Analyst Meet

EV India Expo 2026

HIMTEX 2026

India Refining Summit 2026

India EV Show 2026

EV tech India Expo 2026
Whitepaper
- Middle East & Africa Commercial Security Market Click here to view more.
- Middle East & Africa Fire Safety Systems & Equipment Market Click here to view more.
- GCC Drone Market Click here to view more.
- Middle East Lighting Fixture Market Click here to view more.
- GCC Physical & Perimeter Security Market Click here to view more.