United States (US) Pea Processed Ingredients Market (2025-2031) Outlook | Trends, Value, Share, Revenue, Size, Analysis, Growth, Companies, Forecast & Industry
Market Forecast By Type (Protein, Starch, Flour, Fiber), By Application (Food, Meat & Meat Substitutes, Performance Nutrition, Functional Foods, Snacks, Bakery, Confectionery, Others), By Source (Yellow Split Peas, Chickpeas, Lentils) And Competitive Landscape
| Product Code: ETC223501 | Publication Date: Aug 2022 | Updated Date: Nov 2025 | Product Type: Market Research Report | |
| Publisher: 6Wresearch | Author: Bhawna Singh | No. of Pages: 75 | No. of Figures: 35 | No. of Tables: 20 |
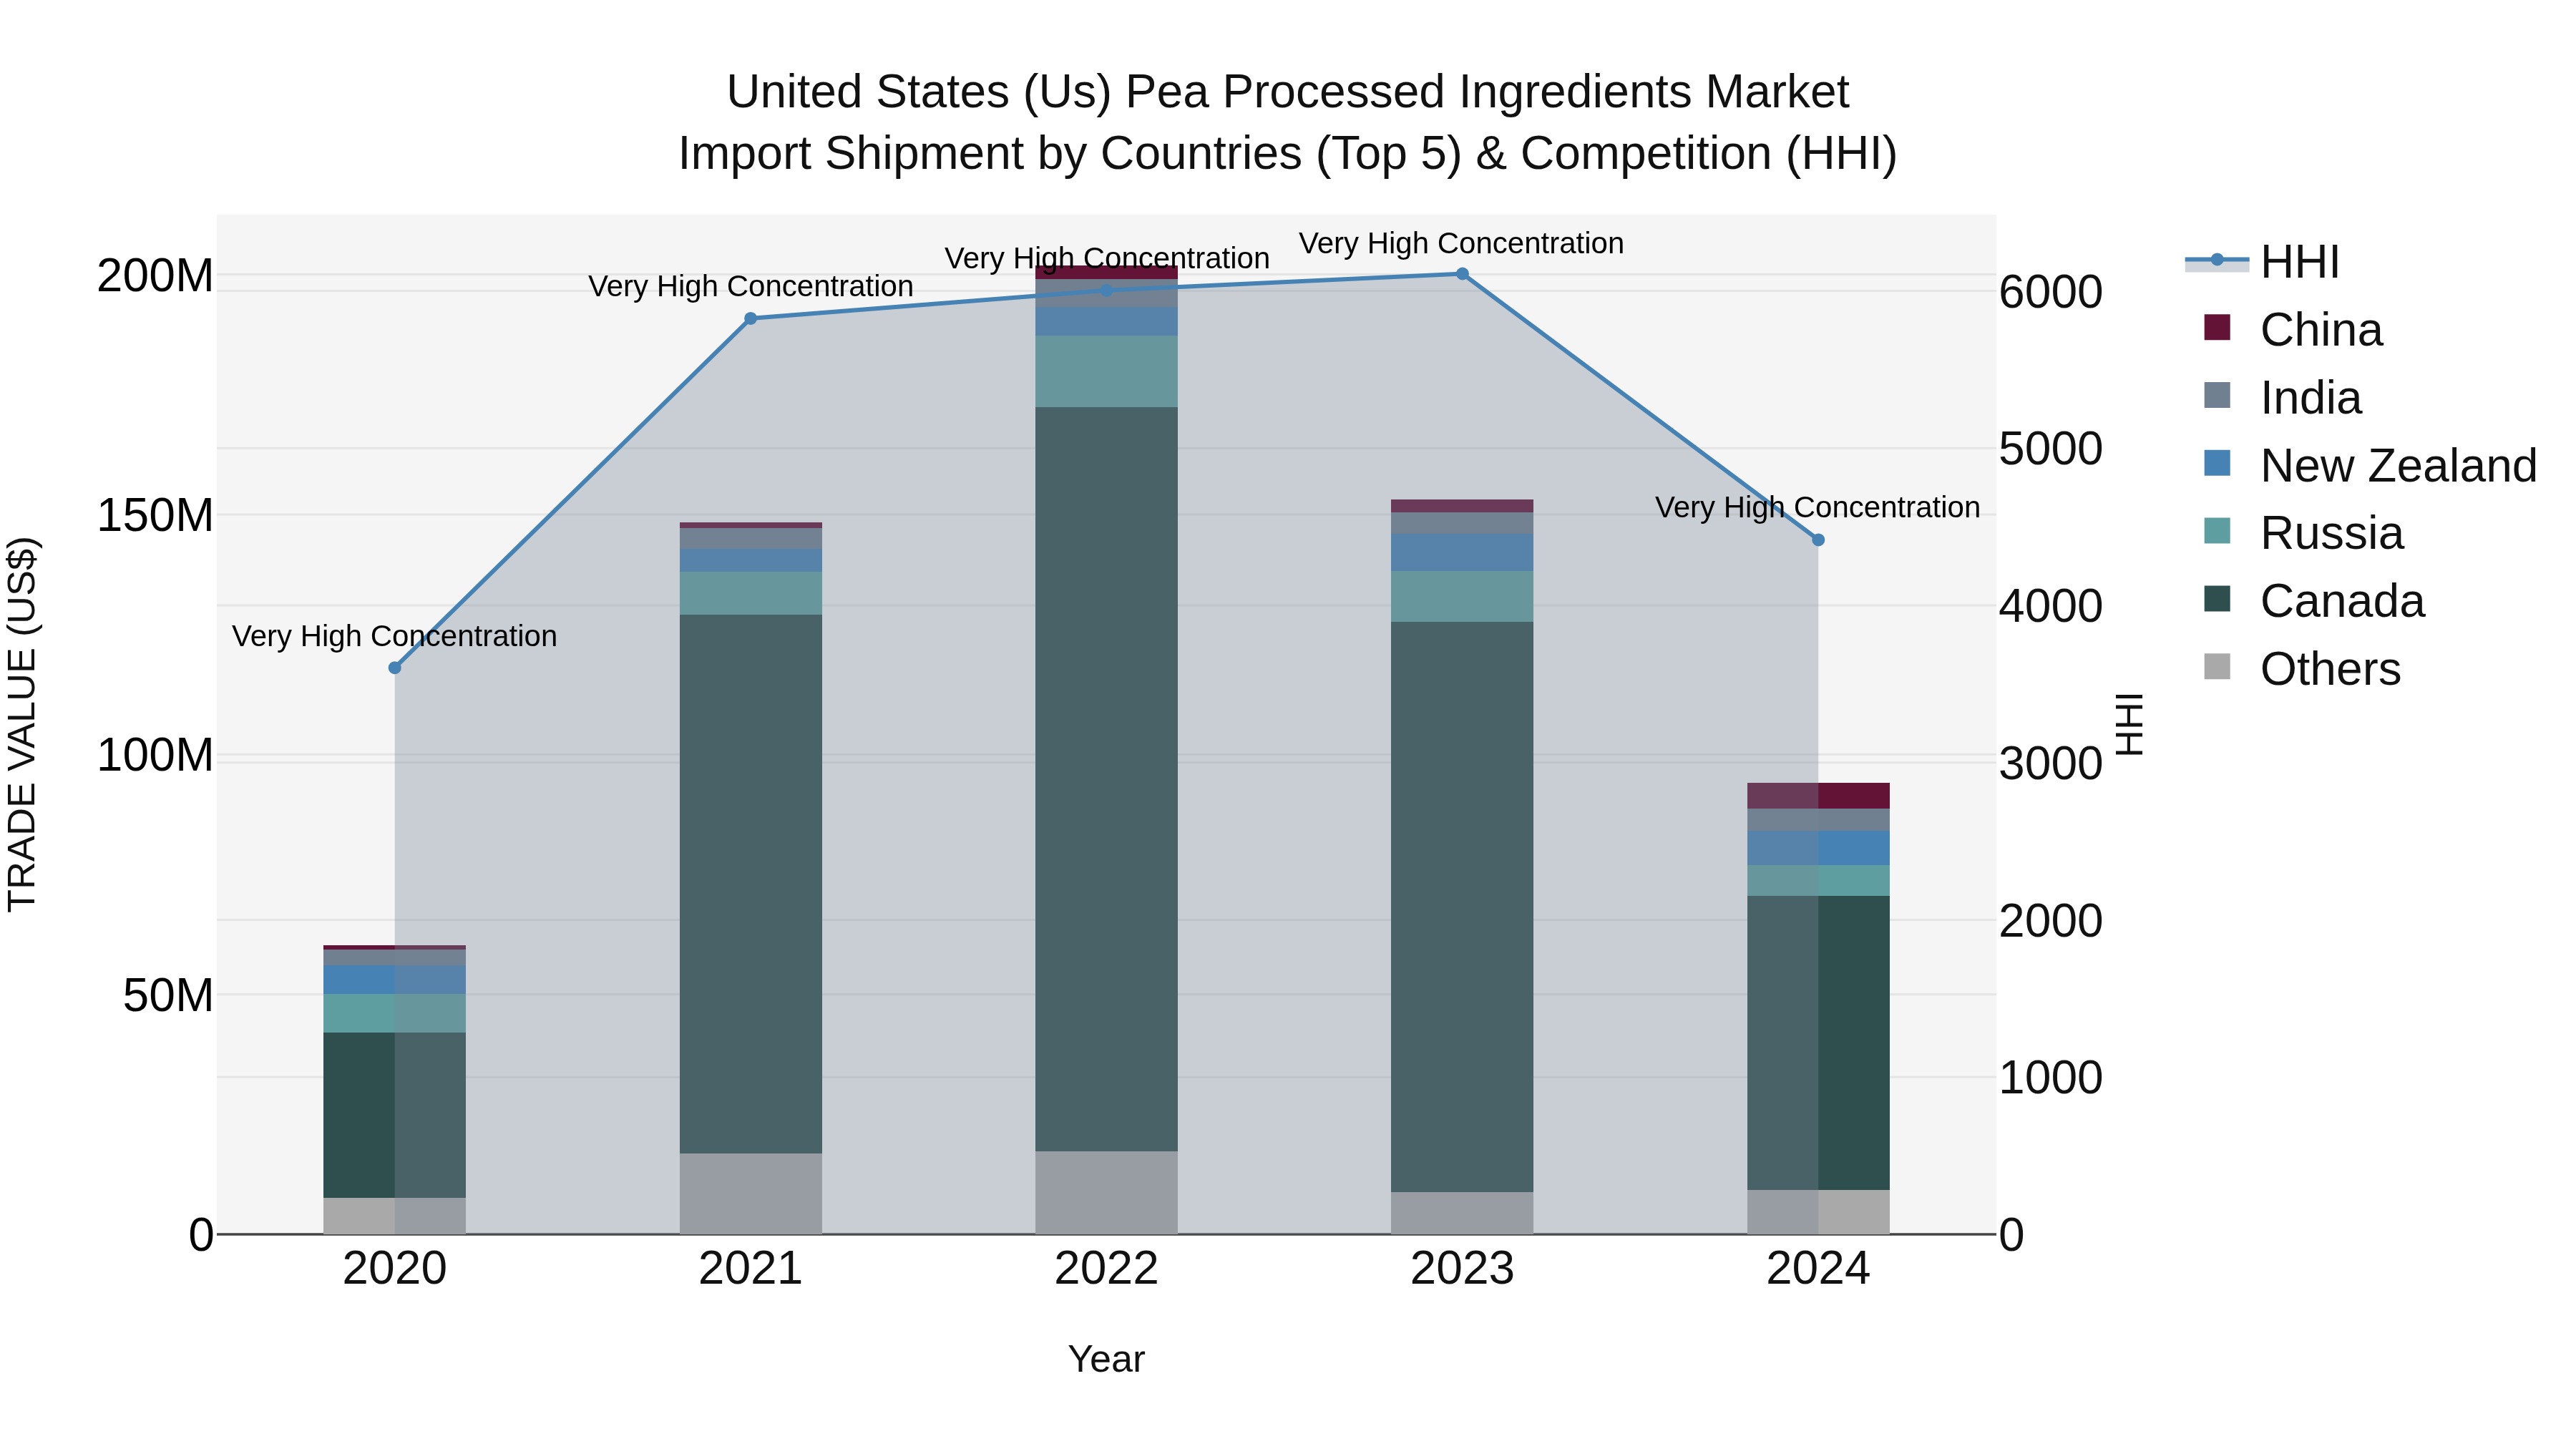
United States (US) Pea Processed Ingredients Market Top 5 Importing Countries and Market Competition (HHI) Analysis
In 2024, the United States continued to rely heavily on imports of pea processed ingredients, with top suppliers including Canada, New Zealand, Russia, China, and India. Despite a significant drop in growth rate from 2023 to 2024, the compound annual growth rate (CAGR) from 2020 to 2024 remained strong at 11.77%. The high Herfindahl-Hirschman Index (HHI) indicates a concentrated market, suggesting potential challenges and opportunities for both buyers and suppliers in the pea processed ingredients sector.
United States (US) Pea Processed Ingredients Market Overview
The United States Pea Processed Ingredients Market is experiencing steady growth driven by the increasing consumer demand for plant-based and sustainable food products. Pea protein, starch, and fiber are the primary processed ingredients derived from peas, used in a variety of food and beverage applications such as meat alternatives, dairy alternatives, snacks, and baked goods. The market is influenced by the growing awareness of the health benefits associated with pea-based products, including their high protein content, gluten-free nature, and sustainability credentials. Key players in the US pea processed ingredients market include ingredient suppliers, food manufacturers, and retailers, who are investing in product innovation and expanding their pea ingredient offerings to cater to the evolving consumer preferences for clean label and plant-based options.
United States (US) Pea Processed Ingredients Market Trends
The US Pea Processed Ingredients Market is experiencing growth due to the increasing consumer demand for plant-based and clean label products. Pea protein, in particular, is gaining popularity as a sustainable and allergen-friendly alternative to traditional animal-based proteins. Manufacturers are incorporating pea protein into a variety of food and beverage products, including plant-based meat substitutes, dairy alternatives, snacks, and nutritional supplements. Additionally, the trend towards healthier eating habits and the rising awareness of the environmental impact of food production are driving the adoption of pea processed ingredients in the US market. Companies are investing in research and development to innovate new pea-based products and enhance the functional properties of pea ingredients, further fueling the market growth.
United States (US) Pea Processed Ingredients Market Challenges
In the US Pea Processed Ingredients Market, challenges include fluctuating raw material prices due to factors like weather conditions affecting pea crops, which can impact production costs and profit margins for manufacturers. Another challenge is the competition from alternative plant-based ingredients, such as soy and lentils, which offer similar nutritional benefits and may be preferred by consumers or food manufacturers for different applications. Additionally, ensuring consistent quality and availability of pea processed ingredients can be challenging, as demand for plant-based products continues to grow, putting pressure on suppliers to meet market needs. Adapting to changing consumer preferences and trends, as well as navigating regulatory requirements related to labeling and marketing of pea-based products, also present challenges for companies operating in this market.
United States (US) Pea Processed Ingredients Market Investment Opportunities
The US Pea Processed Ingredients Market presents promising investment opportunities driven by the increasing consumer demand for plant-based protein alternatives. Pea protein, starch, flour, and fiber are gaining popularity in various applications such as food and beverage, sports nutrition, and supplements due to their nutritional benefits and sustainability. Investors can explore opportunities in companies involved in pea processing, product development, and distribution to capitalize on the growing market trend. Additionally, advancements in processing technologies and innovation in product formulations are creating a conducive environment for investment in this sector. Overall, the US Pea Processed Ingredients Market offers potential for growth and profitability for investors looking to tap into the plant-based food industry.
United States (US) Pea Processed Ingredients Market Government Policy
Government policies related to the US Pea Processed Ingredients Market primarily focus on agricultural regulations, trade agreements, and food safety standards. The US Department of Agriculture (USDA) plays a key role in overseeing the production, processing, and labeling of pea processed ingredients to ensure compliance with quality and safety standards. Additionally, trade agreements such as the US-Mexico-Canada Agreement (USMCA) and international trade policies impact the export and import of pea processed ingredients. Government initiatives related to sustainable agriculture, research and development funding, and support for farmers also influence the growth and competitiveness of the US pea processed ingredients market. Overall, a combination of regulatory oversight, trade policies, and agricultural support programs shape the operating environment for companies in the pea processed ingredients sector.
United States (US) Pea Processed Ingredients Market Future Outlook
The future outlook for the United States Pea Processed Ingredients Market appears promising, driven by increasing consumer demand for plant-based protein alternatives, health-conscious dietary choices, and sustainable food options. Pea protein is gaining popularity as a versatile ingredient in various food and beverage applications, including plant-based meat alternatives, dairy alternatives, sports nutrition products, and functional foods. The market is expected to witness steady growth due to its nutritional benefits, allergen-friendly profile, and environmentally sustainable production compared to animal-based proteins. Key players are investing in product innovation, expanding production capacities, and forming strategic partnerships to capitalize on the growing market opportunities. However, competition from other plant-based protein sources and regulatory challenges may pose some challenges to market growth in the coming years.
Key Highlights of the Report:
- United States (US) Pea Processed Ingredients Market Outlook
- Market Size of United States (US) Pea Processed Ingredients Market, 2024
- Forecast of United States (US) Pea Processed Ingredients Market, 2031
- Historical Data and Forecast of United States (US) Pea Processed Ingredients Revenues & Volume for the Period 2021 - 2031
- United States (US) Pea Processed Ingredients Market Trend Evolution
- United States (US) Pea Processed Ingredients Market Drivers and Challenges
- United States (US) Pea Processed Ingredients Price Trends
- United States (US) Pea Processed Ingredients Porter's Five Forces
- United States (US) Pea Processed Ingredients Industry Life Cycle
- Historical Data and Forecast of United States (US) Pea Processed Ingredients Market Revenues & Volume By Type for the Period 2021 - 2031
- Historical Data and Forecast of United States (US) Pea Processed Ingredients Market Revenues & Volume By Protein for the Period 2021 - 2031
- Historical Data and Forecast of United States (US) Pea Processed Ingredients Market Revenues & Volume By Starch for the Period 2021 - 2031
- Historical Data and Forecast of United States (US) Pea Processed Ingredients Market Revenues & Volume By Flour for the Period 2021 - 2031
- Historical Data and Forecast of United States (US) Pea Processed Ingredients Market Revenues & Volume By Fiber for the Period 2021 - 2031
- Historical Data and Forecast of United States (US) Pea Processed Ingredients Market Revenues & Volume By Application for the Period 2021 - 2031
- Historical Data and Forecast of United States (US) Pea Processed Ingredients Market Revenues & Volume By Food for the Period 2021 - 2031
- Historical Data and Forecast of United States (US) Pea Processed Ingredients Market Revenues & Volume By Meat & Meat Substitutes for the Period 2021 - 2031
- Historical Data and Forecast of United States (US) Pea Processed Ingredients Market Revenues & Volume By Performance Nutrition for the Period 2021 - 2031
- Historical Data and Forecast of United States (US) Pea Processed Ingredients Market Revenues & Volume By Functional Foods for the Period 2021 - 2031
- Historical Data and Forecast of United States (US) Pea Processed Ingredients Market Revenues & Volume By Snacks for the Period 2021 - 2031
- Historical Data and Forecast of United States (US) Pea Processed Ingredients Market Revenues & Volume By Bakery for the Period 2021 - 2031
- Historical Data and Forecast of United States (US) Pea Processed Ingredients Market Revenues & Volume By Confectionery for the Period 2021 - 2031
- Historical Data and Forecast of United States (US) Pea Processed Ingredients Market Revenues & Volume By Others for the Period 2021 - 2031
- Historical Data and Forecast of United States (US) Pea Processed Ingredients Market Revenues & Volume By Source for the Period 2021 - 2031
- Historical Data and Forecast of United States (US) Pea Processed Ingredients Market Revenues & Volume By Yellow Split Peas for the Period 2021 - 2031
- Historical Data and Forecast of United States (US) Pea Processed Ingredients Market Revenues & Volume By Chickpeas for the Period 2021 - 2031
- Historical Data and Forecast of United States (US) Pea Processed Ingredients Market Revenues & Volume By Lentils for the Period 2021 - 2031
- United States (US) Pea Processed Ingredients Import Export Trade Statistics
- Market Opportunity Assessment By Type
- Market Opportunity Assessment By Application
- Market Opportunity Assessment By Source
- United States (US) Pea Processed Ingredients Top Companies Market Share
- United States (US) Pea Processed Ingredients Competitive Benchmarking By Technical and Operational Parameters
- United States (US) Pea Processed Ingredients Company Profiles
- United States (US) Pea Processed Ingredients Key Strategic Recommendations
Frequently Asked Questions About the Market Study (FAQs):
6Wresearch actively monitors the United States (US) Pea Processed Ingredients Market and publishes its comprehensive annual report, highlighting emerging trends, growth drivers, revenue analysis, and forecast outlook. Our insights help businesses to make data-backed strategic decisions with ongoing market dynamics. Our analysts track relevent industries related to the United States (US) Pea Processed Ingredients Market, allowing our clients with actionable intelligence and reliable forecasts tailored to emerging regional needs.
Yes, we provide customisation as per your requirements. To learn more, feel free to contact us on sales@6wresearch.com
1 Executive Summary |
2 Introduction |
2.1 Key Highlights of the Report |
2.2 Report Description |
2.3 Market Scope & Segmentation |
2.4 Research Methodology |
2.5 Assumptions |
3 United States (US) Pea Processed Ingredients Market Overview |
3.1 United States (US) Country Macro Economic Indicators |
3.2 United States (US) Pea Processed Ingredients Market Revenues & Volume, 2021 & 2031F |
3.3 United States (US) Pea Processed Ingredients Market - Industry Life Cycle |
3.4 United States (US) Pea Processed Ingredients Market - Porter's Five Forces |
3.5 United States (US) Pea Processed Ingredients Market Revenues & Volume Share, By Type, 2021 & 2031F |
3.6 United States (US) Pea Processed Ingredients Market Revenues & Volume Share, By Application, 2021 & 2031F |
3.7 United States (US) Pea Processed Ingredients Market Revenues & Volume Share, By Source, 2021 & 2031F |
4 United States (US) Pea Processed Ingredients Market Dynamics |
4.1 Impact Analysis |
4.2 Market Drivers |
4.2.1 Growing consumer awareness about health benefits of pea processed ingredients |
4.2.2 Increasing demand for plant-based protein alternatives |
4.2.3 Rise in vegan and vegetarian population in the US |
4.3 Market Restraints |
4.3.1 Price volatility of pea crops impacting ingredient costs |
4.3.2 Competition from other plant-based protein sources |
4.3.3 Limited pea processing infrastructure in the US |
5 United States (US) Pea Processed Ingredients Market Trends |
6 United States (US) Pea Processed Ingredients Market, By Types |
6.1 United States (US) Pea Processed Ingredients Market, By Type |
6.1.1 Overview and Analysis |
6.1.2 United States (US) Pea Processed Ingredients Market Revenues & Volume, By Type, 2021 - 2031F |
6.1.3 United States (US) Pea Processed Ingredients Market Revenues & Volume, By Protein, 2021 - 2031F |
6.1.4 United States (US) Pea Processed Ingredients Market Revenues & Volume, By Starch, 2021 - 2031F |
6.1.5 United States (US) Pea Processed Ingredients Market Revenues & Volume, By Flour, 2021 - 2031F |
6.1.6 United States (US) Pea Processed Ingredients Market Revenues & Volume, By Fiber, 2021 - 2031F |
6.2 United States (US) Pea Processed Ingredients Market, By Application |
6.2.1 Overview and Analysis |
6.2.2 United States (US) Pea Processed Ingredients Market Revenues & Volume, By Food, 2021 - 2031F |
6.2.3 United States (US) Pea Processed Ingredients Market Revenues & Volume, By Meat & Meat Substitutes, 2021 - 2031F |
6.2.4 United States (US) Pea Processed Ingredients Market Revenues & Volume, By Performance Nutrition, 2021 - 2031F |
6.2.5 United States (US) Pea Processed Ingredients Market Revenues & Volume, By Functional Foods, 2021 - 2031F |
6.2.6 United States (US) Pea Processed Ingredients Market Revenues & Volume, By Snacks, 2021 - 2031F |
6.2.7 United States (US) Pea Processed Ingredients Market Revenues & Volume, By Bakery, 2021 - 2031F |
6.2.8 United States (US) Pea Processed Ingredients Market Revenues & Volume, By Others, 2021 - 2031F |
6.2.9 United States (US) Pea Processed Ingredients Market Revenues & Volume, By Others, 2021 - 2031F |
6.3 United States (US) Pea Processed Ingredients Market, By Source |
6.3.1 Overview and Analysis |
6.3.2 United States (US) Pea Processed Ingredients Market Revenues & Volume, By Yellow Split Peas, 2021 - 2031F |
6.3.3 United States (US) Pea Processed Ingredients Market Revenues & Volume, By Chickpeas, 2021 - 2031F |
6.3.4 United States (US) Pea Processed Ingredients Market Revenues & Volume, By Lentils, 2021 - 2031F |
7 United States (US) Pea Processed Ingredients Market Import-Export Trade Statistics |
7.1 United States (US) Pea Processed Ingredients Market Export to Major Countries |
7.2 United States (US) Pea Processed Ingredients Market Imports from Major Countries |
8 United States (US) Pea Processed Ingredients Market Key Performance Indicators |
8.1 Consumer adoption rate of pea processed ingredients in new product launches |
8.2 Growth of pea processing capacity in the US |
8.3 Number of partnerships between pea ingredient suppliers and food manufacturers for product development |
9 United States (US) Pea Processed Ingredients Market - Opportunity Assessment |
9.1 United States (US) Pea Processed Ingredients Market Opportunity Assessment, By Type, 2021 & 2031F |
9.2 United States (US) Pea Processed Ingredients Market Opportunity Assessment, By Application, 2021 & 2031F |
9.3 United States (US) Pea Processed Ingredients Market Opportunity Assessment, By Source, 2021 & 2031F |
10 United States (US) Pea Processed Ingredients Market - Competitive Landscape |
10.1 United States (US) Pea Processed Ingredients Market Revenue Share, By Companies, 2024 |
10.2 United States (US) Pea Processed Ingredients Market Competitive Benchmarking, By Operating and Technical Parameters |
11 Company Profiles |
12 Recommendations |
13 Disclaimer |
Global Go To Market Strategy - 2030
Export potential enables firms to identify high-growth global markets with greater confidence by combining advanced trade intelligence with a structured quantitative methodology. The framework analyzes emerging demand trends and country-level import patterns while integrating macroeconomic and trade datasets such as GDP and population forecasts, bilateral import–export flows, tariff structures, elasticity differentials between developed and developing economies, geographic distance, and import demand projections. Using weighted trade values from 2020–2024 as the base period to project country-to-country export potential for 2030, these inputs are operationalized through calculated drivers such as gravity model parameters, tariff impact factors, and projected GDP per-capita growth. Through an analysis of hidden potentials, demand hotspots, and market conditions that are most favorable to success, this method enables firms to focus on target countries, maximize returns, and global expansion with data, backed by accuracy.
By factoring in the projected importer demand gap that is currently unmet and could be potential opportunity, it identifies the potential for the Exporter (Country) among 190 countries, against the general trade analysis, which identifies the biggest importer or exporter.
To discover high-growth global markets and optimize your business strategy:
Click Here
Pricing
- Single User License$ 1,995
- Department License$ 2,400
- Site License$ 3,120
- Global License$ 3,795

Leadership Perspectives from Industry Events
Search
Thought Leadership and Analyst Meet


Our Clients
6WResearch In News
- India Air Conditioner Market Set for Strong Rebound in 2026 After Weather-Led Correction and GST-Driven Recovery: 6Wresearch
- ADAS in India: How Automatic Emergency Braking, Blind Spot Detection & Driver Monitoring are Transforming Road Safety
- Doha a strategic location for EV manufacturing hub: IPA Qatar
- Demand for luxury TVs surging in the GCC, says Samsung
- Empowering Growth: The Thriving Journey of Bangladesh’s Cable Industry
- Demand for luxury TVs surging in the GCC, says Samsung
Latest Reports
- Nicaragua RPG Gaming Market (2026-2032)
- New Zealand RPG Gaming Market (2026-2032)
- Netherlands RPG Gaming Market (2026-2032)
- Nauru RPG Gaming Market (2026-2032)
- Namibia RPG Gaming Market (2026-2032)
- Mozambique RPG Gaming Market (2026-2032)
- Montenegro RPG Gaming Market (2026-2032)
- Mongolia RPG Gaming Market (2026-2032)
- Monaco RPG Gaming Market (2026-2032)
- Micronesia RPG Gaming Market (2026-2032)
Industry Events and Analyst Meet

HIMTEX 2026

India Refining Summit 2026

India EV Show 2026

EV tech India Expo 2026

Auto Tech Asia 2026
Whitepaper
- Middle East & Africa Commercial Security Market Click here to view more.
- Middle East & Africa Fire Safety Systems & Equipment Market Click here to view more.
- GCC Drone Market Click here to view more.
- Middle East Lighting Fixture Market Click here to view more.
- GCC Physical & Perimeter Security Market Click here to view more.