United States (US) Phthalic anhydride Market Outlook | COVID-19 IMPACT, Analysis, Trends, Value, Share, Companies, Size, Forecast, Growth, Revenue & Industry
Market Forecast By Process Type (O-Xylene Catalytic Oxidation, Napthalene Catalytic Oxidation), By Applications (Plasticizer, Polyester Resin, Alkyd Resin, Polyester Polyols, Dyes, Medicine, Insecticides, Others), By End-users (Automotive & Transportation, Building & Construction, Paints & Coatings, Marine, Electrical & Electronics, Plastics, Agriculture, Others) And Competitive Landscape
| Product Code: ETC088580 | Publication Date: Jun 2021 | Updated Date: Nov 2025 | Product Type: Report | |
| Publisher: 6Wresearch | Author: Ravi Bhandari | No. of Pages: 70 | No. of Figures: 35 | No. of Tables: 5 |
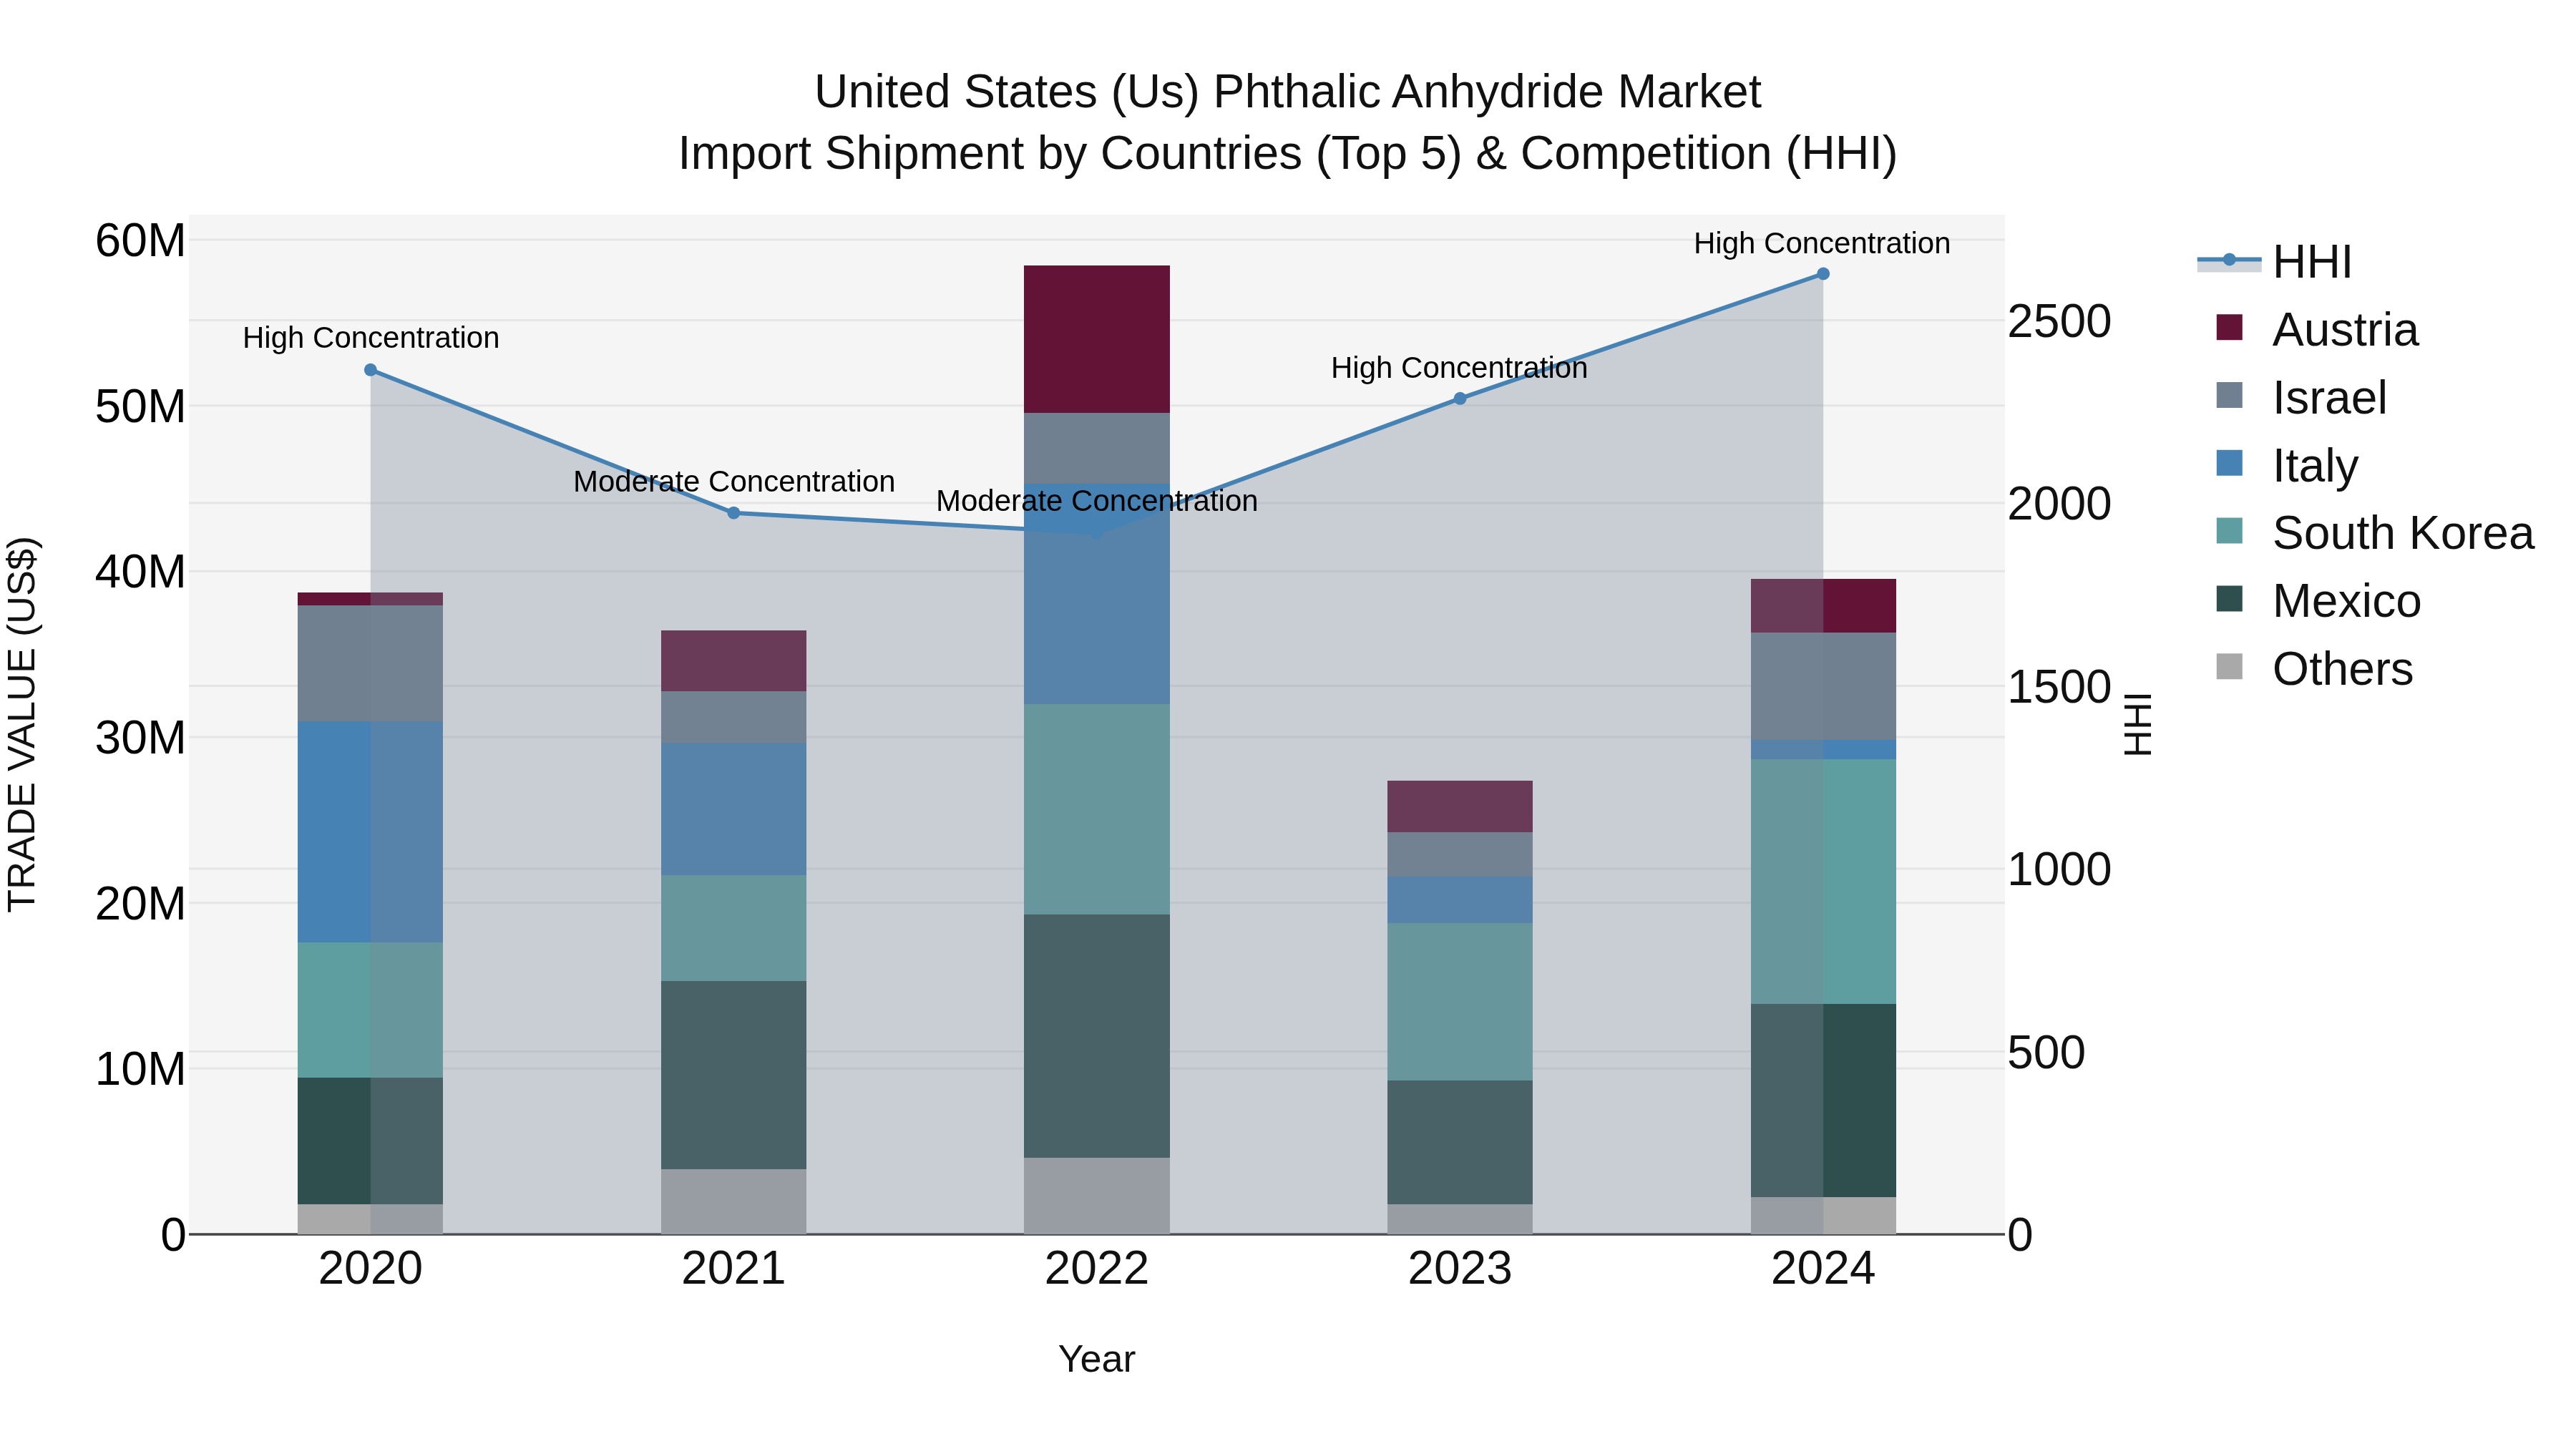
United States (US) Phthalic Anhydride Market Top 5 Importing Countries and Market Competition (HHI) Analysis
In 2024, the United States continued to see significant import shipments of phthalic anhydride, with top exporters including South Korea, Mexico, Israel, Austria, and Brazil. The market remained highly concentrated, as indicated by the high Herfindahl-Hirschman Index (HHI). Despite a relatively modest compound annual growth rate (CAGR) of 0.53% from 2020 to 2024, the growth rate from 2023 to 2024 surged to an impressive 44.46%. This data suggests a dynamic and evolving market landscape for phthalic anhydride imports in the United States, with potential opportunities for both suppliers and buyers to capitalize on this growth.
United States (US) Phthalic anhydride Market Overview
The United States Phthalic anhydride market is a significant segment of the country`s chemical industry, with a strong demand driven by its use in the production of plasticizers, resins, and other chemical compounds. The market is primarily driven by the construction, automotive, and packaging industries, which utilize phthalic anhydride in various applications. Key players in the US phthalic anhydride market include major chemical manufacturers and suppliers who cater to both domestic and international markets. The market is highly competitive, with companies focusing on product innovation, sustainability, and cost-efficiency to maintain their market share. Regulatory factors, such as environmental concerns and health regulations, also play a crucial role in shaping the market dynamics and driving technological advancements in phthalic anhydride production processes.
United States (US) Phthalic anhydride Market Trends
The United States Phthalic anhydride market is experiencing growth driven by several key trends. One significant trend is the increasing demand for phthalic anhydride in the production of plasticizers, particularly in industries such as automotive, construction, and packaging. Another trend is the rising focus on sustainability, leading to a shift towards bio-based phthalic anhydride derived from renewable sources. Additionally, advancements in technology and innovation in the production processes are enhancing efficiency and reducing costs in the market. Regulatory initiatives promoting the use of eco-friendly chemicals are also influencing the market dynamics. Overall, these trends are shaping the US Phthalic anhydride market towards a more sustainable and competitive future.
United States (US) Phthalic anhydride Market Challenges
In the United States Phthalic anhydride market, some of the key challenges include regulatory pressures related to environmental concerns and health risks associated with the use of phthalates. The market is also impacted by fluctuating raw material prices, which can affect production costs and profit margins for manufacturers. Additionally, there is increasing competition from alternative chemicals and materials that offer similar properties but without the negative connotations of phthalates. Market players in the US Phthalic anhydride industry need to navigate these challenges by investing in research and development for sustainable production methods, complying with stringent regulations, and diversifying their product offerings to stay competitive in the evolving market landscape.
United States (US) Phthalic anhydride Market Investment Opportunities
The US phthalic anhydride market presents promising investment opportunities due to its widespread applications in industries such as plastics, paints, and coatings. With the increasing demand for phthalic anhydride as a key ingredient in the production of plasticizers, the market is expected to witness steady growth in the coming years. Investors can capitalize on this trend by investing in companies involved in the manufacturing and distribution of phthalic anhydride, as well as in research and development efforts focused on improving production processes and expanding applications. Additionally, with growing awareness and regulatory focus on sustainable and environmentally friendly practices, there is potential for investments in innovative, eco-friendly alternatives to traditional phthalic anhydride production methods. Overall, the US phthalic anhydride market offers diverse investment opportunities for those looking to tap into the chemical industry`s growth potential.
United States (US) Phthalic anhydride Market Government Policy
Government policies related to the US Phthalic anhydride market primarily focus on environmental regulations and safety standards. The Environmental Protection Agency (EPA) has set limits on the emission of phthalates, including phthalic anhydride, to protect air and water quality. Additionally, the Occupational Safety and Health Administration (OSHA) enforces workplace standards to ensure the safe handling and storage of chemicals, including phthalic anhydride, to protect workers from potential health hazards. The US Department of Transportation (DOT) regulates the transportation of phthalic anhydride to prevent accidents and ensure the safe handling of hazardous materials. These policies aim to mitigate the environmental and health risks associated with phthalic anhydride production and use in the US market.
United States (US) Phthalic anhydride Market Future Outlook
The future outlook for the United States Phthalic anhydride market is expected to be positive, driven by various factors such as the growing demand for plasticizers in the construction, automotive, and packaging industries. The increasing production of PVC, which is a key application of phthalic anhydride, is also likely to contribute to market growth. Additionally, the rising focus on sustainable and eco-friendly products is leading to the development of bio-based phthalic anhydride, which could further boost market expansion. However, challenges related to regulatory issues and environmental concerns surrounding phthalates may pose some constraints. Overall, with technological advancements and the increasing use of phthalic anhydride in various end-use industries, the market is anticipated to witness steady growth in the coming years.
Key Highlights of the Report:
- United States (US) Phthalic anhydride Market Outlook
- Market Size of United States (US) Phthalic anhydride Market, 2021
- Forecast of United States (US) Phthalic anhydride Market, 2027
- Historical Data and Forecast of United States (US) Phthalic anhydride Revenues & Volume for the Period 2018 - 2027
- United States (US) Phthalic anhydride Market Trend Evolution
- United States (US) Phthalic anhydride Market Drivers and Challenges
- United States (US) Phthalic anhydride Price Trends
- United States (US) Phthalic anhydride Porter's Five Forces
- United States (US) Phthalic anhydride Industry Life Cycle
- Historical Data and Forecast of United States (US) Phthalic anhydride Market Revenues & Volume By Process Type for the Period 2018 - 2027
- Historical Data and Forecast of United States (US) Phthalic anhydride Market Revenues & Volume By O-Xylene Catalytic Oxidation for the Period 2018 - 2027
- Historical Data and Forecast of United States (US) Phthalic anhydride Market Revenues & Volume By Napthalene Catalytic Oxidation for the Period 2018 - 2027
- Historical Data and Forecast of United States (US) Phthalic anhydride Market Revenues & Volume By Applications for the Period 2018 - 2027
- Historical Data and Forecast of United States (US) Phthalic anhydride Market Revenues & Volume By Plasticizer for the Period 2018 - 2027
- Historical Data and Forecast of United States (US) Phthalic anhydride Market Revenues & Volume By Polyester Resin for the Period 2018 - 2027
- Historical Data and Forecast of United States (US) Phthalic anhydride Market Revenues & Volume By Alkyd Resin for the Period 2018 - 2027
- Historical Data and Forecast of United States (US) Phthalic anhydride Market Revenues & Volume By Polyester Polyols for the Period 2018 - 2027
- Historical Data and Forecast of United States (US) Phthalic anhydride Market Revenues & Volume By Dyes for the Period 2018 - 2027
- Historical Data and Forecast of United States (US) Phthalic anhydride Market Revenues & Volume By Medicine for the Period 2018 - 2027
- Historical Data and Forecast of United States (US) Phthalic anhydride Market Revenues & Volume By Insecticides for the Period 2018 - 2027
- Historical Data and Forecast of United States (US) Phthalic anhydride Market Revenues & Volume By Others for the Period 2018 - 2027
- Historical Data and Forecast of United States (US) Phthalic anhydride Market Revenues & Volume By End-users for the Period 2018 - 2027
- Historical Data and Forecast of United States (US) Phthalic anhydride Market Revenues & Volume By Automotive & Transportation for the Period 2018 - 2027
- Historical Data and Forecast of United States (US) Phthalic anhydride Market Revenues & Volume By Building & Construction for the Period 2018 - 2027
- Historical Data and Forecast of United States (US) Phthalic anhydride Market Revenues & Volume By Paints & Coatings for the Period 2018 - 2027
- Historical Data and Forecast of United States (US) Phthalic anhydride Market Revenues & Volume By Marine for the Period 2018 - 2027
- Historical Data and Forecast of United States (US) Phthalic anhydride Market Revenues & Volume By Electrical & Electronics for the Period 2018 - 2027
- Historical Data and Forecast of United States (US) Phthalic anhydride Market Revenues & Volume By Plastics for the Period 2018 - 2027
- Historical Data and Forecast of United States (US) Phthalic anhydride Market Revenues & Volume By Agriculture for the Period 2018 - 2027
- Historical Data and Forecast of United States (US) Phthalic anhydride Market Revenues & Volume By Others for the Period 2018 - 2027
- United States (US) Phthalic anhydride Import Export Trade Statistics
- Market Opportunity Assessment By Process Type
- Market Opportunity Assessment By Applications
- Market Opportunity Assessment By End-users
- United States (US) Phthalic anhydride Top Companies Market Share
- United States (US) Phthalic anhydride Competitive Benchmarking By Technical and Operational Parameters
- United States (US) Phthalic anhydride Company Profiles
- United States (US) Phthalic anhydride Key Strategic Recommendations
Frequently Asked Questions About the Market Study (FAQs):
6Wresearch actively monitors the United States (US) Phthalic anhydride Market and publishes its comprehensive annual report, highlighting emerging trends, growth drivers, revenue analysis, and forecast outlook. Our insights help businesses to make data-backed strategic decisions with ongoing market dynamics. Our analysts track relevent industries related to the United States (US) Phthalic anhydride Market, allowing our clients with actionable intelligence and reliable forecasts tailored to emerging regional needs.
Yes, we provide customisation as per your requirements. To learn more, feel free to contact us on sales@6wresearch.com
1 Executive Summary |
2 Introduction |
2.1 Key Highlights of the Report |
2.2 Report Description |
2.3 Market Scope & Segmentation |
2.4 Research Methodology |
2.5 Assumptions |
3 United States (US) Phthalic anhydride Market Overview |
3.1 United States (US) Country Macro Economic Indicators |
3.2 United States (US) Phthalic anhydride Market Revenues & Volume, 2021 & 2027F |
3.3 United States (US) Phthalic anhydride Market - Industry Life Cycle |
3.4 United States (US) Phthalic anhydride Market - Porter's Five Forces |
3.5 United States (US) Phthalic anhydride Market Revenues & Volume Share, By Process Type, 2021 & 2027F |
3.6 United States (US) Phthalic anhydride Market Revenues & Volume Share, By Applications, 2021 & 2027F |
3.7 United States (US) Phthalic anhydride Market Revenues & Volume Share, By End-users, 2021 & 2027F |
4 United States (US) Phthalic anhydride Market Dynamics |
4.1 Impact Analysis |
4.2 Market Drivers |
4.2.1 Increasing demand for phthalic anhydride in the production of plasticizers |
4.2.2 Growth in the construction industry leading to higher demand for phthalic anhydride in paints and coatings |
4.2.3 Rising use of phthalic anhydride in the automotive sector for manufacturing various components |
4.3 Market Restraints |
4.3.1 Environmental concerns and regulations related to the use of phthalic anhydride |
4.3.2 Volatility in raw material prices impacting the production cost of phthalic anhydride |
5 United States (US) Phthalic anhydride Market Trends |
6 United States (US) Phthalic anhydride Market, By Types |
6.1 United States (US) Phthalic anhydride Market, By Process Type |
6.1.1 Overview and Analysis |
6.1.2 United States (US) Phthalic anhydride Market Revenues & Volume, By Process Type, 2018 - 2027F |
6.1.3 United States (US) Phthalic anhydride Market Revenues & Volume, By O-Xylene Catalytic Oxidation, 2018 - 2027F |
6.1.4 United States (US) Phthalic anhydride Market Revenues & Volume, By Napthalene Catalytic Oxidation, 2018 - 2027F |
6.2 United States (US) Phthalic anhydride Market, By Applications |
6.2.1 Overview and Analysis |
6.2.2 United States (US) Phthalic anhydride Market Revenues & Volume, By Plasticizer, 2018 - 2027F |
6.2.3 United States (US) Phthalic anhydride Market Revenues & Volume, By Polyester Resin, 2018 - 2027F |
6.2.4 United States (US) Phthalic anhydride Market Revenues & Volume, By Alkyd Resin, 2018 - 2027F |
6.2.5 United States (US) Phthalic anhydride Market Revenues & Volume, By Polyester Polyols, 2018 - 2027F |
6.2.6 United States (US) Phthalic anhydride Market Revenues & Volume, By Dyes, 2018 - 2027F |
6.2.7 United States (US) Phthalic anhydride Market Revenues & Volume, By Medicine, 2018 - 2027F |
6.2.8 United States (US) Phthalic anhydride Market Revenues & Volume, By Others, 2018 - 2027F |
6.2.9 United States (US) Phthalic anhydride Market Revenues & Volume, By Others, 2018 - 2027F |
6.3 United States (US) Phthalic anhydride Market, By End-users |
6.3.1 Overview and Analysis |
6.3.2 United States (US) Phthalic anhydride Market Revenues & Volume, By Automotive & Transportation, 2018 - 2027F |
6.3.3 United States (US) Phthalic anhydride Market Revenues & Volume, By Building & Construction, 2018 - 2027F |
6.3.4 United States (US) Phthalic anhydride Market Revenues & Volume, By Paints & Coatings, 2018 - 2027F |
6.3.5 United States (US) Phthalic anhydride Market Revenues & Volume, By Marine, 2018 - 2027F |
6.3.6 United States (US) Phthalic anhydride Market Revenues & Volume, By Electrical & Electronics, 2018 - 2027F |
6.3.7 United States (US) Phthalic anhydride Market Revenues & Volume, By Plastics, 2018 - 2027F |
6.3.8 United States (US) Phthalic anhydride Market Revenues & Volume, By Others, 2018 - 2027F |
6.3.9 United States (US) Phthalic anhydride Market Revenues & Volume, By Others, 2018 - 2027F |
7 United States (US) Phthalic anhydride Market Import-Export Trade Statistics |
7.1 United States (US) Phthalic anhydride Market Export to Major Countries |
7.2 United States (US) Phthalic anhydride Market Imports from Major Countries |
8 United States (US) Phthalic anhydride Market Key Performance Indicators |
8.1 Capacity utilization rate of phthalic anhydride production facilities |
8.2 Number of new applications developed using phthalic anhydride |
8.3 Investment in research and development for phthalic anhydride alternatives |
9 United States (US) Phthalic anhydride Market - Opportunity Assessment |
9.1 United States (US) Phthalic anhydride Market Opportunity Assessment, By Process Type, 2021 & 2027F |
9.2 United States (US) Phthalic anhydride Market Opportunity Assessment, By Applications, 2021 & 2027F |
9.3 United States (US) Phthalic anhydride Market Opportunity Assessment, By End-users, 2021 & 2027F |
10 United States (US) Phthalic anhydride Market - Competitive Landscape |
10.1 United States (US) Phthalic anhydride Market Revenue Share, By Companies, 2021 |
10.2 United States (US) Phthalic anhydride Market Competitive Benchmarking, By Operating and Technical Parameters |
11 Company Profiles |
12 Recommendations |
13 Disclaimer |
Global Go To Market Strategy - 2030
Export potential enables firms to identify high-growth global markets with greater confidence by combining advanced trade intelligence with a structured quantitative methodology. The framework analyzes emerging demand trends and country-level import patterns while integrating macroeconomic and trade datasets such as GDP and population forecasts, bilateral import–export flows, tariff structures, elasticity differentials between developed and developing economies, geographic distance, and import demand projections. Using weighted trade values from 2020–2024 as the base period to project country-to-country export potential for 2030, these inputs are operationalized through calculated drivers such as gravity model parameters, tariff impact factors, and projected GDP per-capita growth. Through an analysis of hidden potentials, demand hotspots, and market conditions that are most favorable to success, this method enables firms to focus on target countries, maximize returns, and global expansion with data, backed by accuracy.
By factoring in the projected importer demand gap that is currently unmet and could be potential opportunity, it identifies the potential for the Exporter (Country) among 190 countries, against the general trade analysis, which identifies the biggest importer or exporter.
To discover high-growth global markets and optimize your business strategy:
Click Here
Pricing
- Single User License$ 1,995
- Department License$ 2,400
- Site License$ 3,120
- Global License$ 3,795

Leadership Perspectives from Industry Events
Search
Thought Leadership and Analyst Meet


Our Clients
6WResearch In News
- India Air Conditioner Market Set for Strong Rebound in 2026 After Weather-Led Correction and GST-Driven Recovery: 6Wresearch
- ADAS in India: How Automatic Emergency Braking, Blind Spot Detection & Driver Monitoring are Transforming Road Safety
- Doha a strategic location for EV manufacturing hub: IPA Qatar
- Demand for luxury TVs surging in the GCC, says Samsung
- Empowering Growth: The Thriving Journey of Bangladesh’s Cable Industry
- Demand for luxury TVs surging in the GCC, says Samsung
Latest Reports
- Nicaragua RPG Gaming Market (2026-2032)
- New Zealand RPG Gaming Market (2026-2032)
- Netherlands RPG Gaming Market (2026-2032)
- Nauru RPG Gaming Market (2026-2032)
- Namibia RPG Gaming Market (2026-2032)
- Mozambique RPG Gaming Market (2026-2032)
- Montenegro RPG Gaming Market (2026-2032)
- Mongolia RPG Gaming Market (2026-2032)
- Monaco RPG Gaming Market (2026-2032)
- Micronesia RPG Gaming Market (2026-2032)
Industry Events and Analyst Meet

EV India Expo 2026

HIMTEX 2026

India Refining Summit 2026

India EV Show 2026

EV tech India Expo 2026
Whitepaper
- Middle East & Africa Commercial Security Market Click here to view more.
- Middle East & Africa Fire Safety Systems & Equipment Market Click here to view more.
- GCC Drone Market Click here to view more.
- Middle East Lighting Fixture Market Click here to view more.
- GCC Physical & Perimeter Security Market Click here to view more.