United States (US) Physical Security Market Size & Growth Rate (2026-2032)
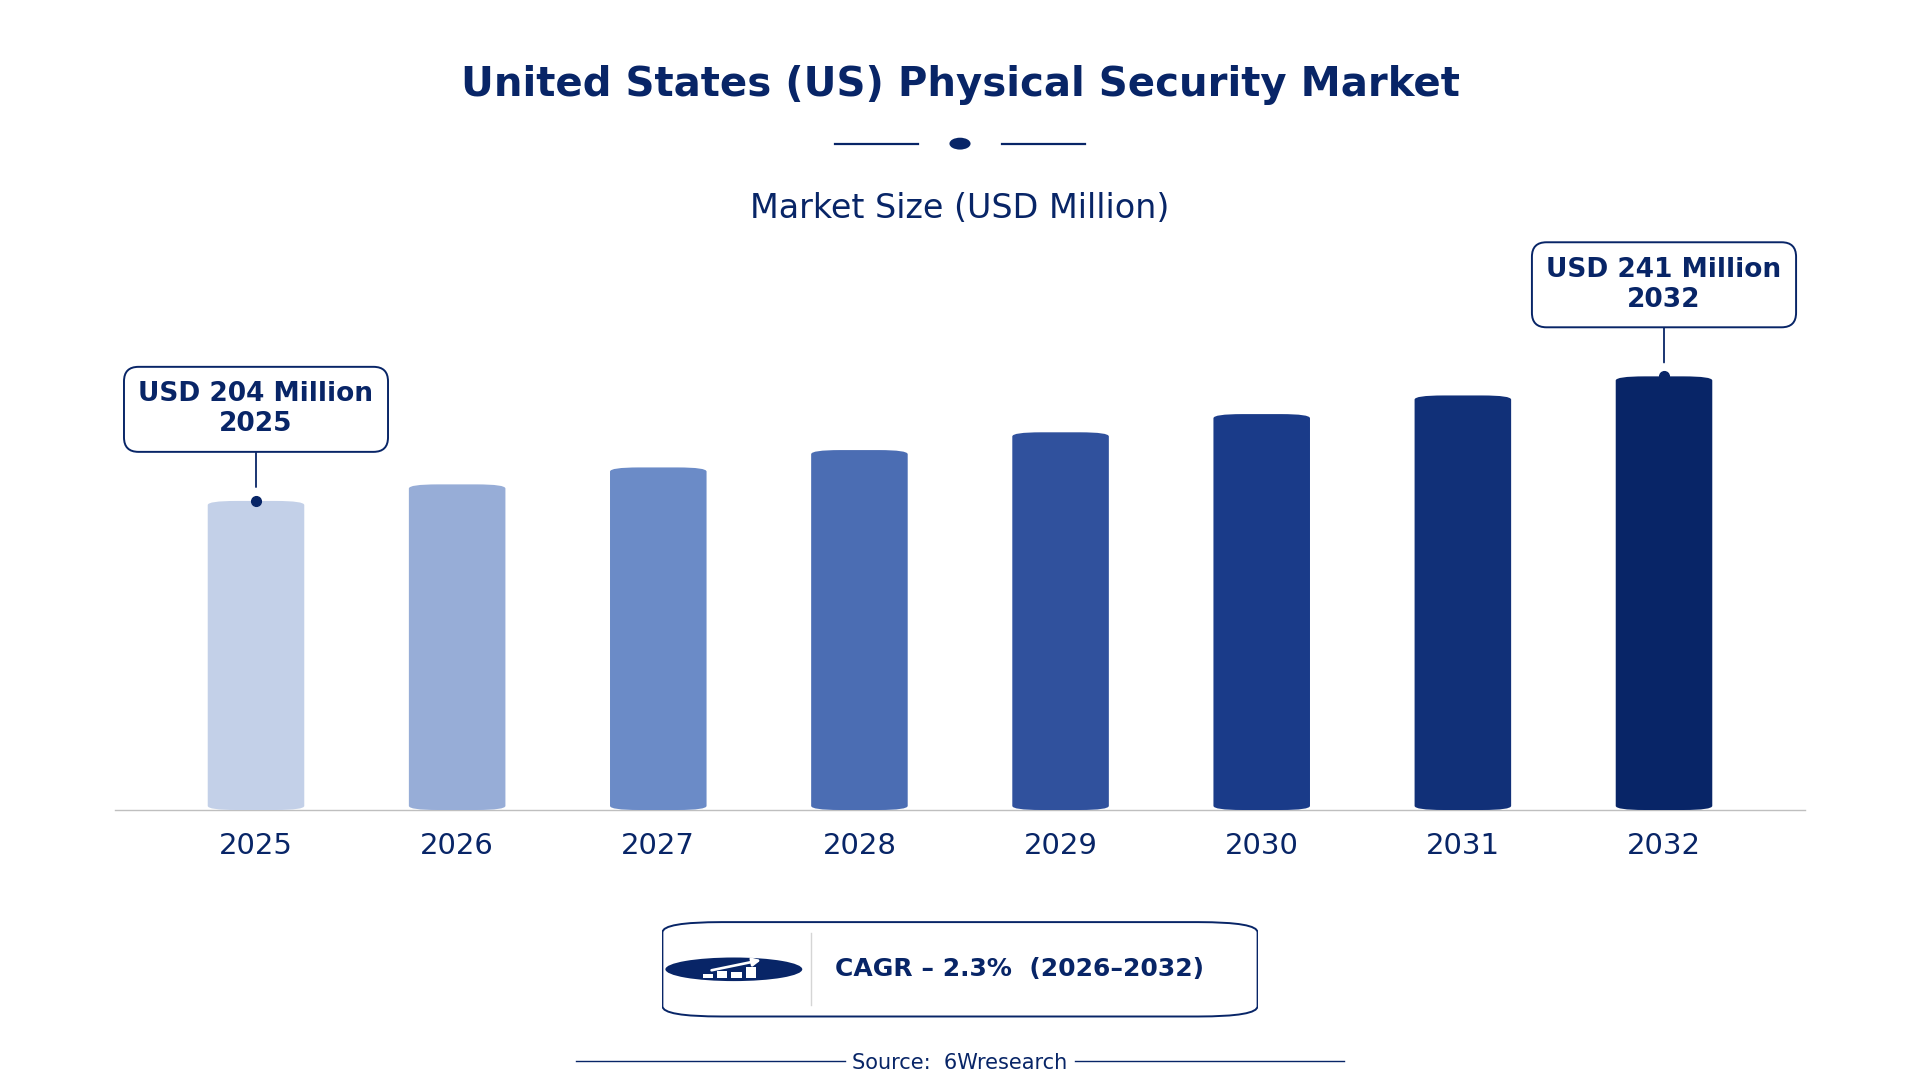
The United States (US) Physical Security Market was estimated at USD 204 Million in 2025 and is projected to reach USD 241 Million by 2032, growing at a CAGR of 2.3% from 2026 to 2032.
United States (US) Physical Security Market Synopsis
The US Physical Security Market is currently shaped by heightened security concerns across various sectors, driven by an uptick in crime rates and the pervasive threat of terrorism. This market is not merely reacting; it’s evolving with advanced technologies that aim to protect vital infrastructures, ranging from government facilities to private enterprises.
As businesses and public sectors adapt to these threats, the demand for sophisticated solutions is climbing. Integrated systems combining access control, video surveillance, and intrusion detection are becoming the norm rather than the exception. Notably, the push for smart technologies is transforming traditional security models into more proactive and efficient frameworks.
United States (US) Physical Security Market Year-wise Growth Rate and Key Drivers
This graph illustrates the annual growth rates of the United States (US) Physical Security Market from 2021 to 2032, highlighting a steady upward trajectory and projected expansion over the forecast period.
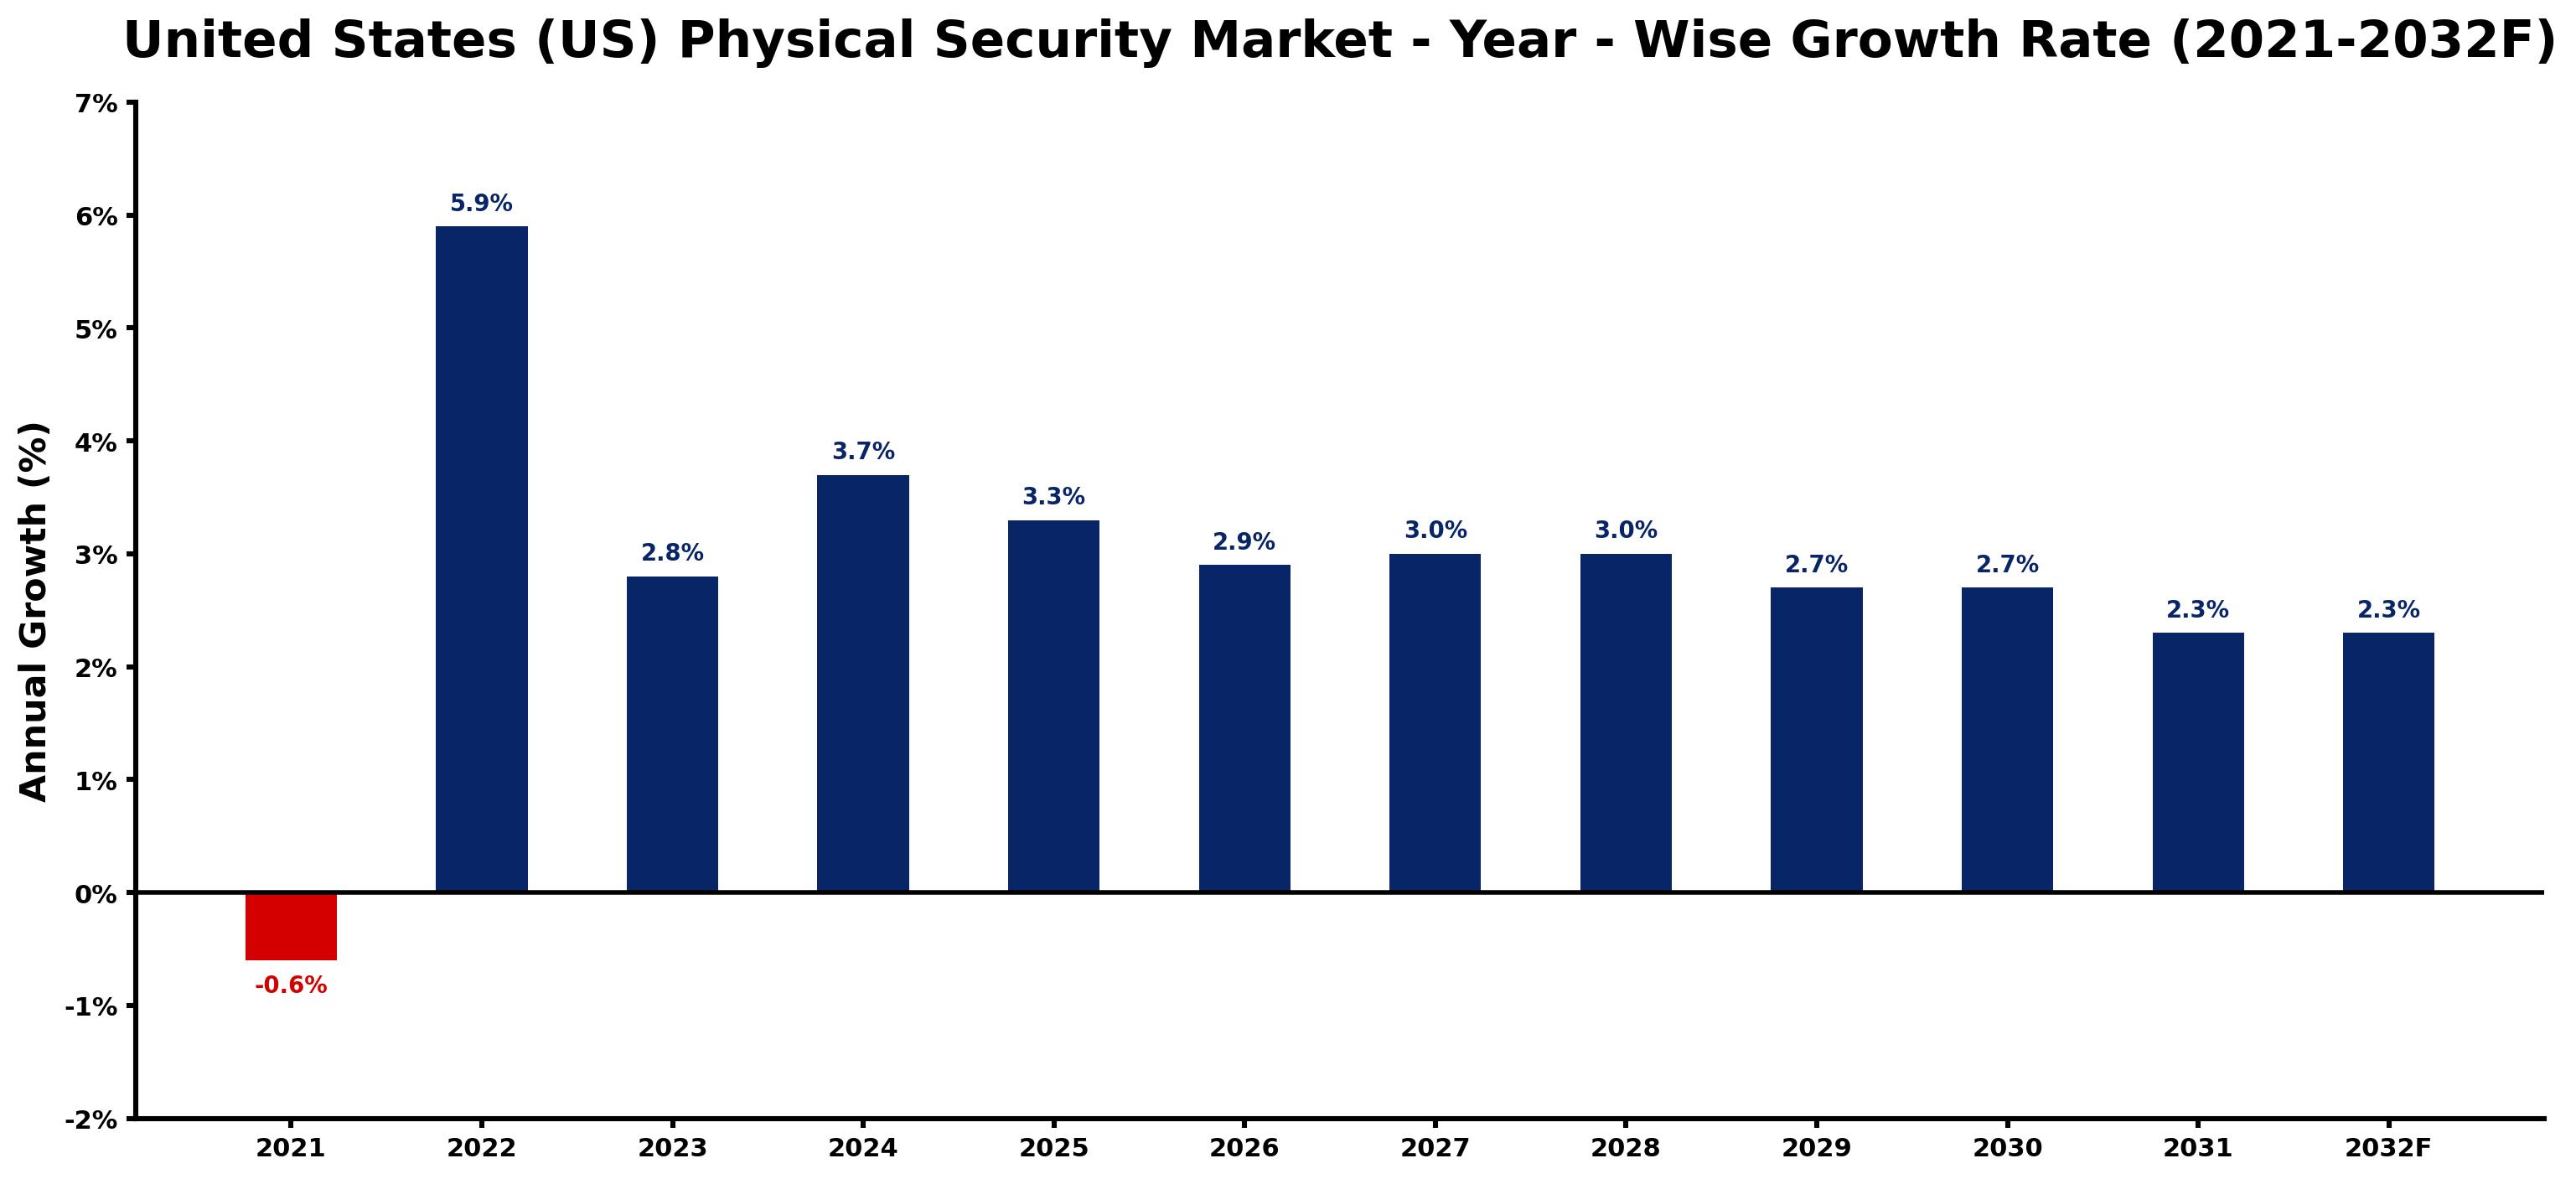
The table below presents the year‑wise growth rates along with the key drivers influencing the market
| Year | Growth Rate | Major Drivers |
| 2021 | -0.6% | Economic recovery delay post-COVID-19 pandemic in USA. |
| 2022 | 5.9% | Rising urban crime rates boosting security system demand. |
| 2023 | 2.8% | Implementation of stricter surveillance regulations by local governments. |
| 2024 | 3.7% | Increased residential security investments driven by homeownership trends. |
| 2025 | 3.3% | Growing commercial real estate development necessitating enhanced security. |
| 2026 | 2.9% | Adoption of biometric access controls in corporate facilities. |
| 2027 | 3.0% | Collaborations between tech firms and security providers improving solutions. |
| 2028 | 3.0% | Escalating demand for integrated smart home security technologies. |
| 2029 | 2.7% | Regulatory changes promoting public safety technology innovations. |
| 2030 | 2.7% | Rise in federal grants supporting community safety initiatives. |
| 2031 | 2.3% | Increased awareness of cybersecurity threats affecting physical security. |
| 2032 | 2.3% | Growth in event security due to high-profile public events. |
Note: Market size estimations and growth projections presented in this report are based on 6Wresearch's proprietary forecasting methodology, utilizing the latest available industry data, government publications, and primary research inputs.
United States (US) Physical Security Market Key Takeaways
Below are some of the specific key takeaways from the market, including:
- The market is projected to grow steadily, driven by an increased focus on safety in both public and private sectors.
- Emerging technologies like AI and cloud solutions are enhancing existing physical security measures.
- Cybersecurity integration within physical security systems is becoming increasingly critical.
- There’s a noticeable shift towards mobile access control and remote management capabilities.
- Investment opportunities are flourishing in advanced video surveillance and perimeter security solutions.
Evaluation of Restraints in United States (US) Physical Security Market
Despite the promising outlook, the US Physical Security Market faces real hurdles. The rapid pace of technology development means that companies must constantly innovate or risk falling behind. The blurring lines between physical and cybersecurity introduce vulnerabilities that must be managed effectively. As regulations evolve, compliance can become an expensive and complex process, which may deter smaller players from fully entering the market. These factors collectively limit the market's growth potential, pushing established players to enhance their offerings while being cautious of emerging threats and regulatory changes.
United States (US) Physical Security Market Trends
The trends shaping the US Physical Security Market are indicative of a shift toward integrated, technology-driven solutions. A primary trend is the adoption of artificial intelligence and video analytics, which enhance the efficacy of surveillance systems by enabling predictive capabilities. As organizations grow increasingly interconnected, there is a surge in demand for integrated security solutions that not only protect physical assets but also safeguard data. on top of that, mobile access control and remote monitoring are becoming essential for flexibility, allowing for real-time oversight without the constraints of traditional security systems. Finally, the increasing focus on cybersecurity emphasizes the importance of securing networks alongside physical premises.
United States (US) Physical Security Market Opportunities
Investment opportunities in the US Physical Security Market are abundant, particularly in technologies like advanced video surveillance and access control systems. The growing concern for safety across sectors such as government, healthcare, and retail fuels demand for innovative security solutions. Companies developing cutting-edge technologies, particularly in AI and cloud-based platforms, stand to benefit immensely. The shift towards integrated solutions offers another avenue for investment, with firms that can provide comprehensive security frameworks likely to attract attention. The market’s evolution toward smart technologies signals a ripe opportunity for stakeholders willing to engage in this fast-paced sector.
Government Initiatives in the United States (US) Physical Security Market
Government initiatives play a crucial role in shaping the US Physical Security Market by establishing regulations and promoting public safety. As the government prioritizes infrastructure protection, numerous programs are designed to enhance security measures across the country. These initiatives aim to not only safeguard physical assets but also to bolster the cybersecurity frameworks that protect them from evolving threats.
- A recently completed initiative under the Federal Information Security Management Act (FISMA) focused on enhancing cybersecurity measures across federal agencies.
- Current programs led by the Department of Homeland Security (DHS) are aimed at fortifying critical infrastructure against physical threats, emphasizing compliance with updated security standards.
- A planned public-private initiative seeks to expand the integration of smart technologies into existing physical security systems, slated to begin rollout in 2027.
- The National Institute of Standards and Technology (NIST) is currently updating guidelines to address the convergence of physical and cybersecurity protocols.
- A recently introduced regulatory framework mandates that telecommunications equipment used in critical infrastructure must meet stringent security criteria, ensuring network resilience.
Future Insights of the United States (US) Physical Security Market
Looking ahead to 2026-2032, the US Physical Security Market is set for notable expansion. Companies will increasingly harness advanced technologies, such as AI-driven analytics and cloud solutions, to create more effective security measures. The continued rise in threats will compel organizations to invest in robust security systems that blend physical and cyber defenses. Integration is the name of the game; businesses will gravitate towards solutions that offer cohesive protection across multiple layers. As a result, the emphasis on innovation will drive growth, making the market more dynamic and interconnected than ever before.
United States (US) Physical Security Market Latest Developments
The last year has seen a flurry of activity within the US Physical Security Market, reflecting its ongoing evolution and response to emerging threats. Companies are focusing on integrating advanced technologies while refining their existing offerings to meet the growing demands of security in a complex environment. This activity includes a mix of product rollouts, strategic partnerships, and enhanced service capabilities.
- A major technology vendor launched an advanced video surveillance system that incorporates AI for real-time threat detection, unveiled in Q1 2025.
- An initiative that began in mid-2025 is focusing on upgrading perimeter security solutions across urban areas, aimed at reducing crime rates.
- A significant partnership between two leading firms was announced in early 2025 to create integrated security solutions combining access control and cybersecurity measures.
- A rollout of cloud-based access control systems is expected to begin in late 2025, catering to businesses seeking flexible security options.
- By mid-2026, a new program aimed at training personnel in cybersecurity measures for physical security systems is set to launch.
United States (US) Physical Security Market - Key Attractiveness of the Report
- 10 Years of Market Numbers
- Historical Data Starting from 2022 to 2025
- Base Year: 2025
- Forecast Data until 2032
- Key Performance Indicators Impacting the Market
- Major Upcoming Developments and Projects
Key Highlights of the Report:
- United States (US) Physical Security Market Outlook
- Market Size of United States (US) Physical Security Market, 2025
- Forecast of United States (US) Physical Security Market, 2032
- Historical Data and Forecast of United States (US) Physical Security Revenues & Volume for the Period 2022-2032F
- United States (US) Physical Security Market Trend Evolution
- United States (US) Physical Security Market Drivers and Challenges
- United States (US) Physical Security Price Trends
- United States (US) Physical Security Porter's Five Forces
- United States (US) Physical Security Industry Life Cycle
- Historical Data and Forecast of United States (US) Physical Security Market Revenues & Volume By Component for the Period 2022-2032F
- Historical Data and Forecast of United States (US) Physical Security Market Revenues & Volume By Systems (PACS, PSIM, PIAM, Video Surveillance, Fire and Life Safety) for the Period 2022-2032F
- Historical Data and Forecast of United States (US) Physical Security Market Revenues & Volume By Services for the Period 2022-2032F
- Historical Data and Forecast of United States (US) Physical Security Market Revenues & Volume By Vertical for the Period 2022-2032F
- Historical Data and Forecast of United States (US) Physical Security Market Revenues & Volume By BFSI for the Period 2022-2032F
- Historical Data and Forecast of United States (US) Physical Security Market Revenues & Volume By Government for the Period 2022-2032F
- Historical Data and Forecast of United States (US) Physical Security Market Revenues & Volume By Retail for the Period 2022-2032F
- Historical Data and Forecast of United States (US) Physical Security Market Revenues & Volume By Transportation for the Period 2022-2032F
- Historical Data and Forecast of United States (US) Physical Security Market Revenues & Volume By Residential for the Period 2022-2032F
- Historical Data and Forecast of United States (US) Physical Security Market Revenues & Volume By Telecom and IT for the Period 2022-2032F
- Historical Data and Forecast of United States (US) Physical Security Market Revenues & Volume By Other Verticals (Healthcare, Manufacturing, Energy and Utilities, and Education). for the Period 2022-2032F
- Historical Data and Forecast of United States (US) Physical Security Market Revenues & Volume By Organization Size for the Period 2022-2032F
- Historical Data and Forecast of United States (US) Physical Security Market Revenues & Volume By SMEs for the Period 2022-2032F
- Historical Data and Forecast of United States (US) Physical Security Market Revenues & Volume By Large Enterprises for the Period 2022-2032F
- United States (US) Physical Security Import Export Trade Statistics
- Market Opportunity Assessment By Component
- Market Opportunity Assessment By Vertical
- Market Opportunity Assessment By Organization Size
- United States (US) Physical Security Top Companies Market Share
- United States (US) Physical Security Competitive Benchmarking By Technical and Operational Parameters
- United States (US) Physical Security Company Profiles
- United States (US) Physical Security Key Strategic Recommendations






































