United States (US) Ruthenium Market (2026-2032) Outlook | Size, Growth, Value, Forecast, Trends, Companies, Share, Revenue, Analysis & Industry
Market Forecast By Product (Mineral Source, Recycling Source), By Application (Electricals and Electronics, Catalyst, Jewelry, Chemical Manufacturing, Others), By Form (Liquid, Dry/Powder, Gas) And Competitive Landscape
| Product Code: ETC201493 | Publication Date: May 2022 | Updated Date: Jul 2026 | Product Type: Market Research Report | |
| Publisher: 6Wresearch | Author: Ravi Bhandari | No. of Pages: 60 | No. of Figures: 40 | No. of Tables: 7 |
United States (US) Ruthenium Market Size, Share & Growth Rate
The United States (US) Ruthenium Market was estimated at USD 125 Million in 2025 and is projected to reach USD 147 Million by 2032, growing at a CAGR of 2.3% from 2026 to 2032. This growth trajectory is primarily fueled by the rising demand for ruthenium in industries such as electronics, automotive, and chemical manufacturing, where its unique properties play a critical role. Additionally, the increasing focus on sustainable technologies and applications in fuel cells and renewable energy sectors is expected to further drive market dynamics.
United States (US) Ruthenium Market Year-wise Growth Rate and Key Drivers
This graph highlights how the United States (US) Ruthenium Market has steadily grown over the years, supported by major growth factors.
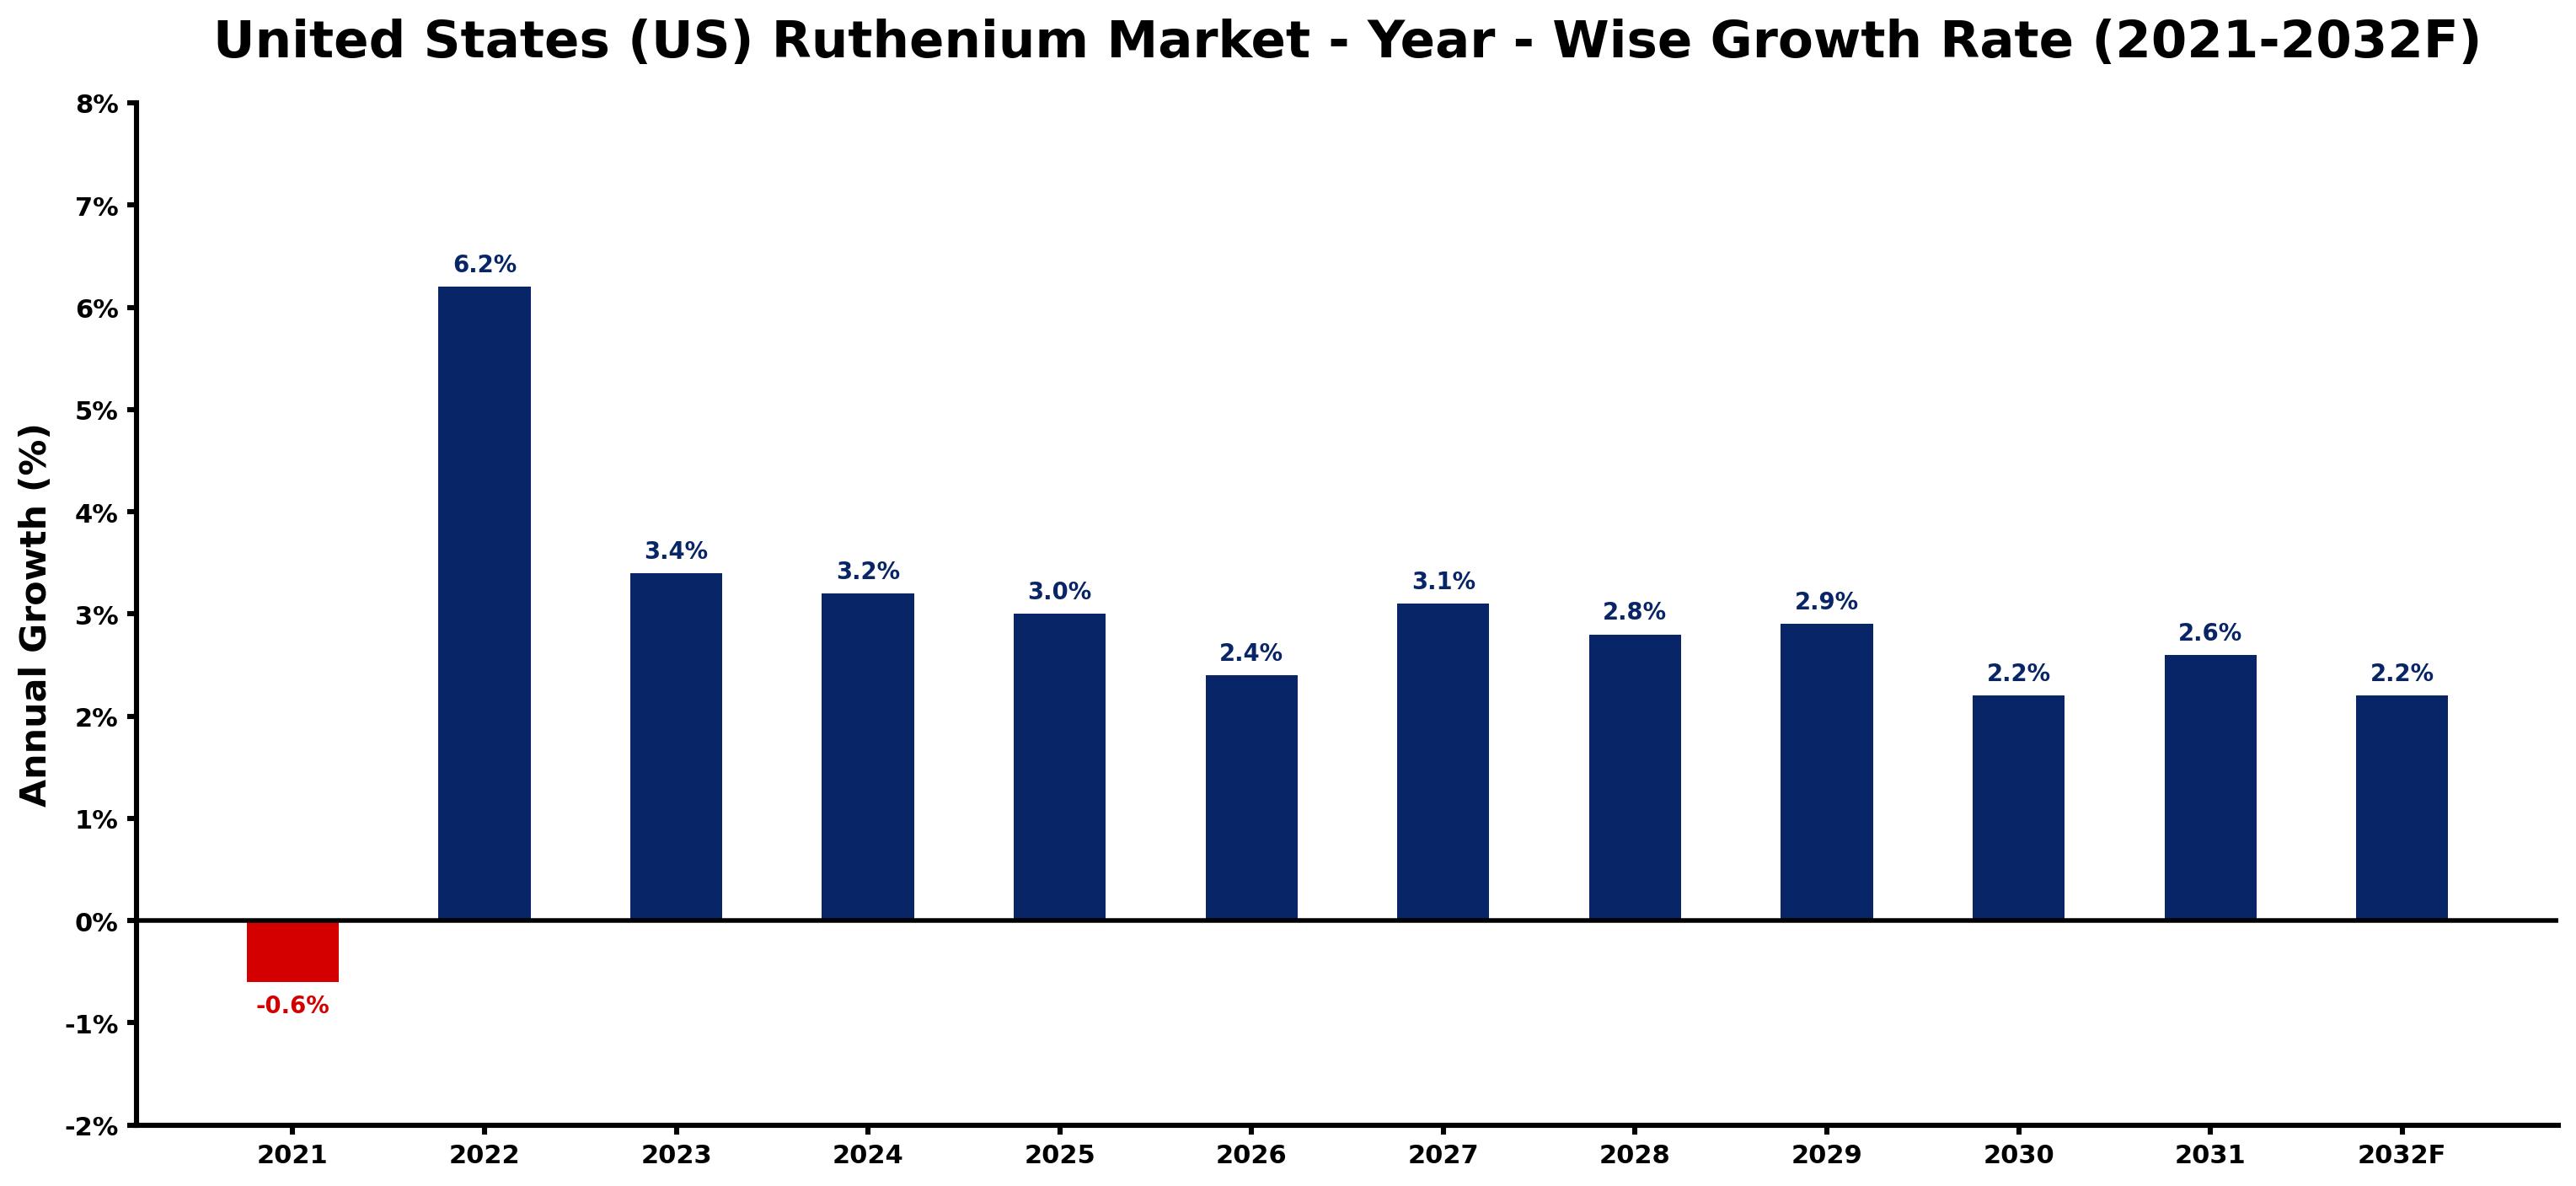
The table below presents the year‑wise growth rates along with the key drivers influencing the market
| Year | Growth Rate | Major Drivers |
| 2021 | -0.6% | Decreased investment in technology sectors |
| 2022 | 6.2% | Increased demand from electronics industry |
| 2023 | 3.4% | Growth in renewable energy applications |
| 2024 | 3.2% | Expansion of catalyst manufacturing processes |
| 2025 | 3.0% | Rise in semiconductor production needs |
| 2026 | 2.4% | Enhancement of aerospace materials usage |
| 2027 | 3.1% | Surge in medical device innovation |
| 2028 | 2.8% | rising procurement volume requirements |
| 2029 | 2.9% | Increased focus on sustainable technologies |
| 2030 | 2.2% | increased production capacity utilization |
| 2031 | 2.6% | strengthening international trade flows |
| 2032 | 2.2% | growing regional consumption patterns |
Note: Market size estimations and growth projections presented in this report are based on 6Wresearch's proprietary forecasting methodology, utilizing the latest available industry data, government publications, and primary research inputs.
United States (US) Ruthenium Market Synopsis
Ruthenium's use in catalysts for ammonia production is a significant demand driver in the US, given its essential role in the global chemical manufacturing landscape. Furthermore, the metals properties make it ideal for electrical contacts in high-temperature devices, highlighting its diverse applications and consistent demand across various sectors.
Despite its potential, the US market faces challenges related to supply chain disruptions stemming from global production dynamics, as most ruthenium is obtained as a byproduct of platinum and nickel mining. These factors contribute to price volatility, making it imperative for stakeholders to strategically navigate market fluctuations.
United States (US) Ruthenium Market Key Takeaways
- The market is driven by increasing demand in electronics, automotive, and chemical manufacturing.
- Ruthenium's growing role in sustainable technologies presents new opportunities for market expansion.
- Price volatility and supply chain disruptions are key concerns for industry stakeholders.
- Research and development activities are paving the way for innovative applications of ruthenium.
- Investment opportunities exist in emerging sectors such as energy storage and hydrogen production.
Evaluation of Restraints in United States (US) Ruthenium Market
One of the primary restraints in the US Ruthenium market is the limited availability of this rare metal. The intricacies of ruthenium mining create supply constraints, contributing to the market's volatility. Additionally, geopolitical factors and trade policies can complicate import and export dynamics, further exacerbating supply issues. The specialized knowledge required for its applications can also limit market entry for new players, creating challenges in adapting to evolving demand.
United States (US) Ruthenium Market Trends
The current trends in the US Ruthenium market reflect a pronounced shift toward sustainability. As industries prioritize greener alternatives, ruthenium's applications in fuel cells are gaining traction. Furthermore, technological advancements are driving innovations in ruthenium-based applications, enhancing efficiency and performance across sectors. This focus on research and development indicates a burgeoning interest in exploring untapped applications of ruthenium.
United States (US) Ruthenium Market Opportunities
The outlook for investment in the US Ruthenium market is promising, driven by the metal's critical role in advanced technologies. Areas such as catalytic converters in electric vehicles and innovative energy storage solutions offer significant growth potential. Stakeholders can leverage the increasing adoption of renewable energy systems to capitalize on new opportunities and diversify their portfolios amidst limited global supply.
Government Initiatives in the United States (US) Ruthenium Market
While there are no specific government policies targeting the Ruthenium market, regulatory measures through the US Department of Commerce and the US International Trade Commission influence trade practices. Additionally, the Environmental Protection Agency (EPA) enforces environmental regulations that may affect ruthenium mining and processing, ensuring compliance with national standards. Overall, government actions focus on maintaining a fair trade environment rather than on direct support for the ruthenium sector.
Future Insights of the United States (US) Ruthenium Market
Looking ahead to 2026-2032, the United States Ruthenium Market is poised for notable growth as demand escalates across various industries. The shift toward electric vehicles and renewable energy sources will likely enhance the metal's application in catalytic converters and electrolysis processes. With ongoing advancements in technology and growing research initiatives, the market is expected to evolve significantly, creating new pathways for industry innovation and expansion.
United States (US) Ruthenium Market Latest Developments (2025 - 2026)
Recent developments in the US Ruthenium market indicate a heightened focus on sustainability and innovative applications. Companies are investing in research to enhance rutheniums role in clean energy solutions, particularly in hydrogen production and energy storage systems. These efforts reflect a broader industry trend towards adopting greener technologies that align with market needs and environmental objectives, shaping the future trajectory of the ruthenium sector.
United States (US) Ruthenium Market - Key Attractiveness of the Report
- 10 Years of Market Numbers
- Historical Data Starting from 2022 to 2025
- Base Year: 2025
- Forecast Data until 2032
- Key Performance Indicators Impacting the Market
- Major Upcoming Developments and Projects
Key Highlights of the Report:
- United States (US) Ruthenium Market Outlook
- Market Size of United States (US) Ruthenium Market, 2025
- Forecast of United States (US) Ruthenium Market, 2032
- Historical Data and Forecast of United States (US) Ruthenium Revenues & Volume for the Period 2022-2032F
- United States (US) Ruthenium Market Trend Evolution
- United States (US) Ruthenium Market Drivers and Challenges
- United States (US) Ruthenium Price Trends
- United States (US) Ruthenium Porter's Five Forces
- United States (US) Ruthenium Industry Life Cycle
- Historical Data and Forecast of United States (US) Ruthenium Market Revenues & Volume By Product for the Period 2022-2032F
- Historical Data and Forecast of United States (US) Ruthenium Market Revenues & Volume By Mineral Source for the Period 2022-2032F
- Historical Data and Forecast of United States (US) Ruthenium Market Revenues & Volume By Recycling Source for the Period 2022-2032F
- Historical Data and Forecast of United States (US) Ruthenium Market Revenues & Volume By Application for the Period 2022-2032F
- Historical Data and Forecast of United States (US) Ruthenium Market Revenues & Volume By Electricals and Electronics for the Period 2022-2032F
- Historical Data and Forecast of United States (US) Ruthenium Market Revenues & Volume By Catalyst for the Period 2022-2032F
- Historical Data and Forecast of United States (US) Ruthenium Market Revenues & Volume By Jewelry for the Period 2022-2032F
- Historical Data and Forecast of United States (US) Ruthenium Market Revenues & Volume By Chemical Manufacturing for the Period 2022-2032F
- Historical Data and Forecast of United States (US) Ruthenium Market Revenues & Volume By Others for the Period 2022-2032F
- Historical Data and Forecast of United States (US) Ruthenium Market Revenues & Volume By Form for the Period 2022-2032F
- Historical Data and Forecast of United States (US) Ruthenium Market Revenues & Volume By Liquid for the Period 2022-2032F
- Historical Data and Forecast of United States (US) Ruthenium Market Revenues & Volume By Dry/Powder for the Period 2022-2032F
- Historical Data and Forecast of United States (US) Ruthenium Market Revenues & Volume By Gas for the Period 2022-2032F
- United States (US) Ruthenium Import Export Trade Statistics
- Market Opportunity Assessment By Product
- Market Opportunity Assessment By Application
- Market Opportunity Assessment By Form
- United States (US) Ruthenium Top Companies Market Share
- United States (US) Ruthenium Competitive Benchmarking By Technical and Operational Parameters
- United States (US) Ruthenium Company Profiles
- United States (US) Ruthenium Key Strategic Recommendations
Frequently Asked Questions About the Market Study (FAQs):
The US Ruthenium market is primarily driven by increasing applications in electronics, automotive, and chemical manufacturing. Its unique properties make it essential for catalysts, electrical contacts, and advanced technologies.
The United States Ruthenium Market was estimated at USD 125 Million in 2025 and is projected to reach USD 147 Million by 2032, growing at a CAGR of 2.3% from 2026 to 2032. This growth is driven by expanding industrial applications and emerging technologies.
Emerging sectors like renewable energy, particularly in fuel cells and hydrogen production, are contributing significantly to the growth in Ruthenium demand, alongside traditional industries.
The major challenges include supply chain constraints due to limited mining activities and the geopolitical landscape affecting trade. These factors can lead to price fluctuations and impact availability.
While there are no specific policies targeting Ruthenium, US regulations on trade and environmental standards play a role in shaping the market dynamics and influencing operational practices.
6Wresearch actively monitors the United States (US) Ruthenium Market and publishes its comprehensive annual report, highlighting emerging trends, growth drivers, revenue analysis, and forecast outlook. Our insights help businesses to make data-backed strategic decisions with ongoing market dynamics. Our analysts track relevent industries related to the United States (US) Ruthenium Market, allowing our clients with actionable intelligence and reliable forecasts tailored to emerging regional needs.
Yes, we provide customisation as per your requirements. To learn more, feel free to contact us on sales@6wresearch.com
1 Executive Summary |
2 Introduction |
2.1 Key Highlights of the Report |
2.2 Report Description |
2.3 Market Scope & Segmentation |
2.4 Research Methodology |
2.5 Assumptions |
3 United States (US) Ruthenium Market Overview |
3.1 United States (US) Country Macro Economic Indicators |
3.2 United States (US) Ruthenium Market Revenues & Volume, 2022 & 2032F |
3.3 United States (US) Ruthenium Market - Industry Life Cycle |
3.4 United States (US) Ruthenium Market - Porter's Five Forces |
3.5 United States (US) Ruthenium Market Revenues & Volume Share, By Product, 2022 & 2032F |
3.6 United States (US) Ruthenium Market Revenues & Volume Share, By Application, 2022 & 2032F |
3.7 United States (US) Ruthenium Market Revenues & Volume Share, By Form, 2022 & 2032F |
4 United States (US) Ruthenium Market Dynamics |
4.1 Impact Analysis |
4.2 Market Drivers |
4.2.1 Growth in the electronics industry, as ruthenium is used in electronic components such as resistors and capacitors. |
4.2.2 Increasing demand for catalysts in the chemical industry, where ruthenium is used for its catalytic properties. |
4.2.3 Research and development activities focusing on new applications of ruthenium in industries like healthcare and renewable energy. |
4.3 Market Restraints |
4.3.1 Volatility in ruthenium prices due to its limited global production and geopolitical factors. |
4.3.2 Environmental concerns related to ruthenium mining and refining processes. |
4.3.3 Competition from alternative materials and technologies in end-user industries. |
5 United States (US) Ruthenium Market Trends |
6 United States (US) Ruthenium Market, By Types |
6.1 United States (US) Ruthenium Market, By Product |
6.1.1 Overview and Analysis |
6.1.2 United States (US) Ruthenium Market Revenues & Volume, By Product, 2022-2032F |
6.1.3 United States (US) Ruthenium Market Revenues & Volume, By Mineral Source, 2022-2032F |
6.1.4 United States (US) Ruthenium Market Revenues & Volume, By Recycling Source, 2022-2032F |
6.2 United States (US) Ruthenium Market, By Application |
6.2.1 Overview and Analysis |
6.2.2 United States (US) Ruthenium Market Revenues & Volume, By Electricals and Electronics, 2022-2032F |
6.2.3 United States (US) Ruthenium Market Revenues & Volume, By Catalyst, 2022-2032F |
6.2.4 United States (US) Ruthenium Market Revenues & Volume, By Jewelry, 2022-2032F |
6.2.5 United States (US) Ruthenium Market Revenues & Volume, By Chemical Manufacturing, 2022-2032F |
6.2.6 United States (US) Ruthenium Market Revenues & Volume, By Others, 2022-2032F |
6.3 United States (US) Ruthenium Market, By Form |
6.3.1 Overview and Analysis |
6.3.2 United States (US) Ruthenium Market Revenues & Volume, By Liquid, 2022-2032F |
6.3.3 United States (US) Ruthenium Market Revenues & Volume, By Dry/Powder, 2022-2032F |
6.3.4 United States (US) Ruthenium Market Revenues & Volume, By Gas, 2022-2032F |
7 United States (US) Ruthenium Market Import-Export Trade Statistics |
7.1 United States (US) Ruthenium Market Export to Major Countries |
7.2 United States (US) Ruthenium Market Imports from Major Countries |
8 United States (US) Ruthenium Market Key Performance Indicators |
8.1 Research and development investment in ruthenium-based technologies. |
8.2 Number of patents filed for new ruthenium applications. |
8.3 Percentage of electronic manufacturers using ruthenium in their products. |
8.4 Adoption rate of ruthenium catalysts in the chemical industry. |
8.5 Environmental impact assessments and initiatives in the ruthenium supply chain. |
9 United States (US) Ruthenium Market - Opportunity Assessment |
9.1 United States (US) Ruthenium Market Opportunity Assessment, By Product, 2022 & 2032F |
9.2 United States (US) Ruthenium Market Opportunity Assessment, By Application, 2022 & 2032F |
9.3 United States (US) Ruthenium Market Opportunity Assessment, By Form, 2022 & 2032F |
10 United States (US) Ruthenium Market - Competitive Landscape |
10.1 United States (US) Ruthenium Market Revenue Share, By Companies, 2025 |
10.2 United States (US) Ruthenium Market Competitive Benchmarking, By Operating and Technical Parameters |
11 Company Profiles |
12 Recommendations |
13 Disclaimer |
Global Go To Market Strategy - 2030
Export potential enables firms to identify high-growth global markets with greater confidence by combining advanced trade intelligence with a structured quantitative methodology. The framework analyzes emerging demand trends and country-level import patterns while integrating macroeconomic and trade datasets such as GDP and population forecasts, bilateral import–export flows, tariff structures, elasticity differentials between developed and developing economies, geographic distance, and import demand projections. Using weighted trade values from 2020–2024 as the base period to project country-to-country export potential for 2030, these inputs are operationalized through calculated drivers such as gravity model parameters, tariff impact factors, and projected GDP per-capita growth. Through an analysis of hidden potentials, demand hotspots, and market conditions that are most favorable to success, this method enables firms to focus on target countries, maximize returns, and global expansion with data, backed by accuracy.
By factoring in the projected importer demand gap that is currently unmet and could be potential opportunity, it identifies the potential for the Exporter (Country) among 190 countries, against the general trade analysis, which identifies the biggest importer or exporter.
To discover high-growth global markets and optimize your business strategy:
Click Here
Pricing
- Single User License$ 1,995
- Department License$ 2,400
- Site License$ 3,120
- Global License$ 3,795

Leadership Perspectives from Industry Events
Search
Thought Leadership and Analyst Meet


Our Clients
6WResearch In News
- India Air Conditioner Market Set for Strong Rebound in 2026 After Weather-Led Correction and GST-Driven Recovery: 6Wresearch
- ADAS in India: How Automatic Emergency Braking, Blind Spot Detection & Driver Monitoring are Transforming Road Safety
- Doha a strategic location for EV manufacturing hub: IPA Qatar
- Demand for luxury TVs surging in the GCC, says Samsung
- Empowering Growth: The Thriving Journey of Bangladesh’s Cable Industry
- Demand for luxury TVs surging in the GCC, says Samsung
Latest Reports
- Nicaragua RPG Gaming Market (2026-2032)
- New Zealand RPG Gaming Market (2026-2032)
- Netherlands RPG Gaming Market (2026-2032)
- Nauru RPG Gaming Market (2026-2032)
- Namibia RPG Gaming Market (2026-2032)
- Mozambique RPG Gaming Market (2026-2032)
- Montenegro RPG Gaming Market (2026-2032)
- Mongolia RPG Gaming Market (2026-2032)
- Monaco RPG Gaming Market (2026-2032)
- Micronesia RPG Gaming Market (2026-2032)
Industry Events and Analyst Meet

EV India Expo 2026

HIMTEX 2026

India Refining Summit 2026

India EV Show 2026

EV tech India Expo 2026
Whitepaper
- Middle East & Africa Commercial Security Market Click here to view more.
- Middle East & Africa Fire Safety Systems & Equipment Market Click here to view more.
- GCC Drone Market Click here to view more.
- Middle East Lighting Fixture Market Click here to view more.
- GCC Physical & Perimeter Security Market Click here to view more.