United States (US) Smart Stadium Market (2026-2032) Outlook | Analysis, Revenue, Companies, Growth, Trends, Size, Forecast, Share, Value & Industry
Market Forecast By Component (Software, Service), By Deployment Type (On-Premise, Software-as-a-Service), By Platform (Application Management Platform, Device Management Platform, Network Management Platform) And Competitive Landscape
| Product Code: ETC106040 | Publication Date: Jun 2021 | Updated Date: Jun 2026 | Product Type: Report | |
| Publisher: 6Wresearch | Author: Summon Dutta | No. of Pages: 70 | No. of Figures: 35 | No. of Tables: 5 |
United States (US) Smart Stadium Market Size, Share & Growth Rate
The United States (US) Smart Stadium Market was estimated at USD 189 Million in 2025 and is projected to reach USD 248 Million by 2032, growing at a CAGR of 4.0% from 2026 to 2032. This growth trajectory is being driven by the rising expectation of fans for personalized and immersive experiences, as well as the ongoing push for operational efficiency among venue operators. Stadiums are increasingly integrating sophisticated technologies to not only enhance the spectator experience but also streamline venue management.
United States (US) Smart Stadium Market Year-wise Growth Rate and Key Drivers
This graph highlights how the United States (US) Smart Stadium Market has steadily grown over the years, supported by major growth factors.
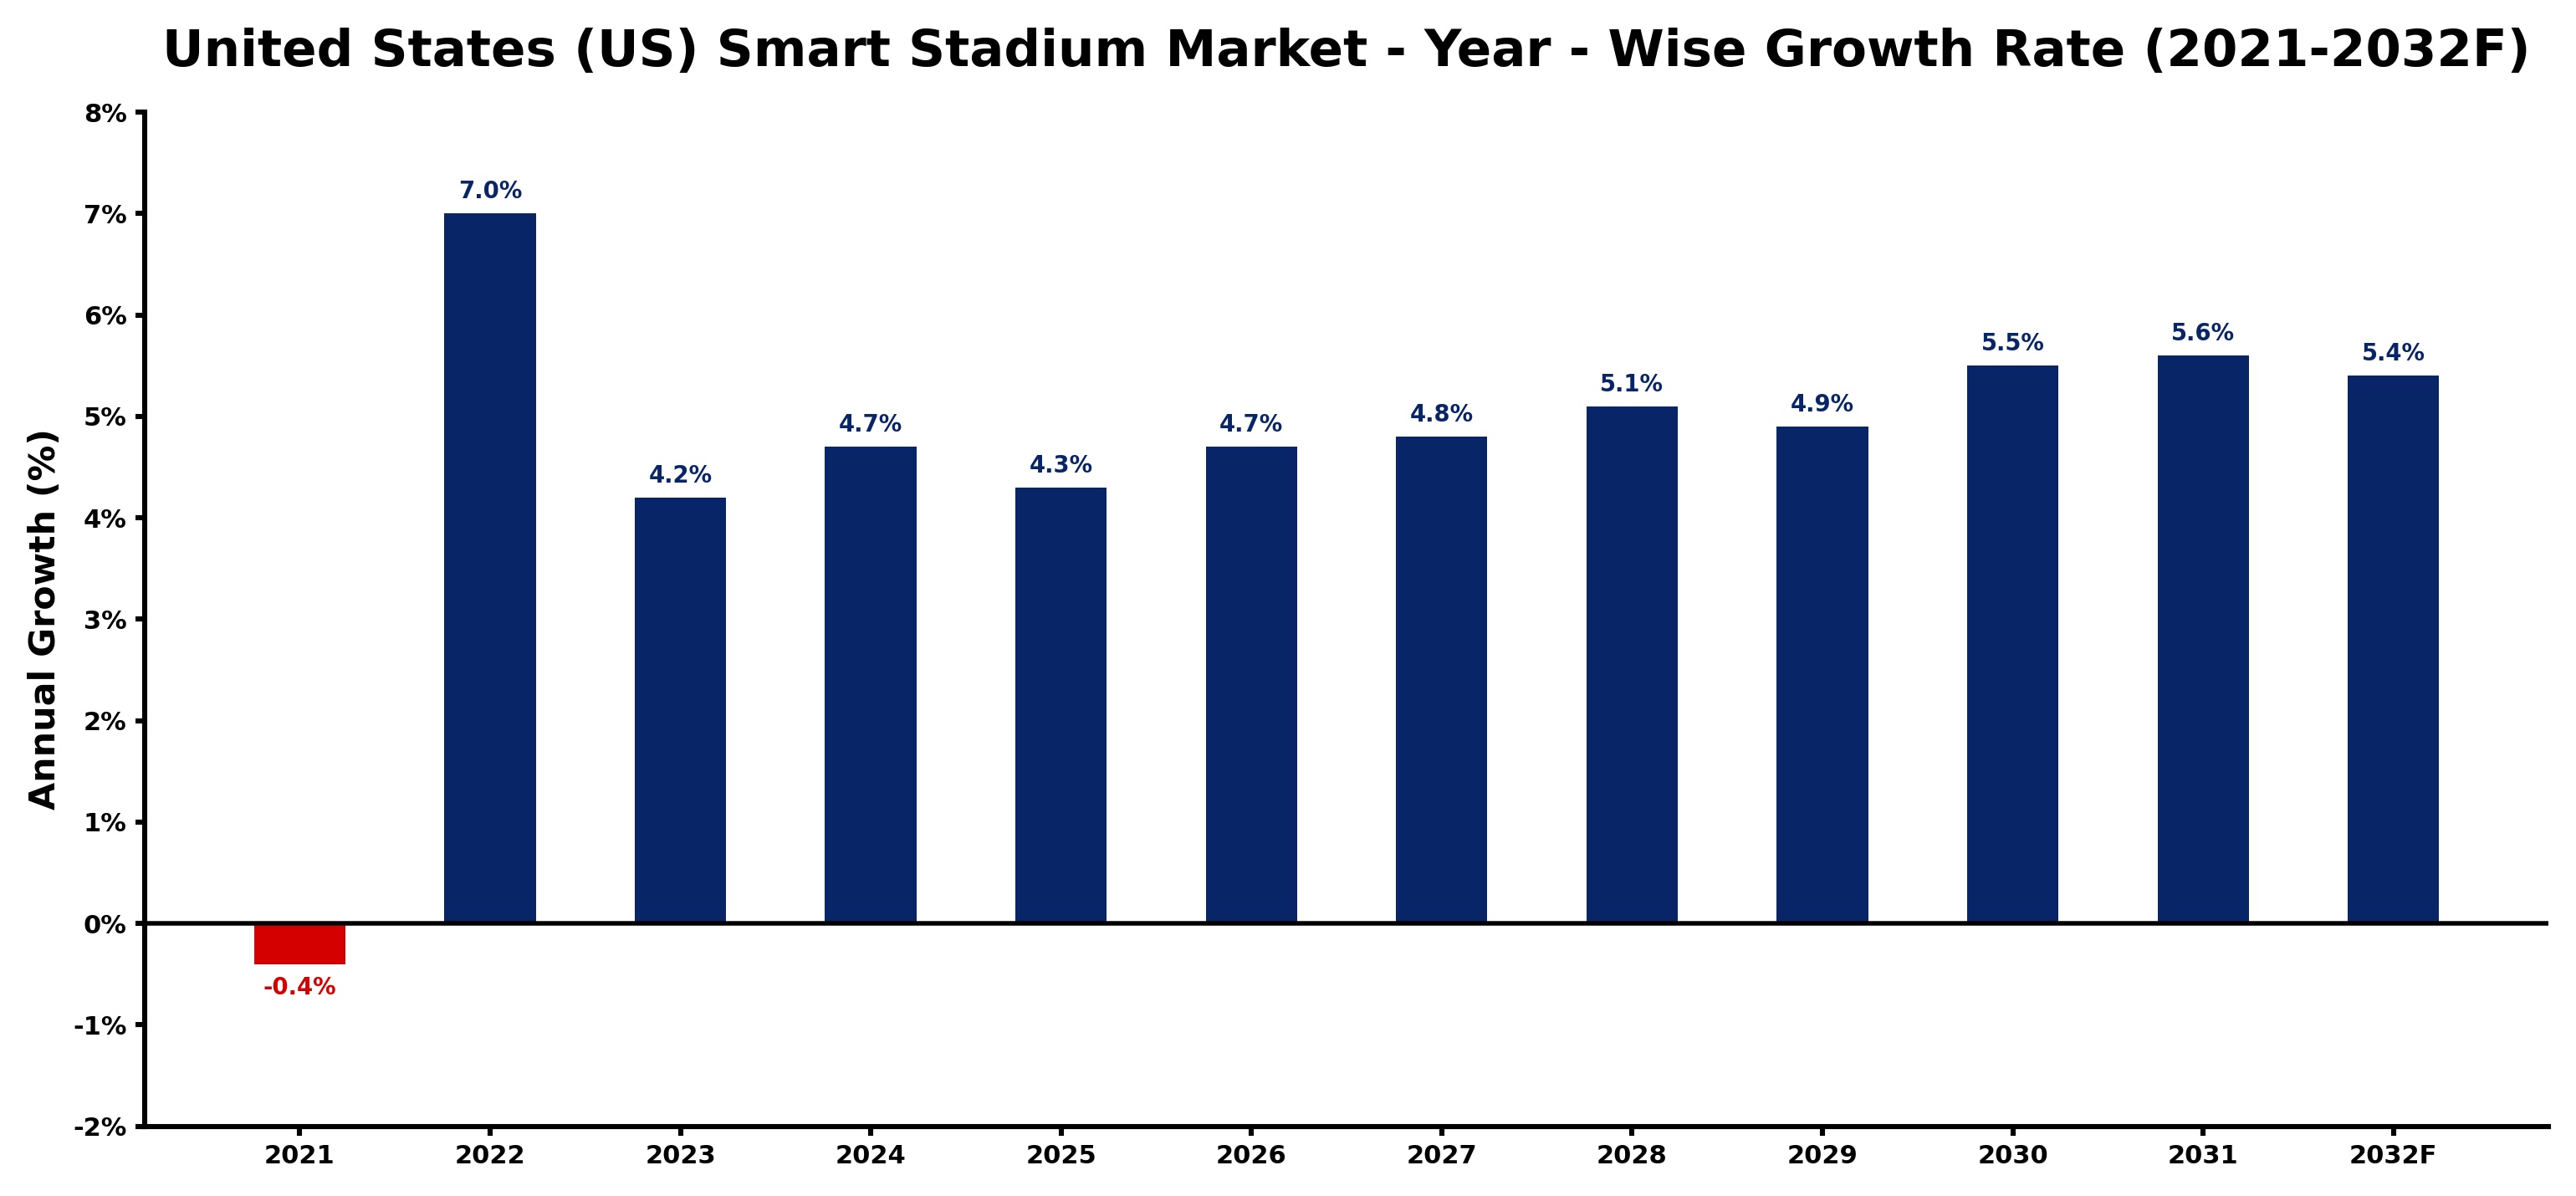
The table below presents the year‑wise growth rates along with the key drivers influencing the market
| Year | Growth Rate | Major Drivers |
| 2021 | -0.4% | Rising electricity demand across industries |
| 2022 | 7.0% | Growing renewable energy integration projects |
| 2023 | 4.2% | Rapid growth in telecom and data center sectors |
| 2024 | 4.7% | Increasing industrial infrastructure investments |
| 2025 | 4.3% | Rapid growth in telecom and data center sectors |
| 2026 | 4.7% | Increasing smart city development projects |
| 2027 | 4.8% | Rapid growth in telecom and data center sectors |
| 2028 | 5.1% | Rapid growth in telecom and data center sectors |
| 2029 | 4.9% | Increasing industrial automation investments |
| 2030 | 5.5% | Increasing adoption of advanced technologies |
| 2031 | 5.6% | Expansion of manufacturing activities |
| 2032 | 5.4% | Increasing industrial automation investments |
Note - Market size estimations and growth projections presented in this report are based on 6Wresearch’s advanced forecasting approach, validated with industry datasets as of June 2026.
United States (US) Smart Stadium Market Synopsis
The emergence of mobile applications facilitating ticketing and concessions has become a vital component in the United States Smart Stadium Market. Fans are now able to engage with their favorite venues in real-time, significantly improving their experience while reducing wait times and enhancing operational efficiency.
Additionally, advanced security measures powered by AI and IoT technologies are fostering a safer environment for attendees, which is becoming a non-negotiable requirement in the current landscape. As a result, stakeholders are motivated to invest in smart solutions that cater to both fan engagement and security needs.
United States (US) Smart Stadium Market Key Takeaways
- Fan engagement is increasingly prioritized through interactive technologies and personalized experiences.
- The market is bolstered by significant investments in AI, IoT, and data analytics technologies.
- Emerging concerns over data privacy and security are prompting innovative solutions in stadium management.
- 5G connectivity is enhancing the operational capabilities of smart stadiums, supporting seamless connectivity.
- Stadium operators are focusing on sustainable practices to align with environmental initiatives.
Evaluation of Restraints in United States (US) Smart Stadium Market
Despite the promising prospects, the United States Smart Stadium Market faces notable constraints that could hinder its growth. High initial investments required for smart technology deployment can deter stadium operators from making the leap. Furthermore, concerns about data privacy and security pose significant challenges, necessitating robust safeguards to protect sensitive information. The complexity of integrating various systems can also slow down the adoption process. As the pace of technological advancement quickens, maintaining a skilled workforce capable of managing these sophisticated systems is increasingly crucial for stakeholders.
United States (US) Smart Stadium Market Trends
Several key trends are currently shaping the United States Smart Stadium Market. The integration of advanced technologies such as IoT, artificial intelligence, and augmented reality is revolutionizing the spectator experience, paving the way for interactivity and engagement like never before. Moreover, a commitment to sustainability has prompted venues to explore eco-friendly designs and renewable energy sources, enhancing their appeal to environmentally conscious fans.
The rollout of 5G technology has further accelerated these advancements, offering faster, more reliable connectivity that enhances fan engagement and operational efficiency. Overall, these trends signal a shift toward smarter, more sustainable, and customer-centric stadium experiences.
United States (US) Smart Stadium Market Opportunities
The United States Smart Stadium Market presents multiple avenues for growth and investment. There is a burgeoning demand for technologies that enhance fan engagement, such as immersive AR/VR experiences and personalized digital interactions. Investors can capitalize on opportunities in developing advanced infrastructure solutions, innovative fan engagement platforms, and data-driven operational strategies that optimize revenue generation.
Collaborative ventures with sports leagues and event organizers can also pave the way for market penetration and expansion, as they seek to embrace new technological advancements. Overall, the potential for growth in this sector is vast, attracting investors looking to blend sports, technology, and enhanced fan experiences.
Government Initiatives in the United States (US) Smart Stadium Market
Government policies in the United States are increasingly oriented toward fostering innovation and technology adoption in the Smart Stadium Market. These initiatives often involve tax incentives aimed at supporting investments in smart stadium infrastructure and enhancing the overall fan experience. Collaborative partnerships between public and private sectors are being encouraged to implement cutting-edge solutions, while regulatory frameworks are emerging to address data privacy and security concerns. Additionally, there is a significant focus on promoting sustainability initiatives to minimize the environmental impact of stadium designs and operations.
Future Insights of the United States (US) Smart Stadium Market
Looking ahead, the United States Smart Stadium Market is on an upward trajectory, with substantial growth expected between 2026 and 2032. The drive for enhanced fan experiences and operational efficiencies will continue to shape investments in advanced technologies. As stadiums adapt to meet the changing preferences of modern fans, features such as high-speed connectivity, in-seat ordering, and comprehensive digital interfaces will become standard. With a focus on sustainable practices and innovative tech integration, the market is set to redefine the landscape of sports and entertainment venues.
United States (US) Smart Stadium Market Latest Developments (May 2025 - June 2026)
In the latest developments within the United States Smart Stadium Market, venues are increasingly adopting smart technologies to enhance visitor experiences. Ongoing upgrades to connectivity infrastructure are enabling a more robust interaction between fans and stadium services, further encouraged by the integration of 5G. Additionally, stadium operators are placing a renewed focus on environmentally sustainable practices, looking to leverage innovative materials and renewable energy sources in their designs. These initiatives reflect a broader industry shift toward more responsible and tech-savvy stadium operations.
United States (US) Smart Stadium Market - Key Attractiveness of the Report
- 10 Years of Market Numbers
- Historical Data Starting from 2022 to 2025
- Base Year: 2025
- Forecast Data until 2032
- Key Performance Indicators Impacting the Market
- Major Upcoming Developments and Projects
Key Highlights of the Report:
- United States (US) Smart Stadium Market Outlook
- Market Size of United States (US) Smart Stadium Market, 2025
- Forecast of United States (US) Smart Stadium Market, 2032
- Historical Data and Forecast of United States (US) Smart Stadium Revenues & Volume for the Period 2022-2032F
- United States (US) Smart Stadium Market Trend Evolution
- United States (US) Smart Stadium Market Drivers and Challenges
- United States (US) Smart Stadium Price Trends
- United States (US) Smart Stadium Porter's Five Forces
- United States (US) Smart Stadium Industry Life Cycle
- Historical Data and Forecast of United States (US) Smart Stadium Market Revenues & Volume By Component for the Period 2022-2032F
- Historical Data and Forecast of United States (US) Smart Stadium Market Revenues & Volume By Software for the Period 2022-2032F
- Historical Data and Forecast of United States (US) Smart Stadium Market Revenues & Volume By Service for the Period 2022-2032F
- Historical Data and Forecast of United States (US) Smart Stadium Market Revenues & Volume By Deployment Type for the Period 2022-2032F
- Historical Data and Forecast of United States (US) Smart Stadium Market Revenues & Volume By On-Premise for the Period 2022-2032F
- Historical Data and Forecast of United States (US) Smart Stadium Market Revenues & Volume By Software-as-a-Service for the Period 2022-2032F
- Historical Data and Forecast of United States (US) Smart Stadium Market Revenues & Volume By Platform for the Period 2022-2032F
- Historical Data and Forecast of United States (US) Smart Stadium Market Revenues & Volume By Application Management Platform for the Period 2022-2032F
- Historical Data and Forecast of United States (US) Smart Stadium Market Revenues & Volume By Device Management Platform for the Period 2022-2032F
- Historical Data and Forecast of United States (US) Smart Stadium Market Revenues & Volume By Network Management Platform for the Period 2022-2032F
- United States (US) Smart Stadium Import Export Trade Statistics
- Market Opportunity Assessment By Component
- Market Opportunity Assessment By Deployment Type
- Market Opportunity Assessment By Platform
- United States (US) Smart Stadium Top Companies Market Share
- United States (US) Smart Stadium Competitive Benchmarking By Technical and Operational Parameters
- United States (US) Smart Stadium Company Profiles
- United States (US) Smart Stadium Key Strategic Recommendations
United States (US) Smart Stadium Market - Frequently Asked Questions
The growth is primarily fueled by increasing fan expectations for personalized experiences and operational efficiencies sought by venue operators, alongside advancements in technology.
The market was estimated at USD 189 Million in 2025 and is projected to reach USD 248 Million by 2032, growing at a CAGR of 4.0% from 2026 to 2032.
Technologies like IoT, AI, and 5G connectivity are at the forefront, enhancing fan engagement and optimizing operational efficiencies.
Venues are increasingly incorporating renewable energy sources and eco-friendly materials in their designs to align with growing environmental concerns.
Government policies promote innovation and technology adoption, offering incentives for investment in smart stadium infrastructure and addressing data privacy and sustainability concerns.
Key challenges include high initial investment costs, data privacy concerns, complexity of system integration, and the need for skilled personnel to manage these advanced technologies.
6Wresearch actively monitors the United States (US) Smart Stadium Market and publishes its comprehensive annual report, highlighting emerging trends, growth drivers, revenue analysis, and forecast outlook. Our insights help businesses to make data-backed strategic decisions with ongoing market dynamics. Our analysts track relevent industries related to the United States (US) Smart Stadium Market, allowing our clients with actionable intelligence and reliable forecasts tailored to emerging regional needs.
Yes, we provide customisation as per your requirements. To learn more, feel free to contact us on sales@6wresearch.com
1 Executive Summary |
2 Introduction |
2.1 Key Highlights of the Report |
2.2 Report Description |
2.3 Market Scope & Segmentation |
2.4 Research Methodology |
2.5 Assumptions |
3 United States (US) Smart Stadium Market Overview |
3.1 United States (US) Country Macro Economic Indicators |
3.2 United States (US) Smart Stadium Market Revenues & Volume, 2022 & 2032F |
3.3 United States (US) Smart Stadium Market - Industry Life Cycle |
3.4 United States (US) Smart Stadium Market - Porter's Five Forces |
3.5 United States (US) Smart Stadium Market Revenues & Volume Share, By Component, 2022 & 2032F |
3.6 United States (US) Smart Stadium Market Revenues & Volume Share, By Deployment Type, 2022 & 2032F |
3.7 United States (US) Smart Stadium Market Revenues & Volume Share, By Platform, 2022 & 2032F |
4 United States (US) Smart Stadium Market Dynamics |
4.1 Impact Analysis |
4.2 Market Drivers |
4.2.1 Increasing demand for enhanced fan engagement and experience in sports events |
4.2.2 Growing adoption of IoT and connected technologies in stadium infrastructure |
4.2.3 Rising focus on energy efficiency and sustainability in stadium operations |
4.3 Market Restraints |
4.3.1 High initial investment costs for implementing smart stadium solutions |
4.3.2 Concerns regarding data security and privacy in smart stadium environments |
5 United States (US) Smart Stadium Market Trends |
6 United States (US) Smart Stadium Market, By Types |
6.1 United States (US) Smart Stadium Market, By Component |
6.1.1 Overview and Analysis |
6.1.2 United States (US) Smart Stadium Market Revenues & Volume, By Component, 2022-2032F |
6.1.3 United States (US) Smart Stadium Market Revenues & Volume, By Software, 2022-2032F |
6.1.4 United States (US) Smart Stadium Market Revenues & Volume, By Service, 2022-2032F |
6.2 United States (US) Smart Stadium Market, By Deployment Type |
6.2.1 Overview and Analysis |
6.2.2 United States (US) Smart Stadium Market Revenues & Volume, By On-Premise, 2022-2032F |
6.2.3 United States (US) Smart Stadium Market Revenues & Volume, By Software-as-a-Service, 2022-2032F |
6.3 United States (US) Smart Stadium Market, By Platform |
6.3.1 Overview and Analysis |
6.3.2 United States (US) Smart Stadium Market Revenues & Volume, By Application Management Platform, 2022-2032F |
6.3.3 United States (US) Smart Stadium Market Revenues & Volume, By Device Management Platform, 2022-2032F |
6.3.4 United States (US) Smart Stadium Market Revenues & Volume, By Network Management Platform, 2022-2032F |
7 United States (US) Smart Stadium Market Import-Export Trade Statistics |
7.1 United States (US) Smart Stadium Market Export to Major Countries |
7.2 United States (US) Smart Stadium Market Imports from Major Countries |
8 United States (US) Smart Stadium Market Key Performance Indicators |
8.1 Average time spent by fans on smart stadium mobile apps |
8.2 Percentage increase in revenue from smart stadium technology partnerships |
8.3 Reduction in energy consumption and carbon footprint of smart stadiums |
9 United States (US) Smart Stadium Market - Opportunity Assessment |
9.1 United States (US) Smart Stadium Market Opportunity Assessment, By Component, 2022 & 2032F |
9.2 United States (US) Smart Stadium Market Opportunity Assessment, By Deployment Type, 2022 & 2032F |
9.3 United States (US) Smart Stadium Market Opportunity Assessment, By Platform, 2022 & 2032F |
10 United States (US) Smart Stadium Market - Competitive Landscape |
10.1 United States (US) Smart Stadium Market Revenue Share, By Companies, 2025 |
10.2 United States (US) Smart Stadium Market Competitive Benchmarking, By Operating and Technical Parameters |
11 Company Profiles |
12 Recommendations |
13 Disclaimer |
Global Go To Market Strategy - 2030
Export potential enables firms to identify high-growth global markets with greater confidence by combining advanced trade intelligence with a structured quantitative methodology. The framework analyzes emerging demand trends and country-level import patterns while integrating macroeconomic and trade datasets such as GDP and population forecasts, bilateral import–export flows, tariff structures, elasticity differentials between developed and developing economies, geographic distance, and import demand projections. Using weighted trade values from 2020–2024 as the base period to project country-to-country export potential for 2030, these inputs are operationalized through calculated drivers such as gravity model parameters, tariff impact factors, and projected GDP per-capita growth. Through an analysis of hidden potentials, demand hotspots, and market conditions that are most favorable to success, this method enables firms to focus on target countries, maximize returns, and global expansion with data, backed by accuracy.
By factoring in the projected importer demand gap that is currently unmet and could be potential opportunity, it identifies the potential for the Exporter (Country) among 190 countries, against the general trade analysis, which identifies the biggest importer or exporter.
To discover high-growth global markets and optimize your business strategy:
Click Here
Pricing
- Single User License$ 1,995
- Department License$ 2,400
- Site License$ 3,120
- Global License$ 3,795

Leadership Perspectives from Industry Events
Search
Thought Leadership and Analyst Meet


Our Clients
6WResearch In News
- India Air Conditioner Market Set for Strong Rebound in 2026 After Weather-Led Correction and GST-Driven Recovery: 6Wresearch
- ADAS in India: How Automatic Emergency Braking, Blind Spot Detection & Driver Monitoring are Transforming Road Safety
- Doha a strategic location for EV manufacturing hub: IPA Qatar
- Demand for luxury TVs surging in the GCC, says Samsung
- Empowering Growth: The Thriving Journey of Bangladesh’s Cable Industry
- Demand for luxury TVs surging in the GCC, says Samsung
Latest Reports
- Nicaragua RPG Gaming Market (2026-2032)
- New Zealand RPG Gaming Market (2026-2032)
- Netherlands RPG Gaming Market (2026-2032)
- Nauru RPG Gaming Market (2026-2032)
- Namibia RPG Gaming Market (2026-2032)
- Mozambique RPG Gaming Market (2026-2032)
- Montenegro RPG Gaming Market (2026-2032)
- Mongolia RPG Gaming Market (2026-2032)
- Monaco RPG Gaming Market (2026-2032)
- Micronesia RPG Gaming Market (2026-2032)
Industry Events and Analyst Meet

EV India Expo 2026

HIMTEX 2026

India Refining Summit 2026

India EV Show 2026

EV tech India Expo 2026
Whitepaper
- Middle East & Africa Commercial Security Market Click here to view more.
- Middle East & Africa Fire Safety Systems & Equipment Market Click here to view more.
- GCC Drone Market Click here to view more.
- Middle East Lighting Fixture Market Click here to view more.
- GCC Physical & Perimeter Security Market Click here to view more.