Venezuela Non Alcoholic Beverages Market (2026-2032) Outlook | Industry, Growth, Size, Companies, Share, Value, Trends, Analysis, Revenue & Forecast
Market Forecast By Type (Alcoholic Beverages, Non-Alcoholic Beverages, Bottled Water, Carbonated Soft Drinks, Fruit Juice, Milk), By Packaging Type (Cartons, Cans, Bottles, Others), By Distribution Channel (Online, Offline, Supermarkets, Departmental Stores, Specialty Stores) And Competitive Landscape
| Product Code: ETC189079 | Publication Date: May 2022 | Updated Date: Jun 2026 | Product Type: Market Research Report | |
| Publisher: 6Wresearch | Author: Vasudha | No. of Pages: 60 | No. of Figures: 40 | No. of Tables: 7 |
Venezuela Non Alcoholic Beverages Market Size, Share & Growth Rate
The Venezuela Non Alcoholic Beverages Market was estimated at USD 491 Million in 2025 and is projected to reach USD 837 Million by 2032, growing at a CAGR of 7.9% from 2026 to 2032. This promising trajectory is largely driven by shifting consumer preferences toward healthier beverage options and a growing urban population. Additionally, an increasing awareness of functional drinks is prompting both local and international producers to innovate their product offerings, suggesting a strong potential for market expansion.
Venezuela Non Alcoholic Beverages Market Growth Rate Analysis (2021-2032)
The Venezuelan non-alcoholic beverages market is experiencing robust growth, with a yearly increase projected at 7.1% in 2021, rising to 11.5% by 2032. This upward trend is driven by a combination of heightened consumer demand for healthier options and innovative product offerings, particularly in response to shifting health consciousness among the population. Additionally, investments in local manufacturing infrastructure and advancements in distribution technology have bolstered supply chains, facilitating greater market accessibility. The gradual stabilization of the economy, along with government policy favoring local beverage production, has further fueled this expansion. As a result, the market’s growth is expected to accelerate, reaching a notable 10.7% by 2030.
Venezuela Non Alcoholic Beverages Market Year-wise Growth Rate and Key Drivers
This graph highlights how the Venezuela Non Alcoholic Beverages Market has steadily grown over the past five years, supported by major growth factors.
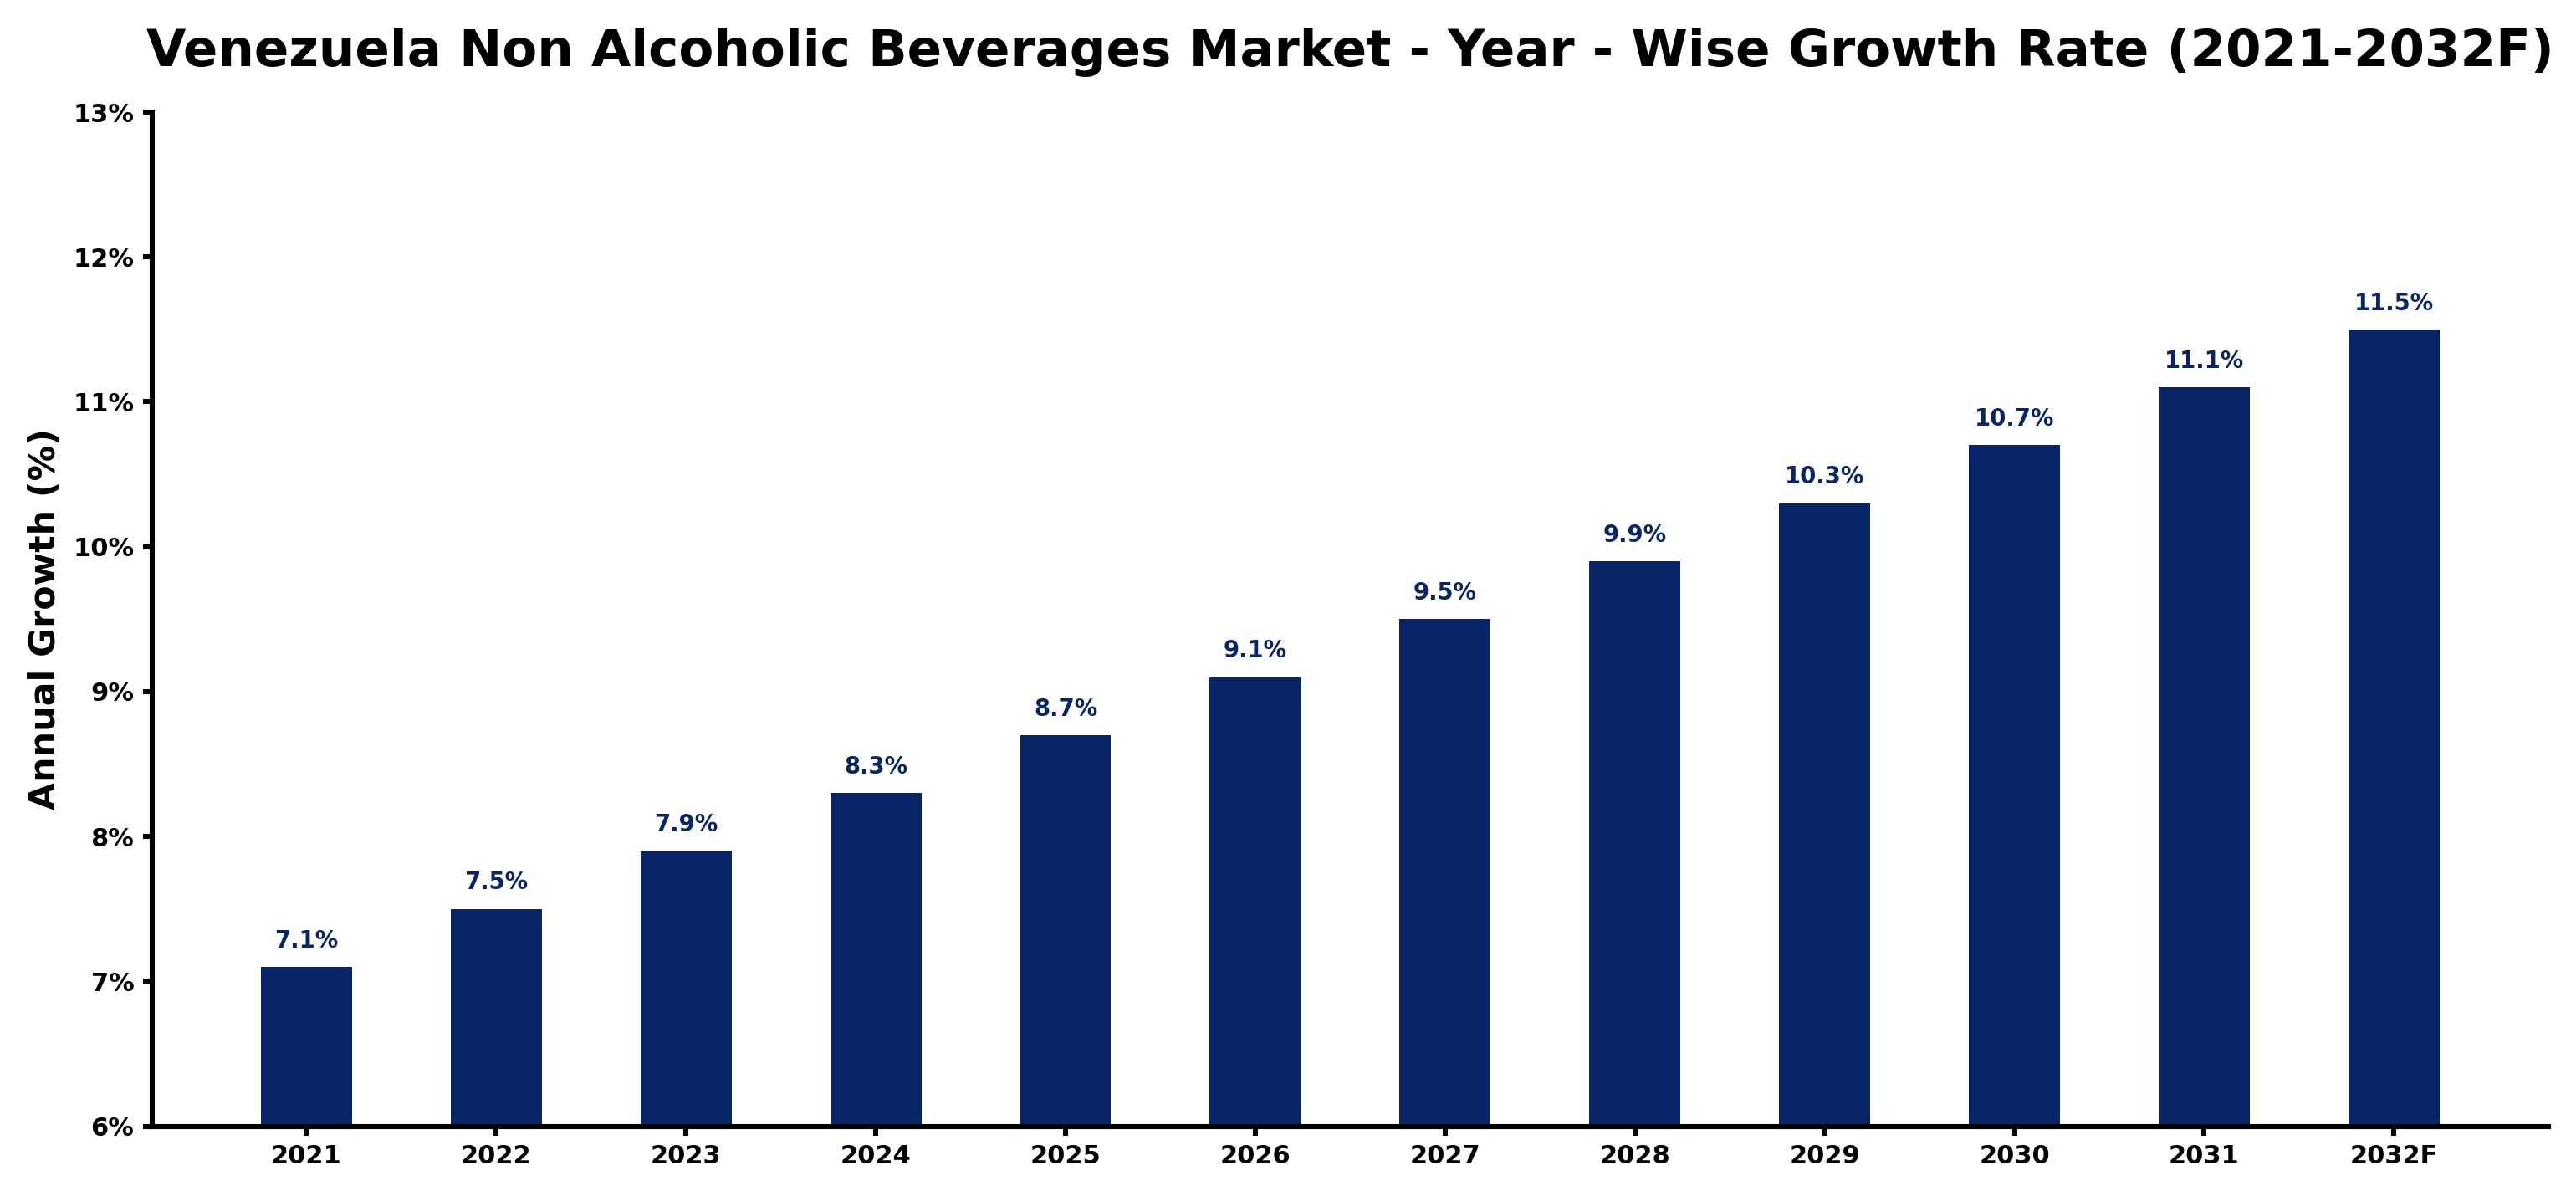
The table below presents the year‑wise growth rates along with the key drivers influencing the market
| Year | Growth Rate | Major Drivers |
| 2021 | 7.1% | Health consciousness drove beverage choices |
| 2022 | 7.5% | Increased disposable income encouraged spending |
| 2023 | 7.9% | Innovative flavors attracted new consumers |
| 2024 | 8.3% | Sustainability trends influenced purchasing behavior |
| 2025 | 8.7% | Local sourcing gained consumer preference |
| 2026 | 9.1% | Digital marketing expanded brand reach |
| 2027 | 9.5% | Product variety enhanced consumer interest |
| 2028 | 9.9% | Social media engagement increased visibility |
| 2029 | 10.3% | Convenience packaging attracted busy consumers |
| 2030 | 10.7% | Wellness trends drove product innovation |
| 2031 | 11.1% | Collaborations with influencers boosted sales |
| 2032 | 11.5% | Emerging markets expanded distribution channels |
Note - Market size estimations and growth projections presented in this report are based on 6Wresearch’s advanced forecasting approach, validated with industry datasets as of June 2026.
Venezuela Non Alcoholic Beverages Market Synopsis
The non-alcoholic beverages market in Venezuela is evolving rapidly, reflecting both consumer demand and the challenges posed by the economic landscape. A notable trend is the rising interest in healthier alternatives, such as organic juices and low-calorie drinks, driven by health-conscious consumers.
Additionally, Venezuelans are increasingly favoring convenient, ready-to-drink options that fit their busy lifestyles. With urbanization on the rise, the desire for variety in beverage choices is becoming a significant market driver, encouraging brands to adapt and diversify their product lines.
Venezuela Non Alcoholic Beverages Market Key Takeaways
- The market is poised for growth driven by a shift towards health-focused beverages.
- Urbanization is influencing consumer preferences for convenience and variety in beverage options.
- Local brands are innovating to compete with international players, expanding product diversity.
- Regulatory challenges and supply chain issues remain significant constraints on market growth.
- Investment opportunities exist in the development of functional and organic beverage products.
Evaluation of Restraints in Venezuela Non Alcoholic Beverages Market
The Venezuela Non Alcoholic Beverages Market is significantly hampered by economic instability, which manifests in hyperinflation and political unrest. These factors lead to unpredictable consumer purchasing power, complicating pricing strategies for manufacturers. Moreover, supply chain disruptions and stringent import regulations create additional hurdles for sourcing raw materials, resulting in production bottlenecks and inconsistent product availability. Consequently, the volatile business environment poses risks that deter investment and impede growth opportunities within the sector.
Venezuela Non Alcoholic Beverages Market Trends
A discernible trend in the Venezuela Non Alcoholic Beverages Market is the increasing demand for functional drinks that offer added health benefits. Consumers are gravitating toward products that provide hydration, energy, or immunity enhancement. Plant-based beverages, flavored water, and vitamin-infused drinks are gaining traction as consumers seek alternatives that align with their wellness goals.
Moreover, the popularity of ready-to-drink options, including cold brew coffees and artisanal sodas, continues to grow, particularly among younger demographics. This shift reflects an evolving palate and a desire for unique and interesting flavors, setting the stage for ongoing product innovation.
Venezuela Non Alcoholic Beverages Market Opportunities
Despite the myriad challenges faced by the Venezuelan economy, several investment opportunities emerge within the non-alcoholic beverages sector. The increasing consumer preference for health-oriented beverages, like natural juices and functional drinks, presents a lucrative avenue for companies willing to innovate. Additionally, partnerships with local producers for sourcing high-quality fruits and botanicals can optimize supply chains and reduce costs.
As consumers continue to prioritize health and sustainability, developing unique flavors and engaging marketing strategies can help brands carve out a competitive advantage in a crowded marketplace. This evolving landscape offers a fertile ground for growth and diversification.
Government Initiatives in the Venezuela Non Alcoholic Beverages Market
Government policies in Venezuela, heavily influenced by the country’s socialist framework, impose price controls and import restrictions that directly impact the non-alcoholic beverages market. The government regulates production quotas, aiming to support domestic industry, which can limit the variety of products available in the market. These interventions create a complex regulatory environment for both local and foreign companies as they seek to adapt to governmental mandates while trying to maintain competitive pricing and product quality.
Future Insights of the Venezuela Non Alcoholic Beverages Market
Looking ahead to 2026-2032, the Venezuela Non Alcoholic Beverages Market is likely to remain volatile due to ongoing economic and political challenges. Hyperinflation and resource scarcity are anticipated to continue impacting consumer purchasing power, complicating demand forecasting for manufacturers. However, segments focusing on health-oriented and functional beverages are expected to drive growth as consumer awareness evolves. Companies that can effectively navigate the unpredictable market conditions while aligning their product offerings with consumer trends are likely to emerge as key players in this landscape.
Venezuela Non Alcoholic Beverages Market Latest Developments (May 2025 - June 2026)
In recent months, there has been a marked increase in product launches targeting health-conscious consumers, with many brands introducing low-sugar and organic options. Companies are also adopting innovative marketing campaigns to better connect with younger demographics, highlighting the functional benefits of their beverages. Furthermore, some local producers are exploring sustainable practices and eco-friendly packaging as a response to the rising consumer demand for environmentally responsible products, creating new market niches.
Venezuela Non Alcoholic Beverages Market - Key Attractiveness of the Report
- 10 Years of Market Numbers
- Historical Data Starting from 2022 to 2025
- Base Year: 2025
- Forecast Data until 2032
- Key Performance Indicators Impacting the Market
- Major Upcoming Developments and Projects
Key Highlights of the Report:
- Venezuela Non Alcoholic Beverages Market Outlook
- Market Size of Venezuela Non Alcoholic Beverages Market, 2025
- Forecast of Venezuela Non Alcoholic Beverages Market, 2032
- Historical Data and Forecast of Venezuela Non Alcoholic Beverages Revenues & Volume for the Period 2022-2032F
- Venezuela Non Alcoholic Beverages Market Trend Evolution
- Venezuela Non Alcoholic Beverages Market Drivers and Challenges
- Venezuela Non Alcoholic Beverages Price Trends
- Venezuela Non Alcoholic Beverages Porter's Five Forces
- Venezuela Non Alcoholic Beverages Industry Life Cycle
- Historical Data and Forecast of Venezuela Non Alcoholic Beverages Market Revenues & Volume By Type for the Period 2022-2032F
- Historical Data and Forecast of Venezuela Non Alcoholic Beverages Market Revenues & Volume By Alcoholic Beverages for the Period 2022-2032F
- Historical Data and Forecast of Venezuela Non Alcoholic Beverages Market Revenues & Volume By Non-Alcoholic Beverages for the Period 2022-2032F
- Historical Data and Forecast of Venezuela Non Alcoholic Beverages Market Revenues & Volume By Bottled Water for the Period 2022-2032F
- Historical Data and Forecast of Venezuela Non Alcoholic Beverages Market Revenues & Volume By Carbonated Soft Drinks for the Period 2022-2032F
- Historical Data and Forecast of Venezuela Non Alcoholic Beverages Market Revenues & Volume By Fruit Juice for the Period 2022-2032F
- Historical Data and Forecast of Venezuela Non Alcoholic Beverages Market Revenues & Volume By Milk for the Period 2022-2032F
- Historical Data and Forecast of Venezuela Non Alcoholic Beverages Market Revenues & Volume By Packaging Type for the Period 2022-2032F
- Historical Data and Forecast of Venezuela Non Alcoholic Beverages Market Revenues & Volume By Cartons for the Period 2022-2032F
- Historical Data and Forecast of Venezuela Non Alcoholic Beverages Market Revenues & Volume By Cans for the Period 2022-2032F
- Historical Data and Forecast of Venezuela Non Alcoholic Beverages Market Revenues & Volume By Bottles for the Period 2022-2032F
- Historical Data and Forecast of Venezuela Non Alcoholic Beverages Market Revenues & Volume By Others for the Period 2022-2032F
- Historical Data and Forecast of Venezuela Non Alcoholic Beverages Market Revenues & Volume By Distribution Channel for the Period 2022-2032F
- Historical Data and Forecast of Venezuela Non Alcoholic Beverages Market Revenues & Volume By Online for the Period 2022-2032F
- Historical Data and Forecast of Venezuela Non Alcoholic Beverages Market Revenues & Volume By Offline for the Period 2022-2032F
- Historical Data and Forecast of Venezuela Non Alcoholic Beverages Market Revenues & Volume By Supermarkets for the Period 2022-2032F
- Historical Data and Forecast of Venezuela Non Alcoholic Beverages Market Revenues & Volume By Departmental Stores for the Period 2022-2032F
- Historical Data and Forecast of Venezuela Non Alcoholic Beverages Market Revenues & Volume By Specialty Stores for the Period 2022-2032F
- Venezuela Non Alcoholic Beverages Import Export Trade Statistics
- Market Opportunity Assessment By Type
- Market Opportunity Assessment By Packaging Type
- Market Opportunity Assessment By Distribution Channel
- Venezuela Non Alcoholic Beverages Top Companies Market Share
- Venezuela Non Alcoholic Beverages Competitive Benchmarking By Technical and Operational Parameters
- Venezuela Non Alcoholic Beverages Company Profiles
- Venezuela Non Alcoholic Beverages Key Strategic Recommendations
Venezuela Non Alcoholic Beverages Market - Frequently Asked Questions
The Venezuela Non Alcoholic Beverages Market is estimated at USD 491 Million in 2025 and is projected to reach USD 837 Million by 2032, growing at a CAGR of 7.9% from 2026 to 2032, reflecting a robust demand for healthier beverage options.
An increasing focus on health and wellness among consumers is a key driver, prompting a shift toward low-sugar and functional drinks. Urbanization also plays a role, as more people seek convenience and variety in their beverage choices.
Yes, opportunities exist in health-oriented products, innovative flavors, and unique packaging. Companies can differentiate themselves by investing in local sourcing and sustainable practices to appeal to increasingly eco-conscious consumers.
Government policies related to price controls and import restrictions create a challenging environment for both domestic and international companies. These regulations can affect pricing strategies and limit product variety available to consumers.
Companies must navigate economic instability, fluctuating consumer purchasing power, and supply chain disruptions, all of which complicate production and distribution efforts in this unpredictable market.
6Wresearch actively monitors the Venezuela Non Alcoholic Beverages Market and publishes its comprehensive annual report, highlighting emerging trends, growth drivers, revenue analysis, and forecast outlook. Our insights help businesses to make data-backed strategic decisions with ongoing market dynamics. Our analysts track relevent industries related to the Venezuela Non Alcoholic Beverages Market, allowing our clients with actionable intelligence and reliable forecasts tailored to emerging regional needs.
Yes, we provide customisation as per your requirements. To learn more, feel free to contact us on sales@6wresearch.com
1 Executive Summary |
2 Introduction |
2.1 Key Highlights of the Report |
2.2 Report Description |
2.3 Market Scope & Segmentation |
2.4 Research Methodology |
2.5 Assumptions |
3 Venezuela Non Alcoholic Beverages Market Overview |
3.1 Venezuela Country Macro Economic Indicators |
3.2 Venezuela Non Alcoholic Beverages Market Revenues & Volume, 2022 & 2032F |
3.3 Venezuela Non Alcoholic Beverages Market - Industry Life Cycle |
3.4 Venezuela Non Alcoholic Beverages Market - Porter's Five Forces |
3.5 Venezuela Non Alcoholic Beverages Market Revenues & Volume Share, By Type, 2022 & 2032F |
3.6 Venezuela Non Alcoholic Beverages Market Revenues & Volume Share, By Packaging Type, 2022 & 2032F |
3.7 Venezuela Non Alcoholic Beverages Market Revenues & Volume Share, By Distribution Channel, 2022 & 2032F |
4 Venezuela Non Alcoholic Beverages Market Dynamics |
4.1 Impact Analysis |
4.2 Market Drivers |
4.2.1 Increasing health consciousness among consumers leading to a shift towards healthier beverage options |
4.2.2 Growing disposable income and changing consumer lifestyles driving demand for convenient non-alcoholic beverages |
4.2.3 Rising tourism industry in Venezuela boosting the demand for non-alcoholic beverages among tourists |
4.3 Market Restraints |
4.3.1 Economic instability and hyperinflation impacting consumer purchasing power |
4.3.2 Political uncertainty and social unrest affecting consumer confidence and spending |
4.3.3 Infrastructure challenges and logistical issues hampering distribution and availability of non-alcoholic beverages |
5 Venezuela Non Alcoholic Beverages Market Trends |
6 Venezuela Non Alcoholic Beverages Market, By Types |
6.1 Venezuela Non Alcoholic Beverages Market, By Type |
6.1.1 Overview and Analysis |
6.1.2 Venezuela Non Alcoholic Beverages Market Revenues & Volume, By Type, 2022-2032F |
6.1.3 Venezuela Non Alcoholic Beverages Market Revenues & Volume, By Alcoholic Beverages, 2022-2032F |
6.1.4 Venezuela Non Alcoholic Beverages Market Revenues & Volume, By Non-Alcoholic Beverages, 2022-2032F |
6.1.5 Venezuela Non Alcoholic Beverages Market Revenues & Volume, By Bottled Water, 2022-2032F |
6.1.6 Venezuela Non Alcoholic Beverages Market Revenues & Volume, By Carbonated Soft Drinks, 2022-2032F |
6.1.7 Venezuela Non Alcoholic Beverages Market Revenues & Volume, By Fruit Juice, 2022-2032F |
6.1.8 Venezuela Non Alcoholic Beverages Market Revenues & Volume, By Milk, 2022-2032F |
6.2 Venezuela Non Alcoholic Beverages Market, By Packaging Type |
6.2.1 Overview and Analysis |
6.2.2 Venezuela Non Alcoholic Beverages Market Revenues & Volume, By Cartons, 2022-2032F |
6.2.3 Venezuela Non Alcoholic Beverages Market Revenues & Volume, By Cans, 2022-2032F |
6.2.4 Venezuela Non Alcoholic Beverages Market Revenues & Volume, By Bottles, 2022-2032F |
6.2.5 Venezuela Non Alcoholic Beverages Market Revenues & Volume, By Others, 2022-2032F |
6.3 Venezuela Non Alcoholic Beverages Market, By Distribution Channel |
6.3.1 Overview and Analysis |
6.3.2 Venezuela Non Alcoholic Beverages Market Revenues & Volume, By Online, 2022-2032F |
6.3.3 Venezuela Non Alcoholic Beverages Market Revenues & Volume, By Offline, 2022-2032F |
6.3.4 Venezuela Non Alcoholic Beverages Market Revenues & Volume, By Supermarkets, 2022-2032F |
6.3.5 Venezuela Non Alcoholic Beverages Market Revenues & Volume, By Departmental Stores, 2022-2032F |
6.3.6 Venezuela Non Alcoholic Beverages Market Revenues & Volume, By Specialty Stores, 2022-2032F |
7 Venezuela Non Alcoholic Beverages Market Import-Export Trade Statistics |
7.1 Venezuela Non Alcoholic Beverages Market Export to Major Countries |
7.2 Venezuela Non Alcoholic Beverages Market Imports from Major Countries |
8 Venezuela Non Alcoholic Beverages Market Key Performance Indicators |
8.1 Consumer demand trends for healthier beverage options |
8.2 Disposable income levels and consumer spending patterns on non-alcoholic beverages |
8.3 Tourism industry growth and its impact on non-alcoholic beverage consumption |
8.4 Inflation rates and its influence on pricing and affordability of non-alcoholic beverages |
8.5 Distribution network expansion and improvement in availability of non-alcoholic beverages |
9 Venezuela Non Alcoholic Beverages Market - Opportunity Assessment |
9.1 Venezuela Non Alcoholic Beverages Market Opportunity Assessment, By Type, 2022 & 2032F |
9.2 Venezuela Non Alcoholic Beverages Market Opportunity Assessment, By Packaging Type, 2022 & 2032F |
9.3 Venezuela Non Alcoholic Beverages Market Opportunity Assessment, By Distribution Channel, 2022 & 2032F |
10 Venezuela Non Alcoholic Beverages Market - Competitive Landscape |
10.1 Venezuela Non Alcoholic Beverages Market Revenue Share, By Companies, 2025 |
10.2 Venezuela Non Alcoholic Beverages Market Competitive Benchmarking, By Operating and Technical Parameters |
11 Company Profiles |
12 Recommendations |
13 Disclaimer |
Global Go To Market Strategy - 2030
Export potential enables firms to identify high-growth global markets with greater confidence by combining advanced trade intelligence with a structured quantitative methodology. The framework analyzes emerging demand trends and country-level import patterns while integrating macroeconomic and trade datasets such as GDP and population forecasts, bilateral import–export flows, tariff structures, elasticity differentials between developed and developing economies, geographic distance, and import demand projections. Using weighted trade values from 2020–2024 as the base period to project country-to-country export potential for 2030, these inputs are operationalized through calculated drivers such as gravity model parameters, tariff impact factors, and projected GDP per-capita growth. Through an analysis of hidden potentials, demand hotspots, and market conditions that are most favorable to success, this method enables firms to focus on target countries, maximize returns, and global expansion with data, backed by accuracy.
By factoring in the projected importer demand gap that is currently unmet and could be potential opportunity, it identifies the potential for the Exporter (Country) among 190 countries, against the general trade analysis, which identifies the biggest importer or exporter.
To discover high-growth global markets and optimize your business strategy:
Click Here
Pricing
- Single User License$ 1,995
- Department License$ 2,400
- Site License$ 3,120
- Global License$ 3,795

Leadership Perspectives from Industry Events
Search
Thought Leadership and Analyst Meet


Our Clients
6WResearch In News
- India Air Conditioner Market Set for Strong Rebound in 2026 After Weather-Led Correction and GST-Driven Recovery: 6Wresearch
- ADAS in India: How Automatic Emergency Braking, Blind Spot Detection & Driver Monitoring are Transforming Road Safety
- Doha a strategic location for EV manufacturing hub: IPA Qatar
- Demand for luxury TVs surging in the GCC, says Samsung
- Empowering Growth: The Thriving Journey of Bangladesh’s Cable Industry
- Demand for luxury TVs surging in the GCC, says Samsung
Latest Reports
- Nicaragua RPG Gaming Market (2026-2032)
- New Zealand RPG Gaming Market (2026-2032)
- Netherlands RPG Gaming Market (2026-2032)
- Nauru RPG Gaming Market (2026-2032)
- Namibia RPG Gaming Market (2026-2032)
- Mozambique RPG Gaming Market (2026-2032)
- Montenegro RPG Gaming Market (2026-2032)
- Mongolia RPG Gaming Market (2026-2032)
- Monaco RPG Gaming Market (2026-2032)
- Micronesia RPG Gaming Market (2026-2032)
Industry Events and Analyst Meet

HIMTEX 2026

India Refining Summit 2026

India EV Show 2026

EV tech India Expo 2026

Auto Tech Asia 2026
Whitepaper
- Middle East & Africa Commercial Security Market Click here to view more.
- Middle East & Africa Fire Safety Systems & Equipment Market Click here to view more.
- GCC Drone Market Click here to view more.
- Middle East Lighting Fixture Market Click here to view more.
- GCC Physical & Perimeter Security Market Click here to view more.