Vietnam Ammonia Market (2026-2032) | Industry, Growth, Size, Companies, Share, Revenue, Value, Trends, Analysis, Forecast
Market Forecast By Type (Liquid, Gas), By End-user Industry (Agriculture, Textiles, Mining, Pharmaceutical, Refrigeration, Others) And Competitive Landscape
| Product Code: ETC194742 | Publication Date: May 2022 | Updated Date: Apr 2026 | Product Type: Market Research Report | |
| Publisher: 6Wresearch | Author: Ravi Bhandari | No. of Pages: 60 | No. of Figures: 40 | No. of Tables: 7 |
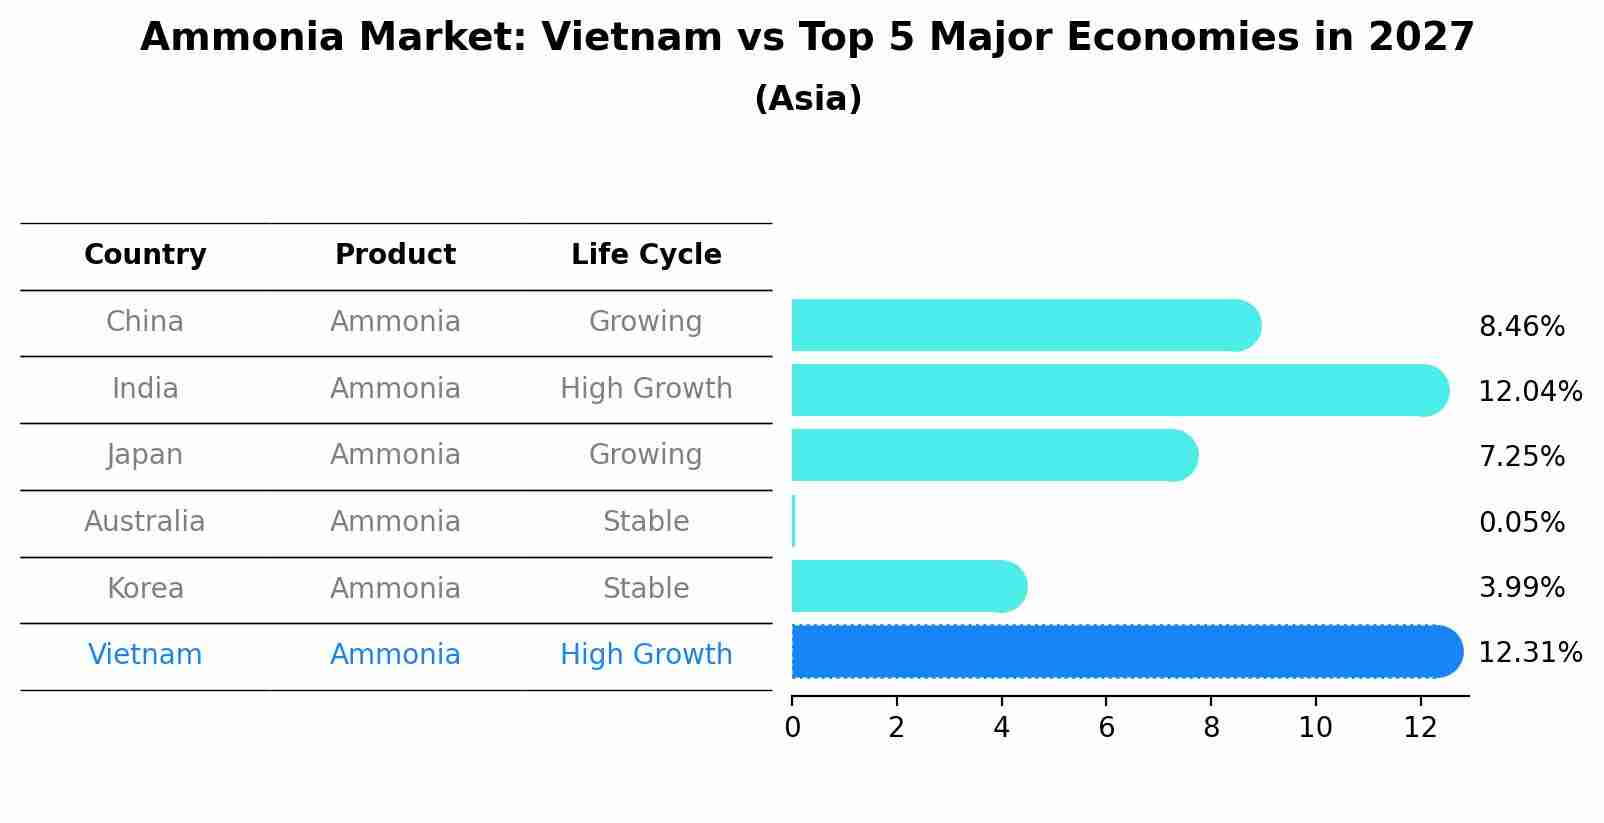
Ammonia Market: Vietnam vs Top 5 Major Economies in 2027 (Asia)
In the Asia region, the Ammonia market in Vietnam is projected to expand at a high growth rate of 12.31% by 2027. The largest economy is China, followed by India, Japan, Australia and South Korea.
Vietnam Ammonia Market Growth Rate
According to 6Wresearch internal database and industry insights, the Vietnam Ammonia Market is growing at a compound annual growth rate (CAGR) of 6.5% during the forecast period (2026-2032).
Topics Covered in the Vietnam Ammonia Market Report
Vietnam Ammonia Market report thoroughly covers the market by type and end-user industry. The market report provides an unbiased and detailed analysis of ongoing market trends, opportunities/high growth areas, and market drivers, which would help stakeholders devise and align their market strategies according to the current and future market dynamics.
Vietnam Ammonia Market Highlights
| Report Name | Vietnam Ammonia Market |
| Forecast period | 2026-2032 |
| CAGR | 6.5% |
| Growing Sector |
Agriculture |
Vietnam Ammonia Market Synopsis
The Vietnam Ammonia Market shows strong growth as agricultural and chemical and refrigeration industries need more ammonia. Ammonia functions as an essential component in fertilizer manufacturing which helps the country produce more agricultural goods. The market expansion results from industrial growth and rising needs for refrigeration equipment. The Vietnamese ammonia market develops from government programs which increase domestic production while decreasing import dependency.
Evaluation of Growth Drivers in the Vietnam Ammonia Market
Below mentioned some growth drivers and their impact on market dynamics:
| Drivers | Primary Segments Affected | Why It Matters |
| Rising Agricultural Demand | End-user (Agriculture) | Boosts fertilizer production and supports agricultural output growth |
| Industrial Expansion | End-user (Textiles, Mining) | Increases chemical usage across industrial manufacturing processes |
| Government Support for Fertilizer Production | Type (Liquid, Gas) | Enhances domestic output and reduces dependence on imports |
| Growth in Cold Storage Infrastructure | End-user (Refrigeration) | Drives ammonia demand for cooling and preservation applications |
| Export Growth in Chemicals | End-user (Pharmaceutical, Others) | Expands industrial consumption and strengthens export capabilities |
The Vietnam Ammonia Market is projected to grow significantly, at a CAGR of 6.5% during the forecast period of 2026-2032. The Vietnam Ammonia Market major drivers include two main factors which are the agricultural sector's growing need for fertilizer production and its impact on crop yield and food security. The industrial sector which includes textiles mining and chemical manufacturing is experiencing rising ammonia usage. The government programs which support local fertilizer manufacturing are improving supply capabilities. The demand for ammonia is increasing as of the expanding cold storage and refrigeration systems and the rising chemical and pharmaceutical exports which require ammonia in various uses.
Evaluation of Restraints in the Vietnam Ammonia Market
Below mentioned are some major restraints and their influence on market dynamics:
| Drivers | Primary Segments Affected | Why It Matters |
| Rising Agricultural Demand | End-user (Agriculture) | Boosts fertilizer production and supports agricultural output growth |
| Industrial Expansion | End-user (Textiles, Mining) | Increases chemical usage across industrial manufacturing processes |
| Government Support for Fertilizer Production | Type (Liquid, Gas) | Enhances domestic output and reduces dependence on imports |
| Growth in Cold Storage Infrastructure | End-user (Refrigeration) | Drives ammonia demand for cooling and preservation applications |
| Export Growth in Chemicals | End-user (Pharmaceutical, Others) | Expands industrial consumption and strengthens export capabilities |
Vietnam Ammonia Market Challenges
The Vietnam Ammonia Market experiences difficulties as raw material price changes and high energy expenses disrupt production efficiency. Also, the manufacturing process gets delayed due to stricter government regulations regarding the protection of the environment. Additionally, the storage and transportation procedures used for ammonia handling poses safety dangers. The market growth and supply stability of the business get affected by the need to import specific raw materials.
Vietnam Ammonia Market Trends
Some major trends contributing to the Vietnam Ammonia Market Growth are:
- Expansion of Fertilizer Production: There is a growing demand for ammonia from agriculture sector to improve the crop yield, food security, and supporting rural economic development.
- Development of Cold Storage Facilities: Increased development of refrigeration and logistics sectors is increasing demand for cooling storage systems, increasing supply chain efficiency and food preservation.
- Industrial Diversification: Growing industries like textile and pharmaceutical is driving ammonia usage for supporting industrial growth and increasing production capacity.
Vietnam Ammonia Market Investment Opportunities
Here are some investment opportunities in the Vietnam Ammonia Industry:
- Green Ammonia Production: More investment can be made on the development of sustainable technologies which lower carbon emission and meets future demand for cleaner energy solutions.
- Cold Chain Infrastructure: Making of refrigeration systems which improve storage and supports growing demand for temperature-sensitive goods will be beneficial for market growth.
- Fertilizer Production Facilities: Investment in domestic plants increases production capacity, supports agriculture, reduces imports, and ensures stable fertilizer supply across regions.
Top 5 Leading Players in the Vietnam Ammonia Market
Here are some top companies contributing to Vietnam Ammonia Market Share:
1. PetroVietnam Fertilizer and Chemicals Corporation (PVFCCo)
| Company Name | PetroVietnam Fertilizer and Chemicals Corporation (PVFCCo) |
|---|---|
| Established Year | 2003 |
| Headquarters | Ho Chi Minh City, Vietnam |
| Official Website | Click Here |
As the undisputed leader in Vietnam’s ammonia sector, PVFCCo maintains a dominant market share of over 90% in the southern region. Operating the Phu My Fertilizer Plant, the company has expanded its NH3 (ammonia) capacity to 540,000 tonnes per year.
2. Vietnam National Chemical Group (Vinachem)
| Company Name | Vietnam National Chemical Group (Vinachem) |
|---|---|
| Established Year | 1969 |
| Headquarters | Hanoi, Vietnam |
| Official Website | Click Here |
Vinachem is the massive state-owned umbrella group that controls the majority of North Vietnam's ammonia production through its core subsidiaries. In 2026, Vinachem acts as the strategic backbone for the country’s food security, managing large-scale synthesis at the Ninh Binh and Ha Bac facilities.
3. Ha Bac Nitrogenous Fertilizer and Chemicals
| Company Name | Ha Bac Nitrogenous Fertilizer and Chemicals |
|---|---|
| Established Year | 1960 |
| Headquarters | Bac Giang Province, Vietnam |
| Official Website | - |
A vital subsidiary of Vinachem, Ha Bac is the pioneer of nitrogenous production in Northern Vietnam. Following a major technical overhaul of its synthesis high-pressure systems, the plant produces approximately 65,000 tonnes of liquid ammonia for external sale annually.
4. Ninh Binh Nitrogenous Fertilizer
| Company Name | Ninh Binh Nitrogenous Fertilizer |
|---|---|
| Established Year | 2012 |
| Headquarters | Ninh Binh Province, Vietnam |
| Official Website | Click Here |
Operating one of the largest coal-to-ammonia complexes in Southeast Asia, Ninh Binh Nitrogenous Fertilizer is a critical heavy-industry player. With a design capacity that supports 560,000 tonnes of urea production, their internal ammonia synthesis unit is a marvel of scale.
5. Yara Vietnam (Yara International)
| Company Name | Yara Vietnam (Yara International) |
|---|---|
| Established Year | 1992 |
| Headquarters | Ho Chi Minh City |
| Official Website | - |
As the leading global player in the Vietnamese market, Yara specializes in the import and distribution of high-efficiency, low-carbon ammonia products. In 2026, Yara is the primary driver of knowledge transfer for ammonia co-firing technology in Vietnam’s power sector.
Government Regulations Introduced in the Vietnam Ammonia Market
According to Vietnamese government data, the ammonia market operates under strict industrial and environmental regulations. The National Chemical Industry Development Strategy together with other policies strengthens domestic production while lowering the need for imports. Environmental protection laws exist to regulate emissions together with waste disposal operations in ammonia production facilities. Government initiatives which establish fertilizer subsidies together with agricultural development programs increase ammonia demand while production safety and sustainable distribution methods remain intact.
Future Insights of the Vietnam Ammonia Market
The Vietnam Ammonia Market shows positive market prospects as it will experience substantial market growth. Agricultural and refrigeration and industrial sectors will drive market expansion through their increasing demand. The market will experience enhanced growth through two factors which include domestic production facility expansion and government support for sustainable development initiatives. The market will benefit from two factors which include the rising demand for green ammonia and the upcoming technological developments in production methods.
Market Segmentation Analysis
The report offers a comprehensive study of the subsequent market segments and their leading categories.
Liquid to Dominate the Market - By Type
According to Guneet Kaur, Senior Research Analyst at 6Wresearch, liquid ammonia is leading the market. Mainly due to its ease of storage and widespread use in fertilizer production. Also, it offers efficient handling and is chosen across industrial and agricultural applications.
Agriculture to Dominate the Market – By End-user Industry
The agriculture segment is leading the market. This is mainly due to its heavy reliance on ammonia-based fertilizers. Also, increasing crop production and demand for higher agricultural output drive ammonia consumption, making this segment the primary contributor to overall market growth.
Key attractiveness of the report
- 10 Years Market Numbers.
- Historical Data Starting from 2022 to 2025.
- Base Year: 2025
- Forecast Data until 2032.
- Key Performance Indicators Impacting the Market.
- Major Upcoming Developments and Projects.
Key Highlights of the Report:
- Vietnam Ammonia Market Outlook
- Market Size of Vietnam Ammonia Market, 2025
- Forecast of Vietnam Ammonia Market, 2032
- Historical Data and Forecast of Vietnam Ammonia Revenues & Volume for the Period 2022-2032
- Vietnam Ammonia Market Trend Evolution
- Vietnam Ammonia Market Drivers and Challenges
- Vietnam Ammonia Price Trends
- Vietnam Ammonia Porter's Five Forces
- Vietnam Ammonia Industry Life Cycle
- Historical Data and Forecast of Vietnam Ammonia Market Revenues & Volume By Type for the Period 2022-2032
- Historical Data and Forecast of Vietnam Ammonia Market Revenues & Volume By Liquid for the Period 2022-2032
- Historical Data and Forecast of Vietnam Ammonia Market Revenues & Volume By Gas for the Period 2022-2032
- Historical Data and Forecast of Vietnam Ammonia Market Revenues & Volume By End-user Industry for the Period 2022-2032
- Historical Data and Forecast of Vietnam Ammonia Market Revenues & Volume By Agriculture for the Period 2022-2032
- Historical Data and Forecast of Vietnam Ammonia Market Revenues & Volume By Textiles for the Period 2022-2032
- Historical Data and Forecast of Vietnam Ammonia Market Revenues & Volume By Mining for the Period 2022-2032
- Historical Data and Forecast of Vietnam Ammonia Market Revenues & Volume By Pharmaceutical for the Period 2022-2032
- Historical Data and Forecast of Vietnam Ammonia Market Revenues & Volume By Refrigeration for the Period 2022-2032
- Historical Data and Forecast of Vietnam Ammonia Market Revenues & Volume By Others for the Period 2022-2032
- Vietnam Ammonia Import Export Trade Statistics
- Market Opportunity Assessment By Type
- Market Opportunity Assessment By End-user Industry
- Vietnam Ammonia Top Companies Market Share
- Vietnam Ammonia Competitive Benchmarking By Technical and Operational Parameters
- Vietnam Ammonia Company Profiles
- Vietnam Ammonia Key Strategic Recommendations
Market covered
The report subsequently covers the market by following segments and subsegments.
By Type
- Liquid
- Gas
By End-user Industry
- Agriculture
- Textiles
- Mining
- Pharmaceutical
- Refrigeration
- Others
Vietnam Ammonia Market (2026-2032): FAQs
The market new opportunities include green ammonia production and cold chain infrastructure development.
The market advancements in production technologies and energy-efficient processes are increasing ammonia manufacturing efficiency and sustainability.
The Vietnam Ammonia Market is projected to grow at a CAGR of 6.5% during the forecast period of 2026-2032.
The market growth factors include government initiatives supporting domestic fertilizer production and increasing agricultural demand.
6Wresearch actively monitors the Vietnam Ammonia Market and publishes its comprehensive annual report, highlighting emerging trends, growth drivers, revenue analysis, and forecast outlook. Our insights help businesses to make data-backed strategic decisions with ongoing market dynamics. Our analysts track relevent industries related to the Vietnam Ammonia Market, allowing our clients with actionable intelligence and reliable forecasts tailored to emerging regional needs.
Yes, we provide customisation as per your requirements. To learn more, feel free to contact us on sales@6wresearch.com
| 1 Executive Summary |
| 2 Introduction |
| 2.1 Key Highlights of the Report |
| 2.2 Report Description |
| 2.3 Market Scope & Segmentation |
| 2.4 Research Methodology |
| 2.5 Assumptions |
| 3 Vietnam Ammonia Market Overview |
| 3.1 Vietnam Country Macro Economic Indicators |
| 3.2 Vietnam Ammonia Market Revenues & Volume, 2022 & 2032F |
| 3.3 Vietnam Ammonia Market - Industry Life Cycle |
| 3.4 Vietnam Ammonia Market - Porter's Five Forces |
| 3.5 Vietnam Ammonia Market Revenues & Volume Share, By Type, 2022 & 2032F |
| 3.6 Vietnam Ammonia Market Revenues & Volume Share, By End-user Industry, 2022 & 2032F |
| 4 Vietnam Ammonia Market Dynamics |
| 4.1 Impact Analysis |
| 4.2 Market Drivers |
| 4.2.1 Growing agricultural sector in Vietnam leading to increased demand for ammonia as a fertilizer |
| 4.2.2 Expansion of industrial sectors such as chemicals, pharmaceuticals, and textiles driving demand for ammonia as a raw material |
| 4.2.3 Government initiatives to promote domestic production of ammonia for self-sufficiency and reduced import dependency |
| 4.3 Market Restraints |
| 4.3.1 Volatility in global ammonia prices impacting the cost competitiveness of domestic producers |
| 4.3.2 Environmental concerns and regulations related to ammonia production and usage |
| 4.3.3 Competition from alternative fertilizers and chemicals impacting the market growth |
| 5 Vietnam Ammonia Market Trends |
| 6 Vietnam Ammonia Market, By Types |
| 6.1 Vietnam Ammonia Market, By Type |
| 6.1.1 Overview and Analysis |
| 6.1.2 Vietnam Ammonia Market Revenues & Volume, By Type, 2022-2032F |
| 6.1.3 Vietnam Ammonia Market Revenues & Volume, By Liquid, 2022-2032F |
| 6.1.4 Vietnam Ammonia Market Revenues & Volume, By Gas, 2022-2032F |
| 6.2 Vietnam Ammonia Market, By End-user Industry |
| 6.2.1 Overview and Analysis |
| 6.2.2 Vietnam Ammonia Market Revenues & Volume, By Agriculture, 2022-2032F |
| 6.2.3 Vietnam Ammonia Market Revenues & Volume, By Textiles, 2022-2032F |
| 6.2.4 Vietnam Ammonia Market Revenues & Volume, By Mining, 2022-2032F |
| 6.2.5 Vietnam Ammonia Market Revenues & Volume, By Pharmaceutical, 2022-2032F |
| 6.2.6 Vietnam Ammonia Market Revenues & Volume, By Refrigeration, 2022-2032F |
| 6.2.7 Vietnam Ammonia Market Revenues & Volume, By Others, 2022-2032F |
| 7 Vietnam Ammonia Market Import-Export Trade Statistics |
| 7.1 Vietnam Ammonia Market Export to Major Countries |
| 7.2 Vietnam Ammonia Market Imports from Major Countries |
| 8 Vietnam Ammonia Market Key Performance Indicators |
| 8.1 Average selling price of ammonia in Vietnam |
| 8.2 Capacity utilization rate of domestic ammonia production facilities |
| 8.3 Investment in research and development for ammonia production technology and efficiency improvements |
| 9 Vietnam Ammonia Market - Opportunity Assessment |
| 9.1 Vietnam Ammonia Market Opportunity Assessment, By Type, 2022 & 2032F |
| 9.2 Vietnam Ammonia Market Opportunity Assessment, By End-user Industry, 2022 & 2032F |
| 10 Vietnam Ammonia Market - Competitive Landscape |
| 10.1 Vietnam Ammonia Market Revenue Share, By Companies, 2025 |
| 10.2 Vietnam Ammonia Market Competitive Benchmarking, By Operating and Technical Parameters |
| 11 Company Profiles |
| 12 Recommendations |
| 13 Disclaimer |
Global Go To Market Strategy - 2030
Export potential enables firms to identify high-growth global markets with greater confidence by combining advanced trade intelligence with a structured quantitative methodology. The framework analyzes emerging demand trends and country-level import patterns while integrating macroeconomic and trade datasets such as GDP and population forecasts, bilateral import–export flows, tariff structures, elasticity differentials between developed and developing economies, geographic distance, and import demand projections. Using weighted trade values from 2020–2024 as the base period to project country-to-country export potential for 2030, these inputs are operationalized through calculated drivers such as gravity model parameters, tariff impact factors, and projected GDP per-capita growth. Through an analysis of hidden potentials, demand hotspots, and market conditions that are most favorable to success, this method enables firms to focus on target countries, maximize returns, and global expansion with data, backed by accuracy.
By factoring in the projected importer demand gap that is currently unmet and could be potential opportunity, it identifies the potential for the Exporter (Country) among 190 countries, against the general trade analysis, which identifies the biggest importer or exporter.
To discover high-growth global markets and optimize your business strategy:
Click Here
Pricing
- Single User License$ 1,995
- Department License$ 2,400
- Site License$ 3,120
- Global License$ 3,795

Leadership Perspectives from Industry Events
Search
Thought Leadership and Analyst Meet


Our Clients
6WResearch In News
- India Air Conditioner Market Set for Strong Rebound in 2026 After Weather-Led Correction and GST-Driven Recovery: 6Wresearch
- ADAS in India: How Automatic Emergency Braking, Blind Spot Detection & Driver Monitoring are Transforming Road Safety
- Doha a strategic location for EV manufacturing hub: IPA Qatar
- Demand for luxury TVs surging in the GCC, says Samsung
- Empowering Growth: The Thriving Journey of Bangladesh’s Cable Industry
- Demand for luxury TVs surging in the GCC, says Samsung
Latest Reports
- Nicaragua RPG Gaming Market (2026-2032)
- New Zealand RPG Gaming Market (2026-2032)
- Netherlands RPG Gaming Market (2026-2032)
- Nauru RPG Gaming Market (2026-2032)
- Namibia RPG Gaming Market (2026-2032)
- Mozambique RPG Gaming Market (2026-2032)
- Montenegro RPG Gaming Market (2026-2032)
- Mongolia RPG Gaming Market (2026-2032)
- Monaco RPG Gaming Market (2026-2032)
- Micronesia RPG Gaming Market (2026-2032)
Industry Events and Analyst Meet

EV India Expo 2026

HIMTEX 2026

India Refining Summit 2026

India EV Show 2026

EV tech India Expo 2026
Whitepaper
- Middle East & Africa Commercial Security Market Click here to view more.
- Middle East & Africa Fire Safety Systems & Equipment Market Click here to view more.
- GCC Drone Market Click here to view more.
- Middle East Lighting Fixture Market Click here to view more.
- GCC Physical & Perimeter Security Market Click here to view more.