Vietnam Rare Earth & Products Market (2026-2032) | Companies, Forecast, Value, Industry, Analysis, Trends, Outlook, Growth, Size, Revenue & Share
Market Forecast By Product Types (Cerium, Dysprosium, Erbium, Europium, Gadolinium, Holmium, Lanthanum, Others), By Applications (Magnets, Catalysts, Metallurgy, Polishing, Glass, Phosphors, Ceramics, Others) And Competitive Landscape
| Product Code: ETC008750 | Publication Date: Aug 2023 | Updated Date: Jun 2026 | Product Type: Report | |
| Publisher: 6Wresearch | Author: Ravi Bhandari | No. of Pages: 70 | No. of Figures: 35 | No. of Tables: 5 |
Vietnam Rare Earth & Products Market Summary
The vietnam rare earth & products market was estimated at USD 459 Million in 2025 and is projected to reach USD 648 Million by 2032, growing at a CAGR of 8.1% from 2026 to 2032.
Vietnam Rare Earth & Products Market Year-wise Growth Rate and Key Drivers
This graph highlights how the Vietnam Rare Earth & Products Market has steadily grown over the past five years, supported by major growth factors.
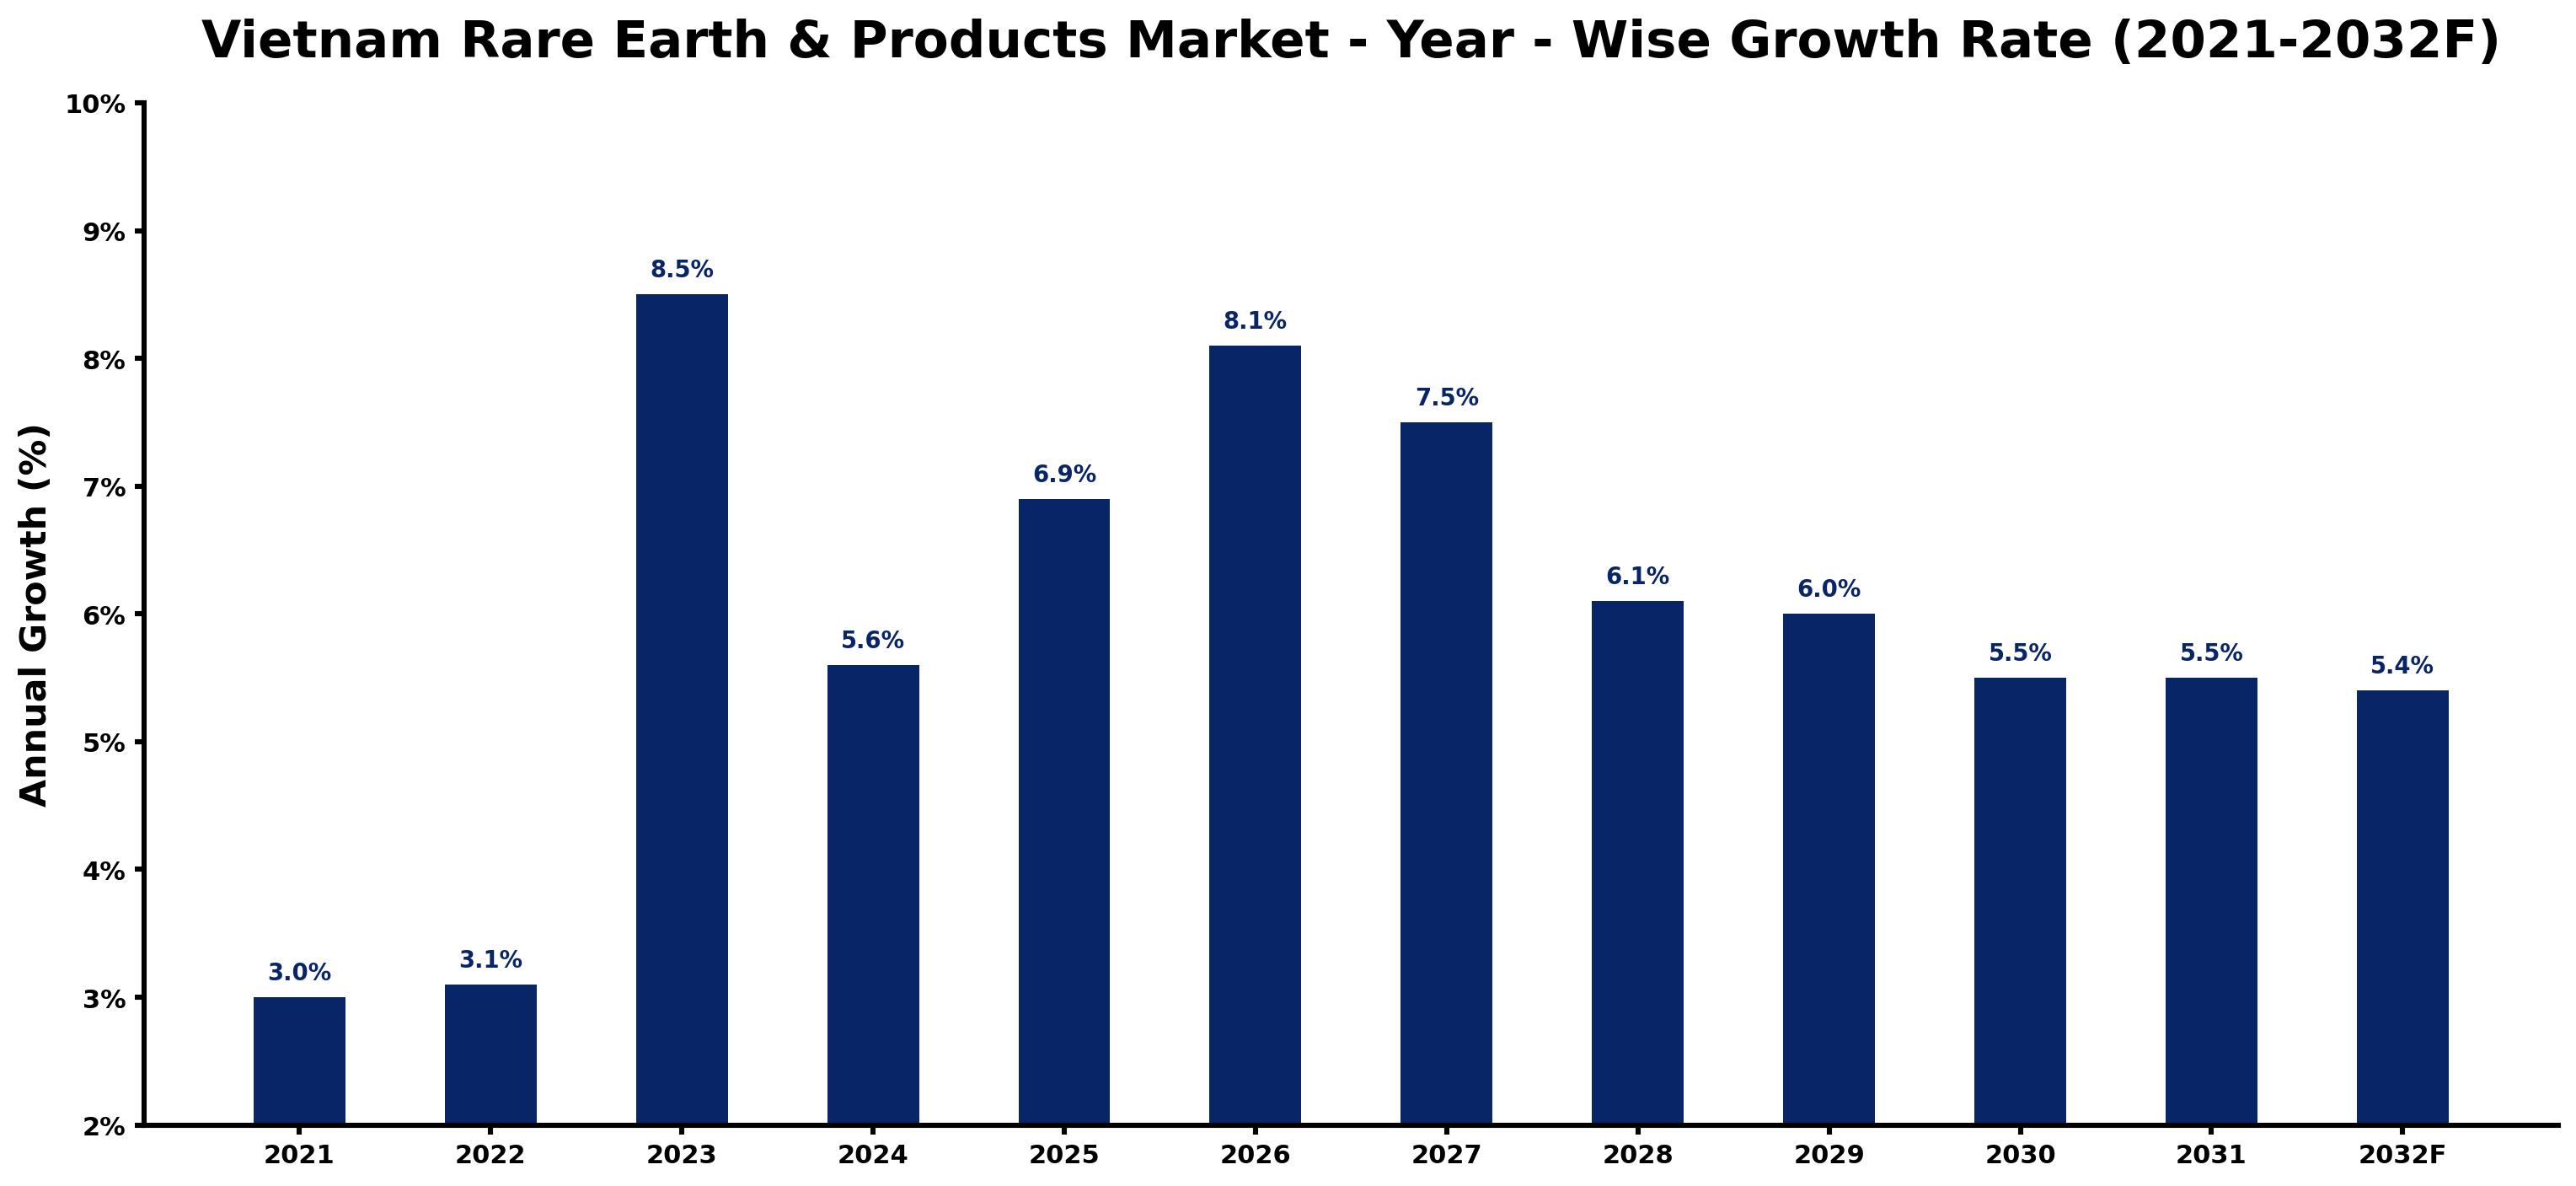
The table below presents the year wise growth rates along with the key drivers influencing the market
| Year | Growth Rate | Major Drivers |
| 2021 | 3.0% | Vietnam's manufacturing sector embraces rare earth elements for high-tech production needs. |
| 2022 | 3.1% | International partnerships emerge, enhancing Vietnam's rare earth extraction capabilities and technologies. |
| 2023 | 8.5% | Vietnamese exports target growing global demand for electric vehicle batteries and magnets. |
| 2024 | 5.6% | Domestic investments in refining facilities bolster local supply chains for rare earth elements. |
| 2025 | 6.9% | Global tech companies relocate to Vietnam, increasing regional demand for rare earth products. |
| 2026 | 8.1% | Emerging green energy initiatives highlight the importance of rare earth elements for sustainability. |
| 2027 | 7.5% | Local universities expand research programs focusing on rare earth applications and technologies. |
| 2028 | 6.1% | Vietnam's strategic location attracts foreign investment in rare earth infrastructure development. |
| 2029 | 6.0% | Environmental regulations stimulate innovation in sustainable extraction and processing methods. |
| 2030 | 5.5% | Collaborations with international firms enhance Vietnam's competitiveness in the rare earth market. |
| 2031 | 5.5% | Supply chain disruptions push industries to rely more on local rare earth sources. |
| 2032 | 5.4% | Vietnam solidifies its position as a key player in the global rare earth ecosystem. |
Note - Market size estimations and growth projections presented in this report are based on 6Wresearch's advanced forecasting approach, validated with industry datasets as of June 2026.
Vietnam Rare Earth & Products Market Synopsis
The Vietnam Rare Earth Products Market is projected to reach 8.1% and witness significant growth during the forecast period (2026-2032). This market comprises the production, consumption, and trade of rare earth elements (REEs) and their derived products, which are vital for various high-tech applications. Rare earth elements include a group of 17 chemically similar elements that are intrinsic to industries such as electronics, renewable energy, defense, and healthcare.
Vietnam Rare Earth & Products Market Growth Drivers
Several key factors are propelling the Vietnam Rare Earth & Products Market forward. First and foremost, the surge in consumer electronics and high-tech devices has amplified the demand for rare earth products utilized in electronic components and displays. Additionally, the increasing reliance on renewable energy technologies, encompassing wind turbines, solar panels, and electric vehicle motors, is further driving market expansion.
- The burgeoning demand for consumer electronics necessitates the incorporation of rare earth products, enhancing their importance in the supply chain.
- Renewable energy applications are increasingly utilizing rare earth elements, thereby fostering sustainable development within the industry.
- Vietnam's strategic geographic position offers lucrative export opportunities, as the global appetite for rare earth elements continues to grow.
- The integration of rare earth products in defense and aerospace industries, specifically in advanced materials and technological infrastructure, underscores their critical role.
- Technological advancements in extraction and processing enhance the efficiency and viability of rare earth mining operations in Vietnam.
Vietnam Rare Earth & Products Market Challenges and Restraints
Despite the positive growth trajectory, the Vietnam Rare Earth & Products Market faces several challenges. Environmental concerns related to rare earth mining necessitate strict compliance with regulations regarding water and soil pollution. Furthermore, the dependence on a limited number of countries for rare earth element sourcing introduces significant supply chain vulnerabilities.
- The environmental impact of mining practices could lead to increased regulatory scrutiny and operational costs.
- Geopolitical tensions and global market dynamics can influence rare earth pricing, thereby affecting the profitability of domestic miners and exporters.
- Technological advancements in the sector require continuous investment, which can be a barrier for smaller firms.
- Market volatility stemming from demand fluctuations presents additional risks for stakeholders.
- Compliance with international standards for environmental sustainability is increasingly demanded by global partners.
Vietnam Rare Earth & Products Market Government Investment and Initiatives
The Vietnamese government has taken significant steps to foster the development of the rare earth products market. Investment in research and development, coupled with policy initiatives targeting the sustainable mining of rare earth elements, has become a priority. Public funding is increasingly funneled into technological advancements aimed at reducing environmental footprints and enhancing extraction efficiency.
- Government initiatives are focused on establishing Vietnam as a reliable supplier of rare earth elements in the global market.
- Investment in infrastructure improvements is underway to support efficient logistics in the distribution of rare earth products.
- Regulatory frameworks are being enhanced to promote environmentally responsible mining practices.
- Collaborations with international partners are encouraged to leverage technological expertise and ensure compliance with global standards.
- Public investment is aimed at expanding educational resources and workforce training to support the rare earth industry.
Vietnam Rare Earth & Products Market Latest Developments (May 2025 - June 2026)
From May 2025 to June 2026, the Vietnam Rare Earth & Products Market has witnessed noteworthy developments that indicate a shifting industry landscape. Innovations in mining technologies have been adopted, improving the efficiency of rare earth extraction processes. The government has intensified its focus on international collaborations, aiming to bolster export capacity while addressing environmental concerns.
- Emerging partnerships with technology firms have catalyzed advancements in processing techniques.
- Heightened government incentives have opened doors for both domestic and foreign investments in the rare earth sector.
- Market players are increasingly adopting eco-friendly practices, responding to global demand for sustainable products.
- Changes in consumer preferences, driven by a growing awareness of sustainability, have redirected product offerings.
- The global demand for rare earth products has spurred Vietnamese firms to optimize their supply chains and logistics.
Vietnam Rare Earth & Products Market - Key Attractiveness of the Report
- 10 Years of Market Numbers
- Historical Data Starting from 2022 to 2025
- Base Year: 2025
- Forecast Data until 2032
- Key Performance Indicators Impacting the Market
- Major Upcoming Developments and Projects
Key Highlights of the Report:
- Vietnam Rare Earth & Products Market Outlook
- Market Size of Vietnam Rare Earth & Products Market, 2025
- Forecast of Vietnam Rare Earth & Products Market, 2032
- Historical Data and Forecast of Vietnam Rare Earth & Products Revenues & Volume for the Period 2022-2032F
- Vietnam Rare Earth & Products Market Trend Evolution
- Vietnam Rare Earth & Products Market Drivers and Challenges
- Vietnam Rare Earth & Products Price Trends
- Vietnam Rare Earth & Products Porter's Five Forces
- Vietnam Rare Earth & Products Industry Life Cycle
- Historical Data and Forecast of Vietnam Rare Earth & Products Market Revenues & Volume By Product Types for the Period 2022-2032F
- Historical Data and Forecast of Vietnam Rare Earth & Products Market Revenues & Volume By Cerium for the Period 2022-2032F
- Historical Data and Forecast of Vietnam Rare Earth & Products Market Revenues & Volume By Dysprosium for the Period 2022-2032F
- Historical Data and Forecast of Vietnam Rare Earth & Products Market Revenues & Volume By Erbium for the Period 2022-2032F
- Historical Data and Forecast of Vietnam Rare Earth & Products Market Revenues & Volume By Europium for the Period 2022-2032F
- Historical Data and Forecast of Vietnam Rare Earth & Products Market Revenues & Volume By Gadolinium for the Period 2022-2032F
- Historical Data and Forecast of Vietnam Rare Earth & Products Market Revenues & Volume By Holmium for the Period 2022-2032F
- Historical Data and Forecast of Vietnam Rare Earth & Products Market Revenues & Volume By Lanthanum for the Period 2022-2032F
- Historical Data and Forecast of Vietnam Cerium Rare Earth & Products Market Revenues & Volume By Others for the Period 2022-2032F
- Historical Data and Forecast of Vietnam Rare Earth & Products Market Revenues & Volume By Applications for the Period 2022-2032F
- Historical Data and Forecast of Vietnam Rare Earth & Products Market Revenues & Volume By Magnets for the Period 2022-2032F
- Historical Data and Forecast of Vietnam Rare Earth & Products Market Revenues & Volume By Catalysts for the Period 2022-2032F
- Historical Data and Forecast of Vietnam Rare Earth & Products Market Revenues & Volume By Metallurgy for the Period 2022-2032F
- Historical Data and Forecast of Vietnam Rare Earth & Products Market Revenues & Volume By Polishing for the Period 2022-2032F
- Historical Data and Forecast of Vietnam Rare Earth & Products Market Revenues & Volume By Glass for the Period 2022-2032F
- Historical Data and Forecast of Vietnam Rare Earth & Products Market Revenues & Volume By Phosphors for the Period 2022-2032F
- Historical Data and Forecast of Vietnam Rare Earth & Products Market Revenues & Volume By Ceramics for the Period 2022-2032F
- Historical Data and Forecast of Vietnam Rare Earth & Products Market Revenues & Volume By Others for the Period 2022-2032F
- Vietnam Rare Earth & Products Import Export Trade Statistics
- Market Opportunity Assessment By Product Types
- Market Opportunity Assessment By Applications
- Vietnam Rare Earth & Products Top Companies Market Share
- Vietnam Rare Earth & Products Competitive Benchmarking By Technical and Operational Parameters
- Vietnam Rare Earth & Products Company Profiles
- Vietnam Rare Earth & Products Key Strategic Recommendations
Frequently Asked Questions About the Market Study (FAQs):
Rare earth products are primarily utilized in consumer electronics, renewable energy technologies, defense systems, and healthcare applications.
The Vietnamese government is investing in research, enhancing regulatory frameworks, and fostering international collaborations to support the rare earth industry.
Key challenges include environmental concerns, supply chain vulnerabilities, and fluctuations in global rare earth prices.
The increasing demand for high-tech devices and the growing reliance on renewable energy technologies are major drivers for the Vietnam Rare Earth & Products Market.
6Wresearch actively monitors the Vietnam Rare Earth & Products Market and publishes its comprehensive annual report, highlighting emerging trends, growth drivers, revenue analysis, and forecast outlook. Our insights help businesses to make data-backed strategic decisions with ongoing market dynamics. Our analysts track relevent industries related to the Vietnam Rare Earth & Products Market, allowing our clients with actionable intelligence and reliable forecasts tailored to emerging regional needs.
Yes, we provide customisation as per your requirements. To learn more, feel free to contact us on sales@6wresearch.com
1 Executive Summary |
2 Introduction |
2.1 Key Highlights of the Report |
2.2 Report Description |
2.3 Market Scope & Segmentation |
2.4 Research Methodology |
2.5 Assumptions |
3 Vietnam Rare Earth & Products Market Overview |
3.1 Vietnam Country Macro Economic Indicators |
3.2 Vietnam Rare Earth & Products Market Revenues & Volume, 2022 & 2032F |
3.3 Vietnam Rare Earth & Products Market - Industry Life Cycle |
3.4 Vietnam Rare Earth & Products Market - Porter's Five Forces |
3.5 Vietnam Rare Earth & Products Market Revenues & Volume Share, By Product Types, 2022 & 2032F |
3.6 Vietnam Rare Earth & Products Market Revenues & Volume Share, By Applications, 2022 & 2032F |
4 Vietnam Rare Earth & Products Market Dynamics |
4.1 Impact Analysis |
4.2 Market Drivers |
4.3 Market Restraints |
5 Vietnam Rare Earth & Products Market Trends |
6 Vietnam Rare Earth & Products Market, By Types |
6.1 Vietnam Rare Earth & Products Market, By Product Types |
6.1.1 Overview and Analysis |
6.1.2 Vietnam Rare Earth & Products Market Revenues & Volume, By Product Types, 2022-2032F |
6.1.3 Vietnam Rare Earth & Products Market Revenues & Volume, By Cerium, 2022-2032F |
6.1.4 Vietnam Rare Earth & Products Market Revenues & Volume, By Dysprosium, 2022-2032F |
6.1.5 Vietnam Rare Earth & Products Market Revenues & Volume, By Erbium, 2022-2032F |
6.1.6 Vietnam Rare Earth & Products Market Revenues & Volume, By Europium, 2022-2032F |
6.1.7 Vietnam Rare Earth & Products Market Revenues & Volume, By Gadolinium, 2022-2032F |
6.1.8 Vietnam Rare Earth & Products Market Revenues & Volume, By Holmium, 2022-2032F |
6.1.9 Vietnam Rare Earth & Products Market Revenues & Volume, By Others, 2022-2032F |
6.1.10 Vietnam Rare Earth & Products Market Revenues & Volume, By Others, 2022-2032F |
6.2 Vietnam Rare Earth & Products Market, By Applications |
6.2.1 Overview and Analysis |
6.2.2 Vietnam Rare Earth & Products Market Revenues & Volume, By Magnets, 2022-2032F |
6.2.3 Vietnam Rare Earth & Products Market Revenues & Volume, By Catalysts, 2022-2032F |
6.2.4 Vietnam Rare Earth & Products Market Revenues & Volume, By Metallurgy, 2022-2032F |
6.2.5 Vietnam Rare Earth & Products Market Revenues & Volume, By Polishing, 2022-2032F |
6.2.6 Vietnam Rare Earth & Products Market Revenues & Volume, By Glass, 2022-2032F |
6.2.7 Vietnam Rare Earth & Products Market Revenues & Volume, By Phosphors, 2022-2032F |
6.2.8 Vietnam Rare Earth & Products Market Revenues & Volume, By Others, 2022-2032F |
6.2.9 Vietnam Rare Earth & Products Market Revenues & Volume, By Others, 2022-2032F |
7 Vietnam Rare Earth & Products Market Import-Export Trade Statistics |
7.1 Vietnam Rare Earth & Products Market Export to Major Countries |
7.2 Vietnam Rare Earth & Products Market Imports from Major Countries |
8 Vietnam Rare Earth & Products Market Key Performance Indicators |
9 Vietnam Rare Earth & Products Market - Opportunity Assessment |
9.1 Vietnam Rare Earth & Products Market Opportunity Assessment, By Product Types, 2022 & 2032F |
9.2 Vietnam Rare Earth & Products Market Opportunity Assessment, By Applications, 2022 & 2032F |
10 Vietnam Rare Earth & Products Market - Competitive Landscape |
10.1 Vietnam Rare Earth & Products Market Revenue Share, By Companies, 2025 |
10.2 Vietnam Rare Earth & Products Market Competitive Benchmarking, By Operating and Technical Parameters |
11 Company Profiles |
12 Recommendations |
13 Disclaimer |
Global Go To Market Strategy - 2030
Export potential enables firms to identify high-growth global markets with greater confidence by combining advanced trade intelligence with a structured quantitative methodology. The framework analyzes emerging demand trends and country-level import patterns while integrating macroeconomic and trade datasets such as GDP and population forecasts, bilateral import–export flows, tariff structures, elasticity differentials between developed and developing economies, geographic distance, and import demand projections. Using weighted trade values from 2020–2024 as the base period to project country-to-country export potential for 2030, these inputs are operationalized through calculated drivers such as gravity model parameters, tariff impact factors, and projected GDP per-capita growth. Through an analysis of hidden potentials, demand hotspots, and market conditions that are most favorable to success, this method enables firms to focus on target countries, maximize returns, and global expansion with data, backed by accuracy.
By factoring in the projected importer demand gap that is currently unmet and could be potential opportunity, it identifies the potential for the Exporter (Country) among 190 countries, against the general trade analysis, which identifies the biggest importer or exporter.
To discover high-growth global markets and optimize your business strategy:
Click Here
Pricing
- Single User License$ 1,995
- Department License$ 2,400
- Site License$ 3,120
- Global License$ 3,795

Leadership Perspectives from Industry Events
Search
Thought Leadership and Analyst Meet


Our Clients
6WResearch In News
- India Air Conditioner Market Set for Strong Rebound in 2026 After Weather-Led Correction and GST-Driven Recovery: 6Wresearch
- ADAS in India: How Automatic Emergency Braking, Blind Spot Detection & Driver Monitoring are Transforming Road Safety
- Doha a strategic location for EV manufacturing hub: IPA Qatar
- Demand for luxury TVs surging in the GCC, says Samsung
- Empowering Growth: The Thriving Journey of Bangladesh’s Cable Industry
- Demand for luxury TVs surging in the GCC, says Samsung
Latest Reports
- Nicaragua RPG Gaming Market (2026-2032)
- New Zealand RPG Gaming Market (2026-2032)
- Netherlands RPG Gaming Market (2026-2032)
- Nauru RPG Gaming Market (2026-2032)
- Namibia RPG Gaming Market (2026-2032)
- Mozambique RPG Gaming Market (2026-2032)
- Montenegro RPG Gaming Market (2026-2032)
- Mongolia RPG Gaming Market (2026-2032)
- Monaco RPG Gaming Market (2026-2032)
- Micronesia RPG Gaming Market (2026-2032)
Industry Events and Analyst Meet

EV India Expo 2026

HIMTEX 2026

India Refining Summit 2026

India EV Show 2026

EV tech India Expo 2026
Whitepaper
- Middle East & Africa Commercial Security Market Click here to view more.
- Middle East & Africa Fire Safety Systems & Equipment Market Click here to view more.
- GCC Drone Market Click here to view more.
- Middle East Lighting Fixture Market Click here to view more.
- GCC Physical & Perimeter Security Market Click here to view more.