Zambia Smart Card Market (2026-2032) | Growth, Companies, Segmentation, Analysis, Trends, Revenue, Industry, Outlook, Forecast, Value, Size & Share
Market Forecast By Types (Contact Cards, Contactless cards, Multi-component cards), By Component (Memory-based, Microcontroller-based), By Application (BFSI, Government, Telecommunication, Retail, Healthcare, Hospitality, Others) And Competitive Landscape
| Product Code: ETC4679596 | Publication Date: Nov 2023 | Updated Date: Apr 2026 | Product Type: Market Research Report | |
| Publisher: 6Wresearch | Author: Shubham Padhi | No. of Pages: 60 | No. of Figures: 30 | No. of Tables: 5 |
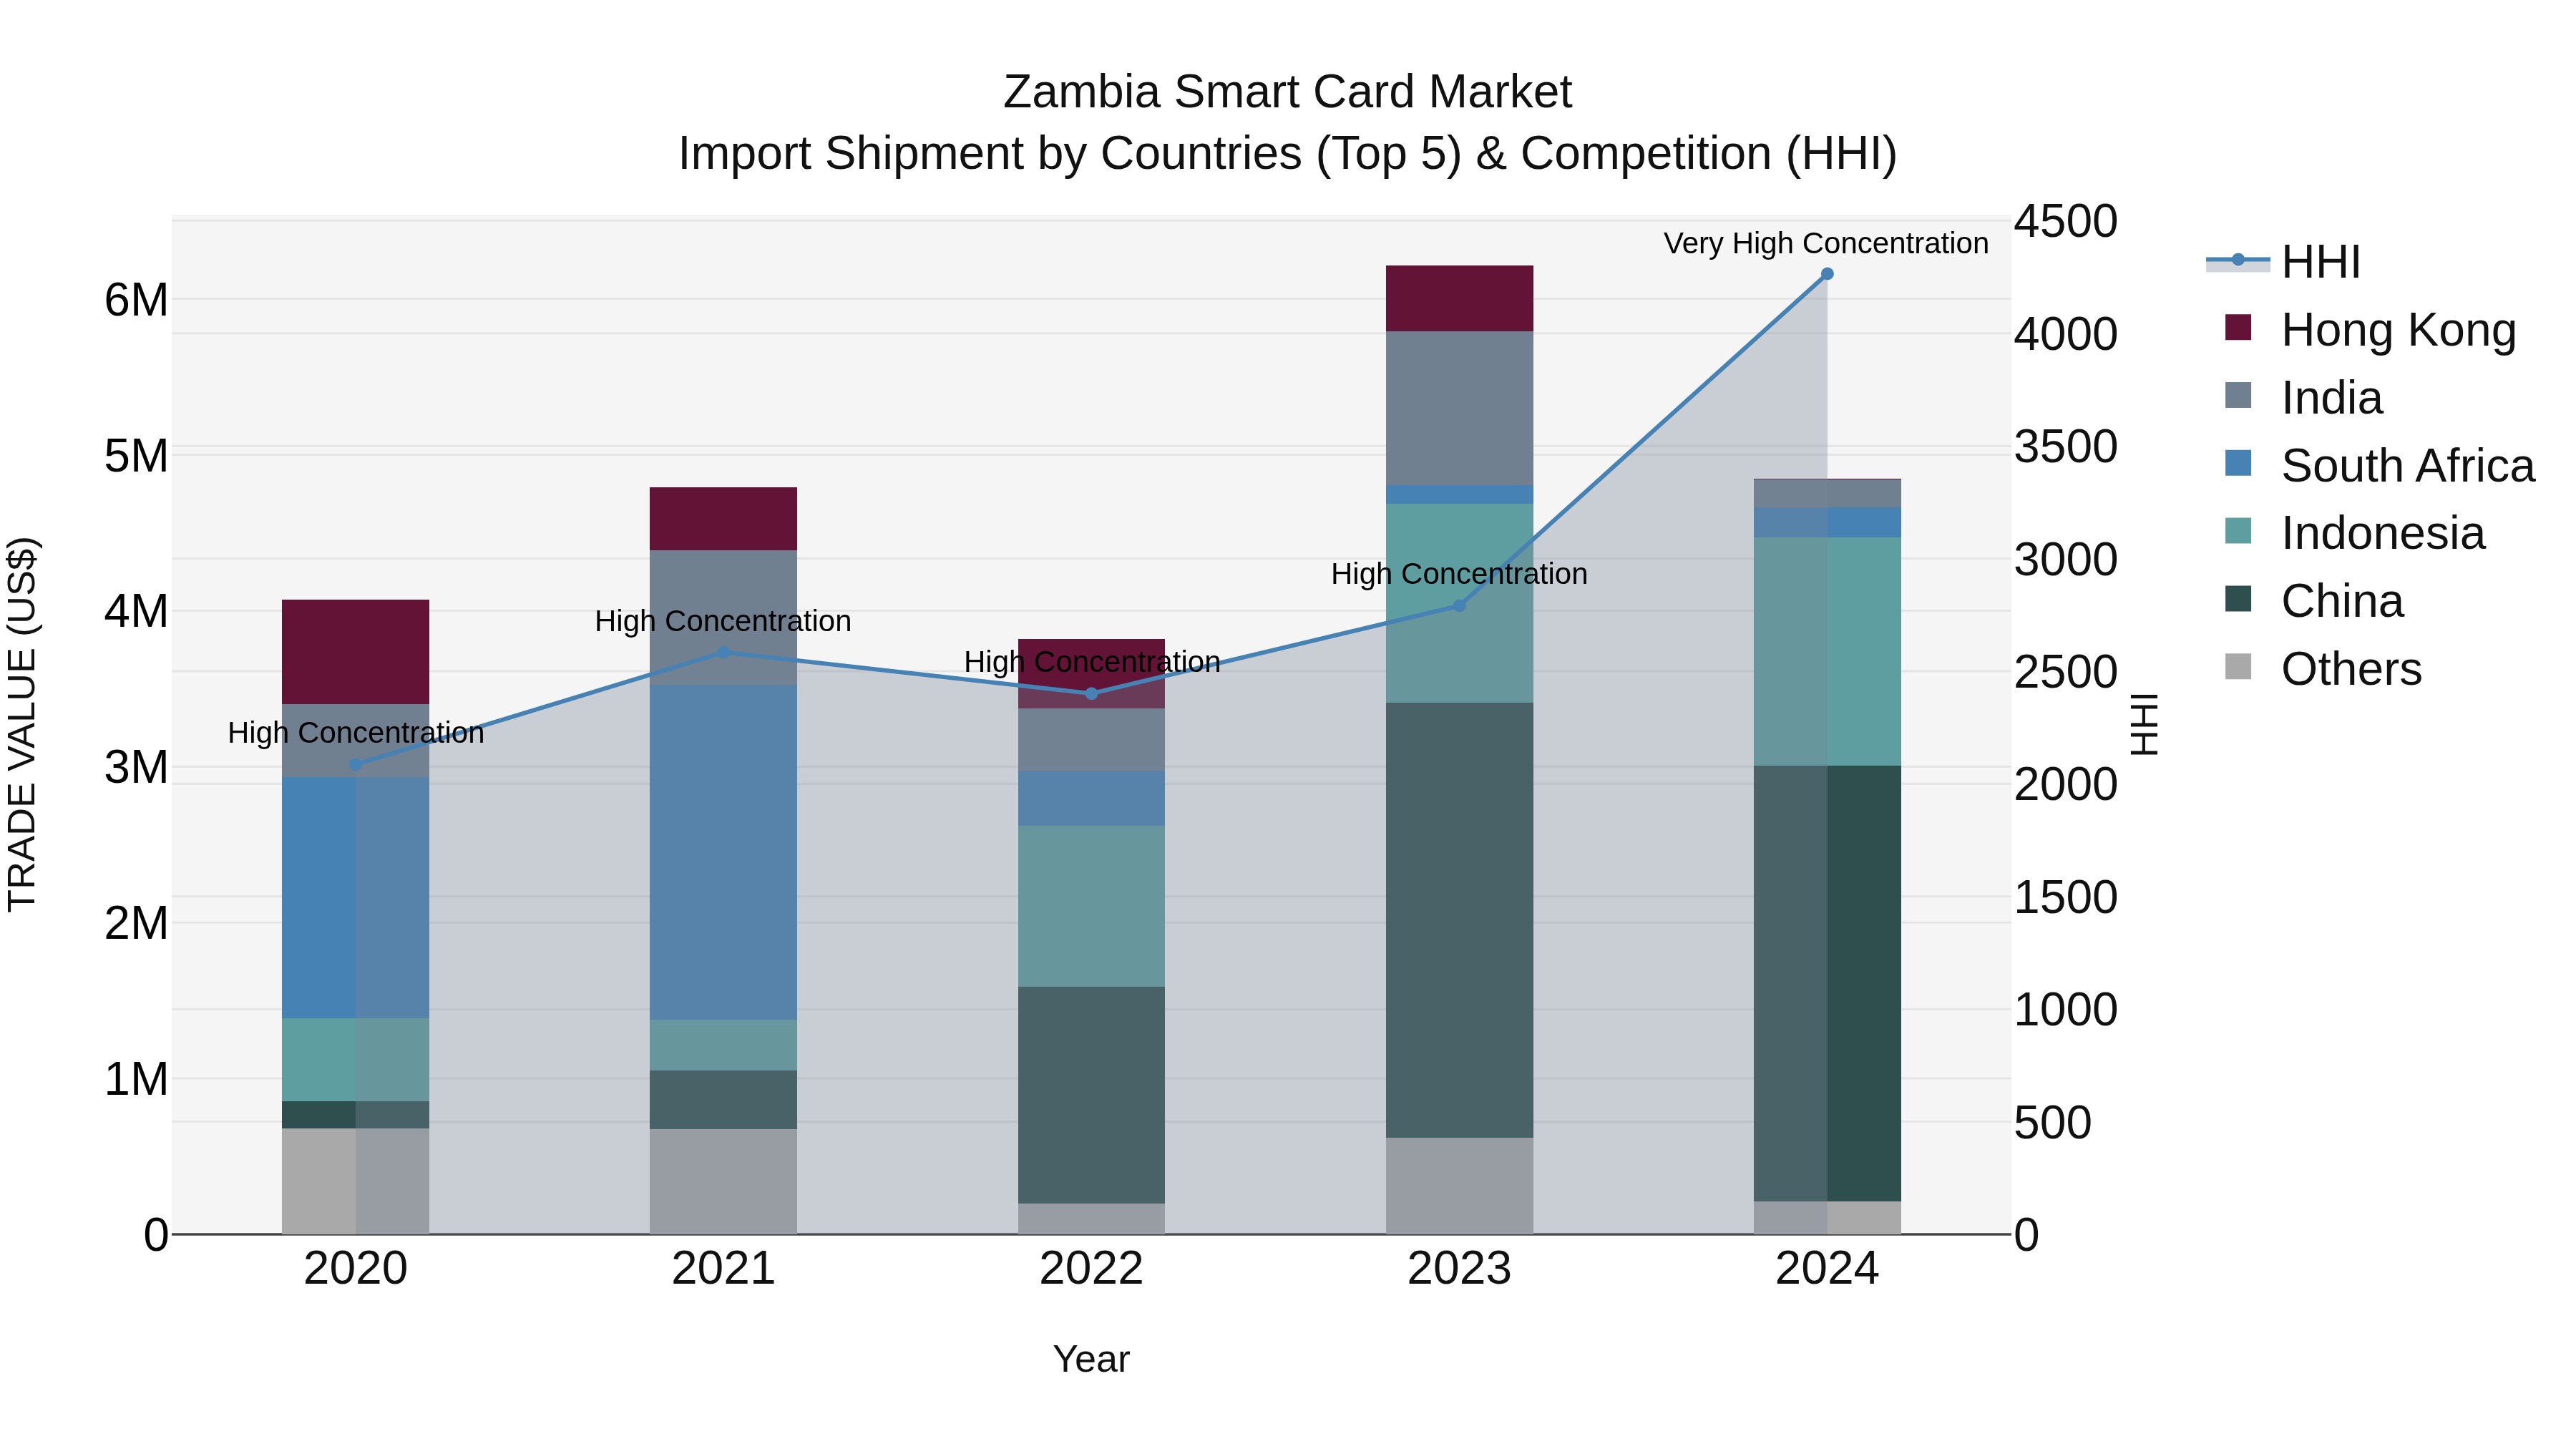
Zambia Smart Card Market: Top 5 Importing Countries and Market Competition (HHI) Analysis
The smart card import market in Zambia continues to be dominated by key exporters such as China, Indonesia, South Africa, India, and the United Arab Emirates. The high concentration levels observed in 2023 have intensified in 2024, indicating a competitive landscape with limited diversification. Despite a moderate cumulative annual growth rate of 4.44% from 2020 to 2024, there was a significant decline in growth from 2023 to 2024 at -22.03%. This shift highlights potential challenges or shifts in demand within the market. Stakeholders should closely monitor these trends to adapt their strategies accordingly.
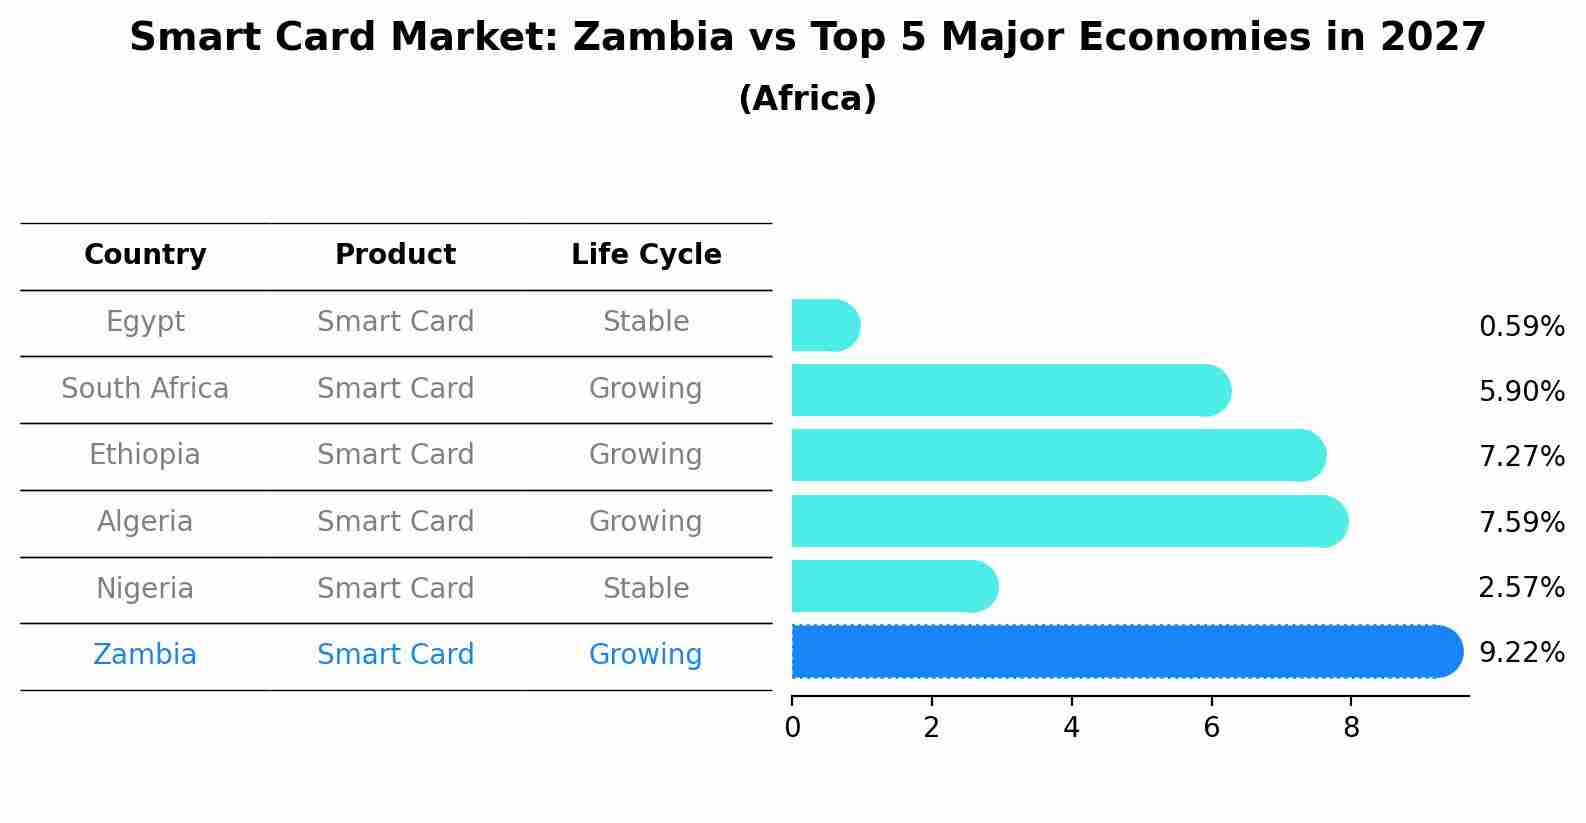
Smart Card Market: Zambia vs Top 5 Major Economies in 2027 (Africa)
By 2027, the Smart Card market in Zambia is anticipated to reach a growth rate of 9.22%, as part of an increasingly competitive Africa region, where Egypt remains at the forefront, supported by South Africa, Ethiopia, Algeria and Nigeria, driving innovations and market adoption across sectors.
Key Highlights of the Report:
- Zambia Smart Card Market Outlook
- Market Size of Zambia Smart Card Market, 2025
- Forecast of Zambia Smart Card Market, 2032
- Historical Data and Forecast of Zambia Smart Card Revenues & Volume for the Period 2022 - 2032F
- Zambia Smart Card Market Trend Evolution
- Zambia Smart Card Market Drivers and Challenges
- Zambia Smart Card Price Trends
- Zambia Smart Card Porter`s Five Forces
- Zambia Smart Card Industry Life Cycle
- Historical Data and Forecast of Zambia Smart Card Market Revenues & Volume By Types for the Period 2022 - 2032F
- Historical Data and Forecast of Zambia Smart Card Market Revenues & Volume By Contact Cards for the Period 2022 - 2032F
- Historical Data and Forecast of Zambia Smart Card Market Revenues & Volume By Contactless cards for the Period 2022 - 2032F
- Historical Data and Forecast of Zambia Smart Card Market Revenues & Volume By Multi-component cards for the Period 2022 - 2032F
- Historical Data and Forecast of Zambia Smart Card Market Revenues & Volume By Component for the Period 2022 - 2032F
- Historical Data and Forecast of Zambia Smart Card Market Revenues & Volume By Memory-based for the Period 2022 - 2032F
- Historical Data and Forecast of Zambia Smart Card Market Revenues & Volume By Microcontroller-based for the Period 2022 - 2032F
- Historical Data and Forecast of Zambia Smart Card Market Revenues & Volume By Application for the Period 2022 - 2032F
- Historical Data and Forecast of Zambia Smart Card Market Revenues & Volume By BFSI for the Period 2022 - 2032F
- Historical Data and Forecast of Zambia Smart Card Market Revenues & Volume By Government for the Period 2022 - 2032F
- Historical Data and Forecast of Zambia Smart Card Market Revenues & Volume By Telecommunication for the Period 2022 - 2032F
- Historical Data and Forecast of Zambia Smart Card Market Revenues & Volume By Retail for the Period 2022 - 2032F
- Historical Data and Forecast of Zambia Smart Card Market Revenues & Volume By Healthcare for the Period 2022 - 2032F
- Historical Data and Forecast of Zambia Smart Card Market Revenues & Volume By Hospitality for the Period 2022 - 2032F
- Historical Data and Forecast of Zambia Smart Card Market Revenues & Volume By Others for the Period 2022 - 2032F
- Zambia Smart Card Import Export Trade Statistics
- Market Opportunity Assessment By Types
- Market Opportunity Assessment By Component
- Market Opportunity Assessment By Application
- Zambia Smart Card Top Companies Market Share
- Zambia Smart Card Competitive Benchmarking By Technical and Operational Parameters
- Zambia Smart Card Company Profiles
- Zambia Smart Card Key Strategic Recommendations
Frequently Asked Questions About the Market Study (FAQs):
6Wresearch actively monitors the Zambia Smart Card Market and publishes its comprehensive annual report, highlighting emerging trends, growth drivers, revenue analysis, and forecast outlook. Our insights help businesses to make data-backed strategic decisions with ongoing market dynamics. Our analysts track relevent industries related to the Zambia Smart Card Market, allowing our clients with actionable intelligence and reliable forecasts tailored to emerging regional needs.
Yes, we provide customisation as per your requirements. To learn more, feel free to contact us on sales@6wresearch.com
1 Executive Summary |
2 Introduction |
2.1 Key Highlights of the Report |
2.2 Report Description |
2.3 Market Scope & Segmentation |
2.4 Research Methodology |
2.5 Assumptions |
3 Zambia Smart Card Market Overview |
3.1 Zambia Country Macro Economic Indicators |
3.2 Zambia Smart Card Market Revenues & Volume, 2022 & 2032F |
3.3 Zambia Smart Card Market - Industry Life Cycle |
3.4 Zambia Smart Card Market - Porter's Five Forces |
3.5 Zambia Smart Card Market Revenues & Volume Share Segmentations, 2022 & 2032F |
3.6 Zambia Smart Card Market Revenues & Volume Share, By Component, 2022 & 2032F |
3.7 Zambia Smart Card Market Revenues & Volume Share, By Application, 2022 & 2032F |
4 Zambia Smart Card Market Dynamics |
4.1 Impact Analysis |
4.2 Market Drivers |
4.2.1 Increasing government initiatives for digital transformation and e-governance projects. |
4.2.2 Growing adoption of contactless payment solutions and digital wallets. |
4.2.3 Rising demand for secure identification and authentication solutions. |
4.3 Market Restraints |
4.3.1 High initial investment costs associated with smart card implementation. |
4.3.2 Lack of awareness and infrastructure in remote areas may hinder market growth. |
4.3.3 Concerns regarding data security and privacy issues. |
5 Zambia Smart Card Market Trends |
6 Zambia Smart Card Market Segmentations |
6.1 Zambia Smart Card Market Segmentations |
6.1.1 Overview and Analysis |
6.1.2 Zambia Smart Card Market Revenues & Volume, By Contact Cards, 2022 - 2032F |
6.1.3 Zambia Smart Card Market Revenues & Volume, By Contactless cards, 2022 - 2032F |
6.1.4 Zambia Smart Card Market Revenues & Volume, By Multi-component cards, 2022 - 2032F |
6.2 Zambia Smart Card Market, By Component |
6.2.1 Overview and Analysis |
6.2.2 Zambia Smart Card Market Revenues & Volume, By Memory-based, 2022 - 2032F |
6.2.3 Zambia Smart Card Market Revenues & Volume, By Microcontroller-based, 2022 - 2032F |
6.3 Zambia Smart Card Market, By Application |
6.3.1 Overview and Analysis |
6.3.2 Zambia Smart Card Market Revenues & Volume, By BFSI, 2022 - 2032F |
6.3.3 Zambia Smart Card Market Revenues & Volume, By Government, 2022 - 2032F |
6.3.4 Zambia Smart Card Market Revenues & Volume, By Telecommunication, 2022 - 2032F |
6.3.5 Zambia Smart Card Market Revenues & Volume, By Retail, 2022 - 2032F |
6.3.6 Zambia Smart Card Market Revenues & Volume, By Healthcare, 2022 - 2032F |
6.3.7 Zambia Smart Card Market Revenues & Volume, By Hospitality, 2022 - 2032F |
7 Zambia Smart Card Market Import-Export Trade Statistics |
7.1 Zambia Smart Card Market Export to Major Countries |
7.2 Zambia Smart Card Market Imports from Major Countries |
8 Zambia Smart Card Market Key Performance Indicators |
8.1 Percentage increase in the number of government projects adopting smart card technology. |
8.2 Growth in the usage of contactless payment transactions in Zambia. |
8.3 Number of new partnerships and collaborations between smart card providers and local businesses. |
9 Zambia Smart Card Market - Opportunity Assessment |
9.1 Zambia Smart Card Market Opportunity Assessment Segmentations, 2022 & 2032F |
9.2 Zambia Smart Card Market Opportunity Assessment, By Component, 2022 & 2032F |
9.3 Zambia Smart Card Market Opportunity Assessment, By Application, 2022 & 2032F |
10 Zambia Smart Card Market - Competitive Landscape |
10.1 Zambia Smart Card Market Revenue Share, By Companies, 2025 |
10.2 Zambia Smart Card Market Competitive Benchmarking, By Operating and Technical Parameters |
11 Company Profiles |
12 Recommendations | 13 Disclaimer |
Export potential assessment - trade Analytics for 2030
Export potential enables firms to identify high-growth global markets with greater confidence by combining advanced trade intelligence with a structured quantitative methodology. The framework analyzes emerging demand trends and country-level import patterns while integrating macroeconomic and trade datasets such as GDP and population forecasts, bilateral import–export flows, tariff structures, elasticity differentials between developed and developing economies, geographic distance, and import demand projections. Using weighted trade values from 2020–2024 as the base period to project country-to-country export potential for 2030, these inputs are operationalized through calculated drivers such as gravity model parameters, tariff impact factors, and projected GDP per-capita growth. Through an analysis of hidden potentials, demand hotspots, and market conditions that are most favorable to success, this method enables firms to focus on target countries, maximize returns, and global expansion with data, backed by accuracy.
By factoring in the projected importer demand gap that is currently unmet and could be potential opportunity, it identifies the potential for the Exporter (Country) among 190 countries, against the general trade analysis, which identifies the biggest importer or exporter.
To discover high-growth global markets and optimize your business strategy:
Click Here
Pricing
- Single User License$ 1,995
- Department License$ 2,400
- Site License$ 3,120
- Global License$ 3,795

Search
Thought Leadership and Analyst Meet


Our Clients
Latest Reports
- India Ultrasonic Smart Water Meter Market (2026-2032) | Outlook, Competition, Drivers, Trends, Demand, Competitive, Strategic Insights, Companies, Challenges, Strategy, Consumer Insights, Analysis, Opportunities, Growth, Size, Share, Industry, Revenue, Segments, Value, Segmentation, Supply, Forecast, Restraints,
- India Electromagnetic Bulk Flow Meter Market (2026-2032) | Analysis, Challenges, Strategic Insights, Supply, Forecast, Growth, Share, Consumer Insights, Competitive, Value, Outlook, Size & Demand,
- India Battery Powered Bulk Flow Meter Market (2026-2032) | Outlook, Analysis, Competitive Landscape, Growth, Size, Trends, Value, Revenue, Companies, Segmentation, Share & Forecast
- Bosnia and Herzegovina Fuel-Efficient Winglets Market (2026-2032) | Growth, Competition, Strategy, Restraints, Trends, Challenges, segmentation, Value, Outlook, Investment Opportunities, Analysis, Revenue, Companies, Insights, Pricing, Size, Drivers, Demand, Share, Forecast
- Canada Cloud CFD Market (2026-2032) | Size & Revenue, Industry, Growth, Competitive Landscape, Forecast, Segmentation, Value, Outlook, Trends, Share, Analysis, Companies
- Taiwan Food Delivery Platform Market (2026-2032) | Companies, Outlook, Analysis, Trends, Value, Revenue, Segmentation, Share, Forecast, Competitive Landscape, Growth, Size & Forecast
- United Kingdom (UK) Long-term Care Insurance Market (2026-2032) | Growth, Share, Consumer Insights, Drivers, Opportunities, Competition, Pricing Analysis, Segments, Restraints, Companies, Competitive, Value, Outlook, Size, Demand, Analysis, Challenges, Strategic Insights, Investment Trends, Revenue, Trends, Supply, Forecast
- United Kingdom (UK) Long Term Care Market (2026-2032) | Companies, Outlook, Analysis, Trends, Value, Revenue, Segmentation, Share, Forecast, Competitive Landscape, Growth, Size & Forecast
- Iraq Insulation and Waterproofing Market (2026-2032) | Outlook, Drivers, Growth, Size, Share, Industry, Revenue, Trends, Demand, Competitive, Strategic Insights, Opportunities, Segments, Companies, Challenges, Strategy, Consumer Insights, Analysis, Investment Trends, Value, Segmentation, Forecast, Restraints
- India Switchgear Market Outlook (2026-2032) | Size, Share, Trends, Growth, Revenue, Forecast, Analysis, Value, Outlook
Industry Events and Analyst Meet

India EV Show 2026

EV tech India Expo 2026

Auto Tech Asia 2026

Battery Tech India 2026

Smart Production Solutions Guangzhou 2026
Whitepaper
- Middle East & Africa Commercial Security Market Click here to view more.
- Middle East & Africa Fire Safety Systems & Equipment Market Click here to view more.
- GCC Drone Market Click here to view more.
- Middle East Lighting Fixture Market Click here to view more.
- GCC Physical & Perimeter Security Market Click here to view more.
6WResearch In News
- Doha a strategic location for EV manufacturing hub: IPA Qatar
- Demand for luxury TVs surging in the GCC, says Samsung
- Empowering Growth: The Thriving Journey of Bangladesh’s Cable Industry
- Demand for luxury TVs surging in the GCC, says Samsung
- Video call with a traditional healer? Once unthinkable, it’s now common in South Africa
- Intelligent Buildings To Smooth GCC’s Path To Net Zero