Zambia Sweet Spread Market (2026-2032) | Restraints, Segmentation, Value, Investment Trends, Challenges, Supply, Consumer Insights, Industry, Analysis, Competitive, Pricing Analysis, Companies, Trends, Outlook, Strategic Insights, Competition, Revenue, Strategy, Share, Segments, Demand, Growth, Size, Drivers, Opportunities, Forecast
Market Forecast By Product Type (Honey Spread, Nutbased Spread, Fruitbased Spread), By Flavor (Natural Sweeteners, Chocolate Hazelnut, Strawberry Jam), By Packaging (Glass Jars, Plastic Containers, Tub Packaging), By End User (Retailers, Supermarkets, Online Retailers) And Competitive Landscape
| Product Code: ETC10883962 | Publication Date: Apr 2025 | Updated Date: Apr 2026 | Product Type: Market Research Report | |
| Publisher: 6Wresearch | Author: Bhawna Singh | No. of Pages: 65 | No. of Figures: 34 | No. of Tables: 19 |
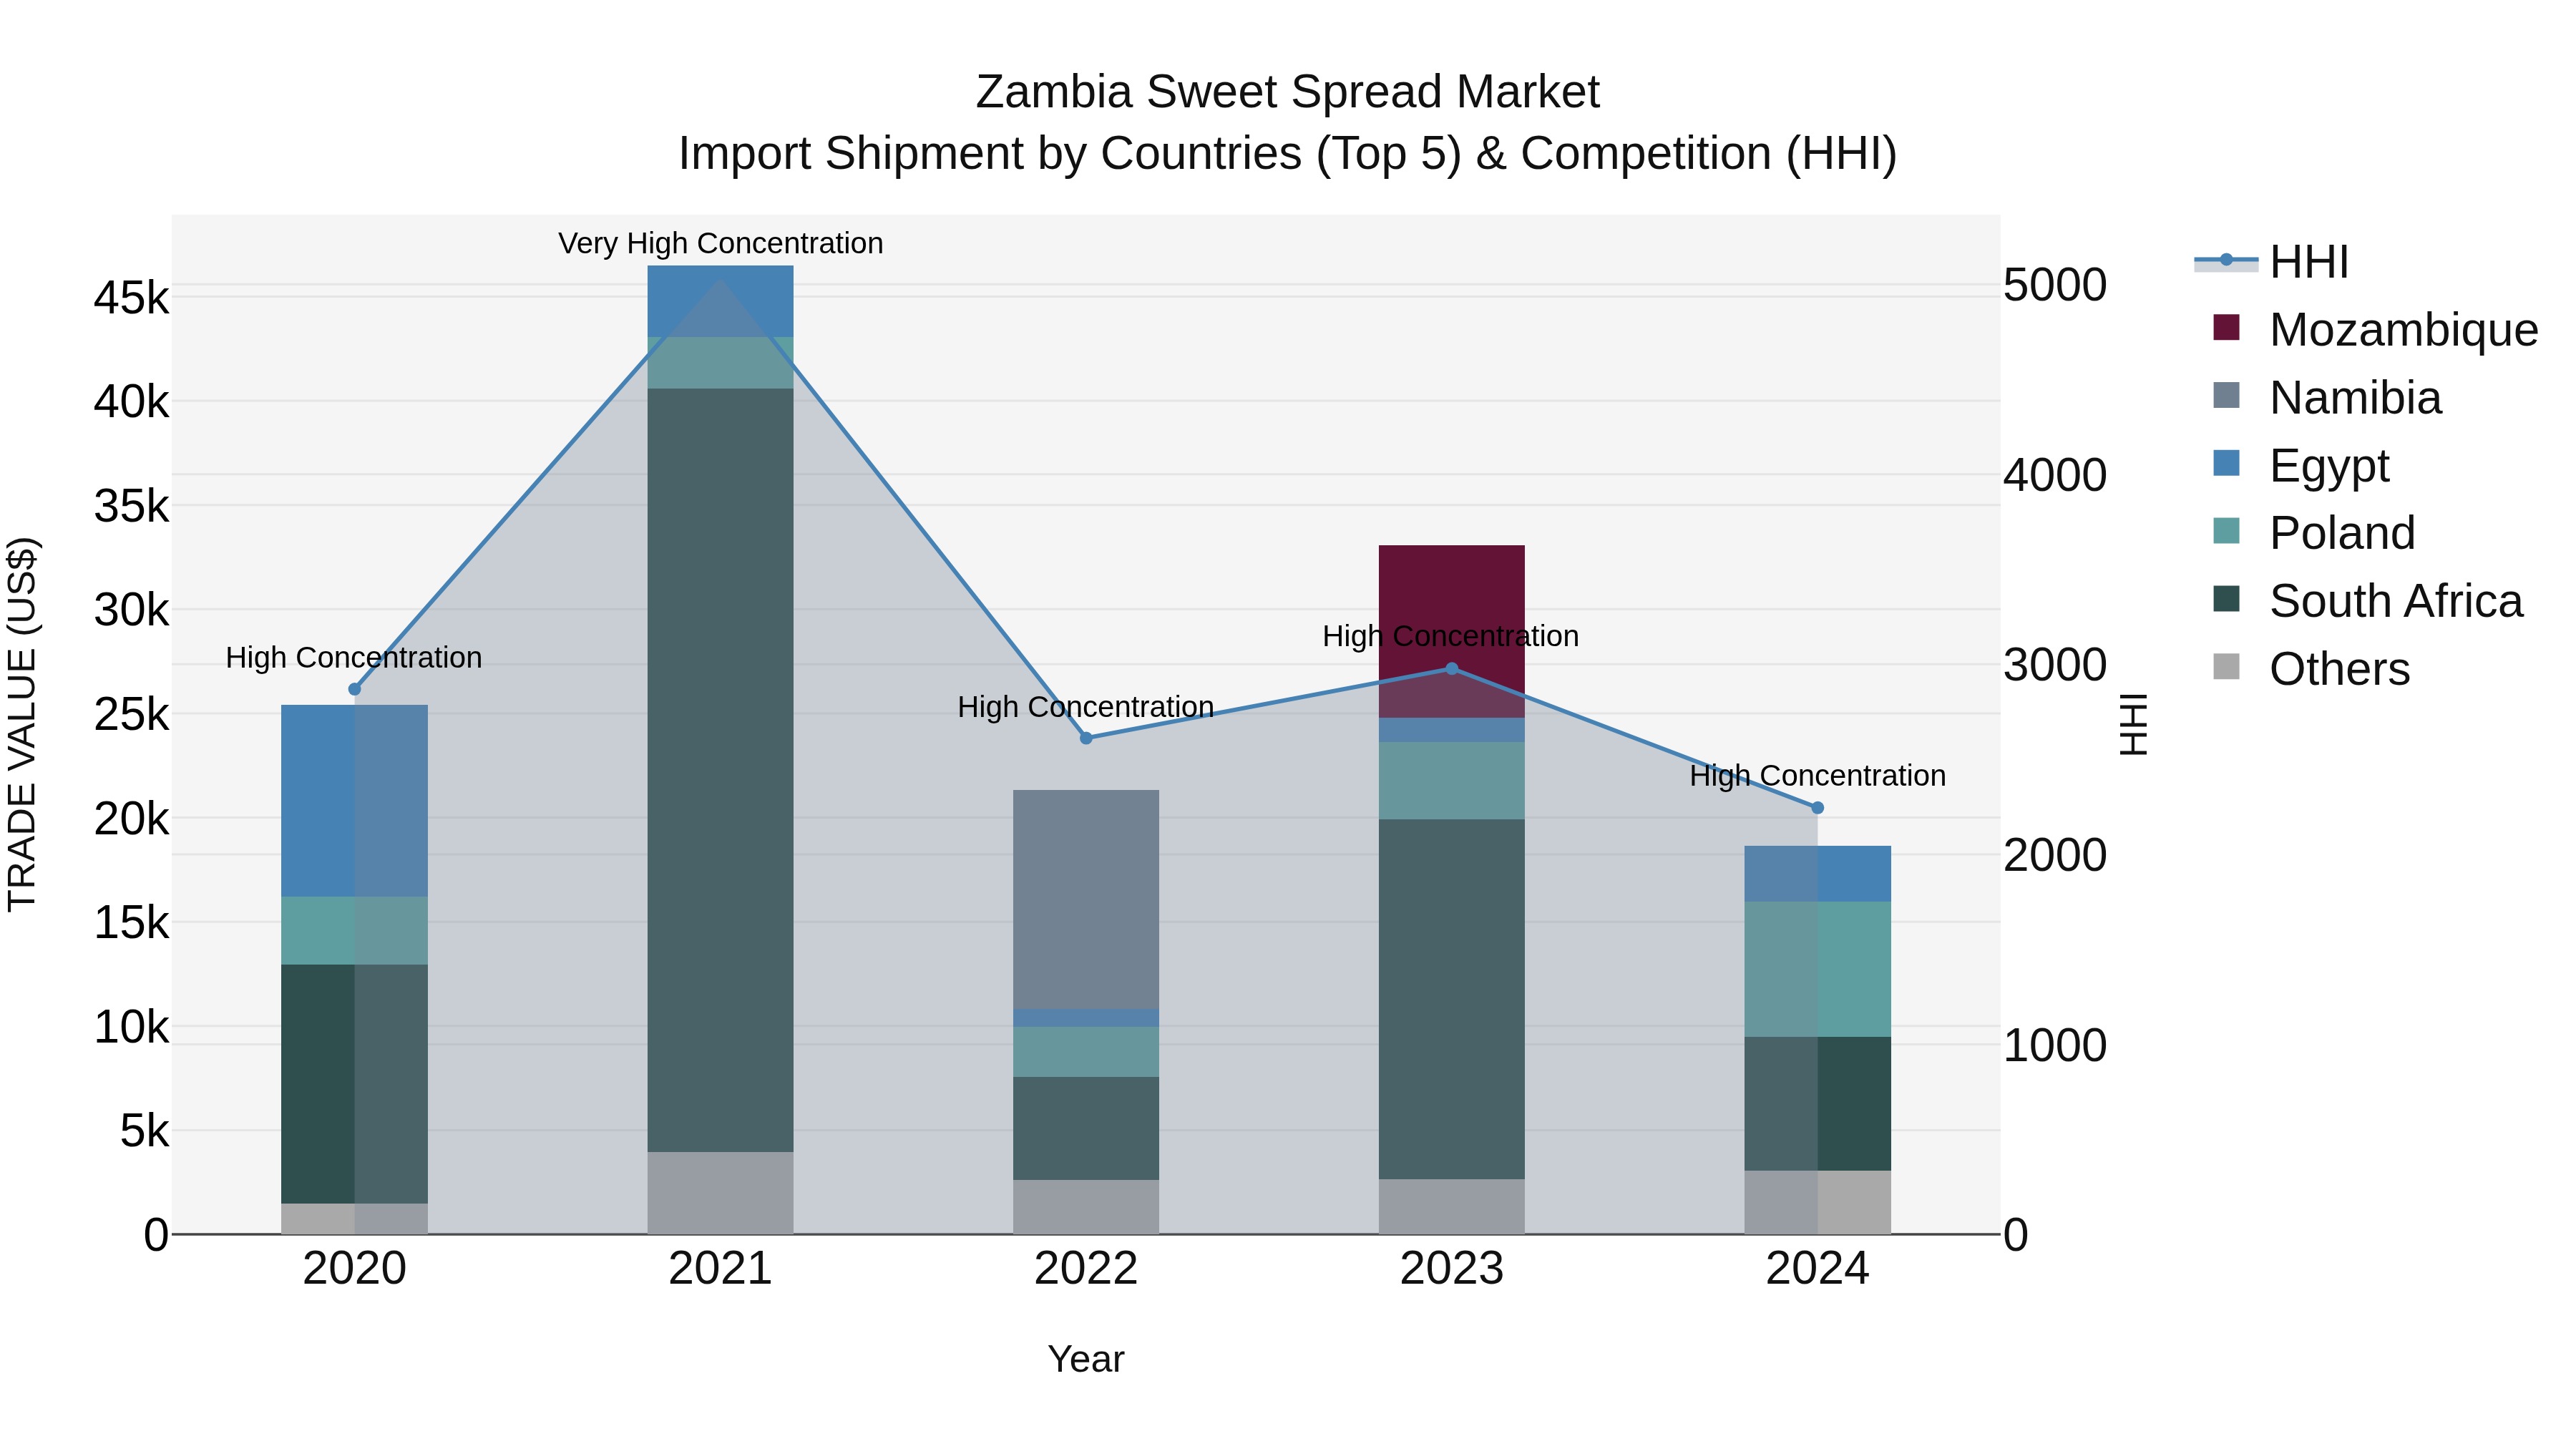
Zambia Sweet Spread Market: Top 5 Importing Countries and Market Competition (HHI) Analysis
Despite a decline in the growth rate of sweet spread imports to Zambia in 2024, the market remains highly concentrated, with top exporters being Poland, South Africa, Egypt, Italy, and China. The negative Compound Annual Growth Rate (CAGR) indicates a challenging period for the industry from 2020 to 2024. However, the significant decrease in growth rate from 2023 to 2024 highlights potential shifts in the market dynamics. Stakeholders should closely monitor these trends to adapt strategies and capitalize on emerging opportunities in the Zambian sweet spread import market.
Key Highlights of the Report:
- Zambia Sweet Spread Market Outlook
- Market Size of Zambia Sweet Spread Market, 2025
- Forecast of Zambia Sweet Spread Market, 2032
- Historical Data and Forecast of Zambia Sweet Spread Revenues & Volume for the Period 2022 - 2032F
- Zambia Sweet Spread Market Trend Evolution
- Zambia Sweet Spread Market Drivers and Challenges
- Zambia Sweet Spread Price Trends
- Zambia Sweet Spread Porter's Five Forces
- Zambia Sweet Spread Industry Life Cycle
- Historical Data and Forecast of Zambia Sweet Spread Market Revenues & Volume By Product Type for the Period 2022 - 2032F
- Historical Data and Forecast of Zambia Sweet Spread Market Revenues & Volume By Honey Spread for the Period 2022 - 2032F
- Historical Data and Forecast of Zambia Sweet Spread Market Revenues & Volume By Nutbased Spread for the Period 2022 - 2032F
- Historical Data and Forecast of Zambia Sweet Spread Market Revenues & Volume By Fruitbased Spread for the Period 2022 - 2032F
- Historical Data and Forecast of Zambia Sweet Spread Market Revenues & Volume By Flavor for the Period 2022 - 2032F
- Historical Data and Forecast of Zambia Sweet Spread Market Revenues & Volume By Natural Sweeteners for the Period 2022 - 2032F
- Historical Data and Forecast of Zambia Sweet Spread Market Revenues & Volume By Chocolate Hazelnut for the Period 2022 - 2032F
- Historical Data and Forecast of Zambia Sweet Spread Market Revenues & Volume By Strawberry Jam for the Period 2022 - 2032F
- Historical Data and Forecast of Zambia Sweet Spread Market Revenues & Volume By Packaging for the Period 2022 - 2032F
- Historical Data and Forecast of Zambia Sweet Spread Market Revenues & Volume By Glass Jars for the Period 2022 - 2032F
- Historical Data and Forecast of Zambia Sweet Spread Market Revenues & Volume By Plastic Containers for the Period 2022 - 2032F
- Historical Data and Forecast of Zambia Sweet Spread Market Revenues & Volume By Tub Packaging for the Period 2022 - 2032F
- Historical Data and Forecast of Zambia Sweet Spread Market Revenues & Volume By End User for the Period 2022 - 2032F
- Historical Data and Forecast of Zambia Sweet Spread Market Revenues & Volume By Retailers for the Period 2022 - 2032F
- Historical Data and Forecast of Zambia Sweet Spread Market Revenues & Volume By Supermarkets for the Period 2022 - 2032F
- Historical Data and Forecast of Zambia Sweet Spread Market Revenues & Volume By Online Retailers for the Period 2022 - 2032F
- Zambia Sweet Spread Import Export Trade Statistics
- Market Opportunity Assessment By Product Type
- Market Opportunity Assessment By Flavor
- Market Opportunity Assessment By Packaging
- Market Opportunity Assessment By End User
- Zambia Sweet Spread Top Companies Market Share
- Zambia Sweet Spread Competitive Benchmarking By Technical and Operational Parameters
- Zambia Sweet Spread Company Profiles
- Zambia Sweet Spread Key Strategic Recommendations
Frequently Asked Questions About the Market Study (FAQs):
6Wresearch actively monitors the Zambia Sweet Spread Market and publishes its comprehensive annual report, highlighting emerging trends, growth drivers, revenue analysis, and forecast outlook. Our insights help businesses to make data-backed strategic decisions with ongoing market dynamics. Our analysts track relevent industries related to the Zambia Sweet Spread Market, allowing our clients with actionable intelligence and reliable forecasts tailored to emerging regional needs.
Yes, we provide customisation as per your requirements. To learn more, feel free to contact us on sales@6wresearch.com
1 Executive Summary |
2 Introduction |
2.1 Key Highlights of the Report |
2.2 Report Description |
2.3 Market Scope & Segmentation |
2.4 Research Methodology |
2.5 Assumptions |
3 Zambia Sweet Spread Market Overview |
3.1 Zambia Country Macro Economic Indicators |
3.2 Zambia Sweet Spread Market Revenues & Volume, 2022 & 2032F |
3.3 Zambia Sweet Spread Market - Industry Life Cycle |
3.4 Zambia Sweet Spread Market - Porter's Five Forces |
3.5 Zambia Sweet Spread Market Revenues & Volume Share, By Product Type, 2022 & 2032F |
3.6 Zambia Sweet Spread Market Revenues & Volume Share, By Flavor, 2022 & 2032F |
3.7 Zambia Sweet Spread Market Revenues & Volume Share, By Packaging, 2022 & 2032F |
3.8 Zambia Sweet Spread Market Revenues & Volume Share, By End User, 2022 & 2032F |
4 Zambia Sweet Spread Market Dynamics |
4.1 Impact Analysis |
4.2 Market Drivers |
4.2.1 Increasing disposable income of consumers in Zambia leading to higher spending on food products. |
4.2.2 Growing urbanization and changing consumer lifestyles favoring convenience food products like sweet spreads. |
4.2.3 Rising trend of breakfast consumption and snacking culture driving demand for sweet spreads. |
4.3 Market Restraints |
4.3.1 Fluctuating prices of key ingredients such as sugar and nuts impacting the production cost of sweet spreads. |
4.3.2 Health concerns related to high sugar content in sweet spreads leading to shifts towards healthier alternatives. |
4.3.3 Competition from substitute products like jams, jellies, and chocolate spreads affecting market penetration. |
5 Zambia Sweet Spread Market Trends |
6 Zambia Sweet Spread Market, By Types |
6.1 Zambia Sweet Spread Market, By Product Type |
6.1.1 Overview and Analysis |
6.1.2 Zambia Sweet Spread Market Revenues & Volume, By Product Type, 2022 - 2032F |
6.1.3 Zambia Sweet Spread Market Revenues & Volume, By Honey Spread, 2022 - 2032F |
6.1.4 Zambia Sweet Spread Market Revenues & Volume, By Nutbased Spread, 2022 - 2032F |
6.1.5 Zambia Sweet Spread Market Revenues & Volume, By Fruitbased Spread, 2022 - 2032F |
6.2 Zambia Sweet Spread Market, By Flavor |
6.2.1 Overview and Analysis |
6.2.2 Zambia Sweet Spread Market Revenues & Volume, By Natural Sweeteners, 2022 - 2032F |
6.2.3 Zambia Sweet Spread Market Revenues & Volume, By Chocolate Hazelnut, 2022 - 2032F |
6.2.4 Zambia Sweet Spread Market Revenues & Volume, By Strawberry Jam, 2022 - 2032F |
6.3 Zambia Sweet Spread Market, By Packaging |
6.3.1 Overview and Analysis |
6.3.2 Zambia Sweet Spread Market Revenues & Volume, By Glass Jars, 2022 - 2032F |
6.3.3 Zambia Sweet Spread Market Revenues & Volume, By Plastic Containers, 2022 - 2032F |
6.3.4 Zambia Sweet Spread Market Revenues & Volume, By Tub Packaging, 2022 - 2032F |
6.4 Zambia Sweet Spread Market, By End User |
6.4.1 Overview and Analysis |
6.4.2 Zambia Sweet Spread Market Revenues & Volume, By Retailers, 2022 - 2032F |
6.4.3 Zambia Sweet Spread Market Revenues & Volume, By Supermarkets, 2022 - 2032F |
6.4.4 Zambia Sweet Spread Market Revenues & Volume, By Online Retailers, 2022 - 2032F |
7 Zambia Sweet Spread Market Import-Export Trade Statistics |
7.1 Zambia Sweet Spread Market Export to Major Countries |
7.2 Zambia Sweet Spread Market Imports from Major Countries |
8 Zambia Sweet Spread Market Key Performance Indicators |
8.1 Consumer engagement on social media platforms promoting sweet spreads. |
8.2 Number of new product launches and innovations in the sweet spread market. |
8.3 Percentage growth in online sales of sweet spreads. |
8.4 Customer satisfaction and retention rates for various sweet spread brands. |
8.5 Market penetration in rural areas and smaller towns of Zambia. |
9 Zambia Sweet Spread Market - Opportunity Assessment |
9.1 Zambia Sweet Spread Market Opportunity Assessment, By Product Type, 2022 & 2032F |
9.2 Zambia Sweet Spread Market Opportunity Assessment, By Flavor, 2022 & 2032F |
9.3 Zambia Sweet Spread Market Opportunity Assessment, By Packaging, 2022 & 2032F |
9.4 Zambia Sweet Spread Market Opportunity Assessment, By End User, 2022 & 2032F |
10 Zambia Sweet Spread Market - Competitive Landscape |
10.1 Zambia Sweet Spread Market Revenue Share, By Companies, 2025 |
10.2 Zambia Sweet Spread Market Competitive Benchmarking, By Operating and Technical Parameters |
11 Company Profiles |
12 Recommendations |
13 Disclaimer |
Export potential assessment - trade Analytics for 2030
Export potential enables firms to identify high-growth global markets with greater confidence by combining advanced trade intelligence with a structured quantitative methodology. The framework analyzes emerging demand trends and country-level import patterns while integrating macroeconomic and trade datasets such as GDP and population forecasts, bilateral import–export flows, tariff structures, elasticity differentials between developed and developing economies, geographic distance, and import demand projections. Using weighted trade values from 2020–2024 as the base period to project country-to-country export potential for 2030, these inputs are operationalized through calculated drivers such as gravity model parameters, tariff impact factors, and projected GDP per-capita growth. Through an analysis of hidden potentials, demand hotspots, and market conditions that are most favorable to success, this method enables firms to focus on target countries, maximize returns, and global expansion with data, backed by accuracy.
By factoring in the projected importer demand gap that is currently unmet and could be potential opportunity, it identifies the potential for the Exporter (Country) among 190 countries, against the general trade analysis, which identifies the biggest importer or exporter.
To discover high-growth global markets and optimize your business strategy:
Click Here
Pricing
- Single User License$ 1,995
- Department License$ 2,400
- Site License$ 3,120
- Global License$ 3,795

Search
Thought Leadership and Analyst Meet


Our Clients
Latest Reports
- India Ultrasonic Smart Water Meter Market (2026-2032) | Outlook, Competition, Drivers, Trends, Demand, Competitive, Strategic Insights, Companies, Challenges, Strategy, Consumer Insights, Analysis, Opportunities, Growth, Size, Share, Industry, Revenue, Segments, Value, Segmentation, Supply, Forecast, Restraints,
- India Electromagnetic Bulk Flow Meter Market (2026-2032) | Analysis, Challenges, Strategic Insights, Supply, Forecast, Growth, Share, Consumer Insights, Competitive, Value, Outlook, Size & Demand,
- India Battery Powered Bulk Flow Meter Market (2026-2032) | Outlook, Analysis, Competitive Landscape, Growth, Size, Trends, Value, Revenue, Companies, Segmentation, Share & Forecast
- Bosnia and Herzegovina Fuel-Efficient Winglets Market (2026-2032) | Growth, Competition, Strategy, Restraints, Trends, Challenges, segmentation, Value, Outlook, Investment Opportunities, Analysis, Revenue, Companies, Insights, Pricing, Size, Drivers, Demand, Share, Forecast
- Canada Cloud CFD Market (2026-2032) | Size & Revenue, Industry, Growth, Competitive Landscape, Forecast, Segmentation, Value, Outlook, Trends, Share, Analysis, Companies
- Taiwan Food Delivery Platform Market (2026-2032) | Companies, Outlook, Analysis, Trends, Value, Revenue, Segmentation, Share, Forecast, Competitive Landscape, Growth, Size & Forecast
- United Kingdom (UK) Long-term Care Insurance Market (2026-2032) | Growth, Share, Consumer Insights, Drivers, Opportunities, Competition, Pricing Analysis, Segments, Restraints, Companies, Competitive, Value, Outlook, Size, Demand, Analysis, Challenges, Strategic Insights, Investment Trends, Revenue, Trends, Supply, Forecast
- United Kingdom (UK) Long Term Care Market (2026-2032) | Companies, Outlook, Analysis, Trends, Value, Revenue, Segmentation, Share, Forecast, Competitive Landscape, Growth, Size & Forecast
- Iraq Insulation and Waterproofing Market (2026-2032) | Outlook, Drivers, Growth, Size, Share, Industry, Revenue, Trends, Demand, Competitive, Strategic Insights, Opportunities, Segments, Companies, Challenges, Strategy, Consumer Insights, Analysis, Investment Trends, Value, Segmentation, Forecast, Restraints
- India Switchgear Market Outlook (2026-2032) | Size, Share, Trends, Growth, Revenue, Forecast, Analysis, Value, Outlook
Industry Events and Analyst Meet

India EV Show 2026

EV tech India Expo 2026

Auto Tech Asia 2026

Battery Tech India 2026

Smart Production Solutions Guangzhou 2026
Whitepaper
- Middle East & Africa Commercial Security Market Click here to view more.
- Middle East & Africa Fire Safety Systems & Equipment Market Click here to view more.
- GCC Drone Market Click here to view more.
- Middle East Lighting Fixture Market Click here to view more.
- GCC Physical & Perimeter Security Market Click here to view more.
6WResearch In News
- Doha a strategic location for EV manufacturing hub: IPA Qatar
- Demand for luxury TVs surging in the GCC, says Samsung
- Empowering Growth: The Thriving Journey of Bangladesh’s Cable Industry
- Demand for luxury TVs surging in the GCC, says Samsung
- Video call with a traditional healer? Once unthinkable, it’s now common in South Africa
- Intelligent Buildings To Smooth GCC’s Path To Net Zero