Zambia Washbasin Market (2025-2031) | Outlook, Restraints, Size, Trends, Demand, Share, Strategy, Industry, Supply, Pricing Analysis, Revenue, Value, Segments, Companies, Competitive, Competition, Forecast, Challenges, Segmentation, Growth, Drivers, Consumer Insights, Investment Trends, Opportunities, Analysis, Strategic Insights
Market Forecast By Type (Wall-mounted, Countertop, Pedestal, Under-mount, Smart), By Material Used (Ceramic, Stainless Steel, Glass, Porcelain, Composite), By End User (Residential, Commercial, Hospitality, Healthcare, Industrial), By Application (Bathroom Fixtures, Public Restrooms, Luxury Bathrooms, Hospital Facilities, High-traffic Areas), By End Use (Professional Tattooing, Tattoo Studios) And Competitive Landscape
| Product Code: ETC11295418 | Publication Date: Apr 2025 | Updated Date: Dec 2025 | Product Type: Market Research Report | |
| Publisher: 6Wresearch | Author: Bhawna Singh | No. of Pages: 65 | No. of Figures: 34 | No. of Tables: 19 |
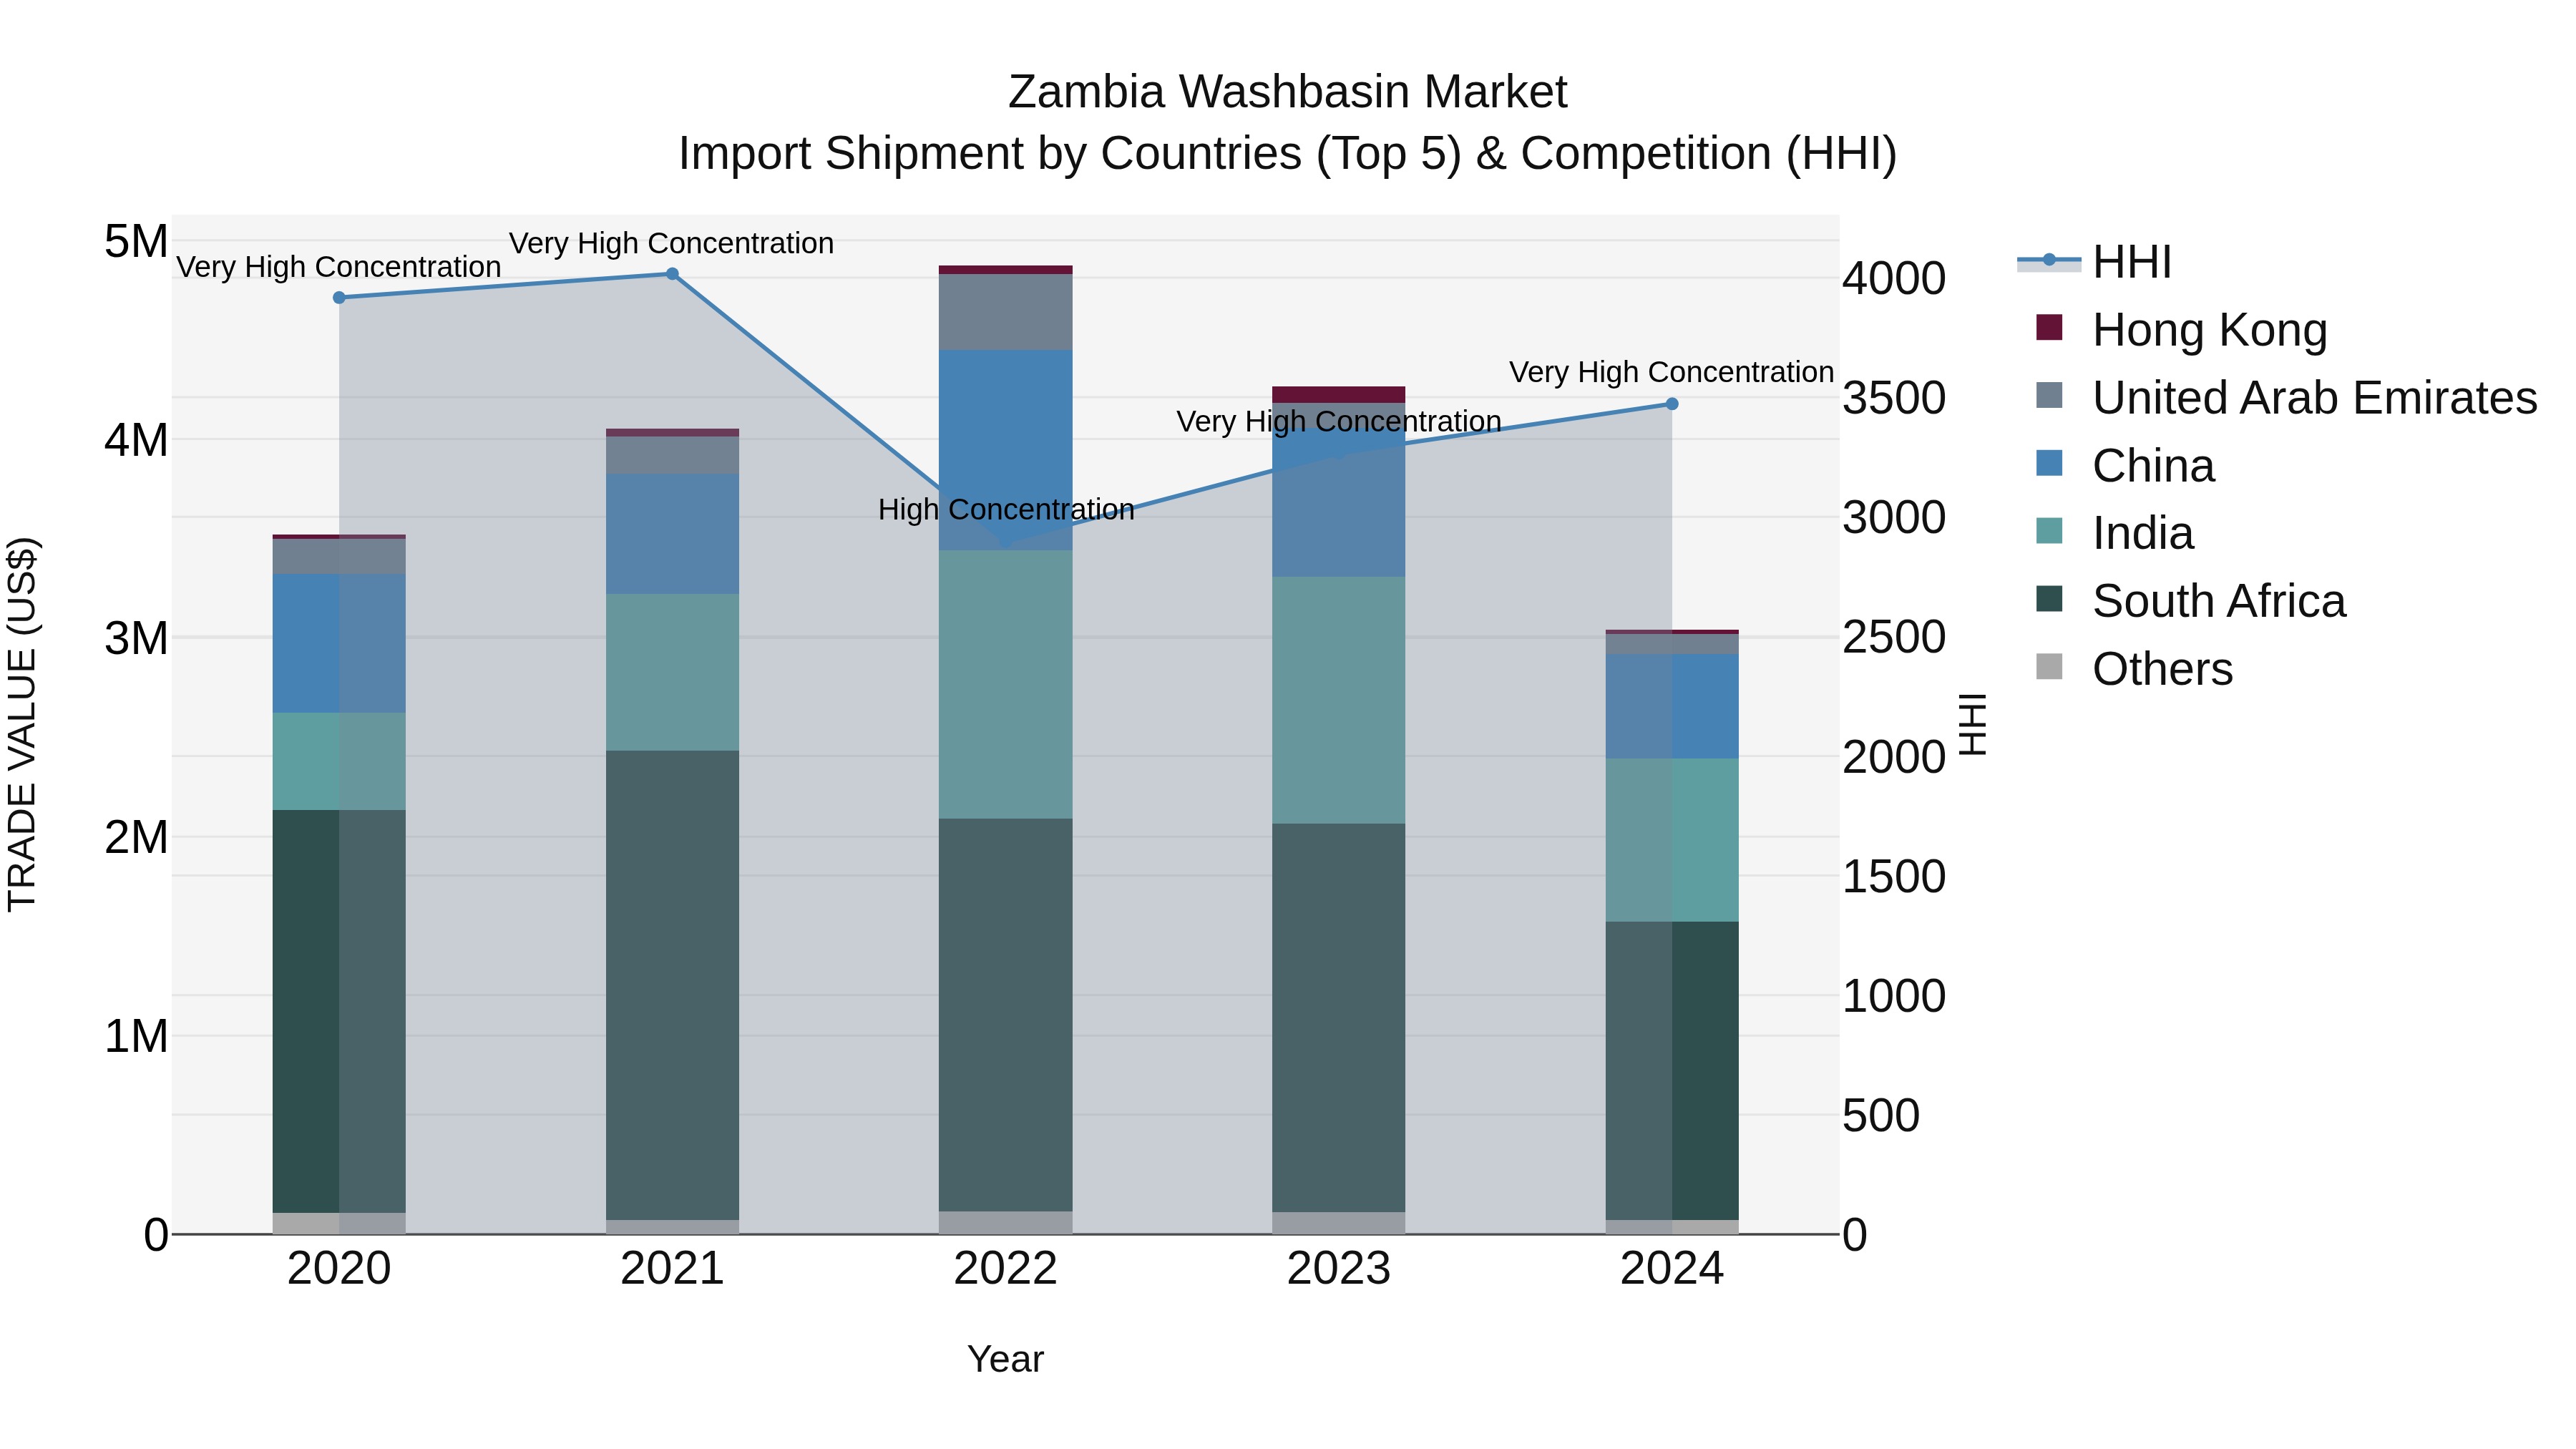
Zambia Washbasin Market: Top 5 Importing Countries and Market Competition (HHI) Analysis
In 2024, Zambia`s washbasin import market continued to be dominated by key suppliers such as South Africa, India, China, United Arab Emirates, and Tanzania. Despite a high Herfindahl-Hirschman Index (HHI) indicating market concentration, the sector experienced a negative compound annual growth rate (CAGR) of -3.6% from 2020 to 2024. The growth rate for 2023-24 further declined by -28.68%, suggesting challenges in the market. Stakeholders should closely monitor these trends and explore strategies to stimulate demand and drive growth in the washbasin import sector in Zambia.
Key Highlights of the Report:
- Zambia Washbasin Market Outlook
- Market Size of Zambia Washbasin Market,2024
- Forecast of Zambia Washbasin Market, 2031
- Historical Data and Forecast of Zambia Washbasin Revenues & Volume for the Period 2021-2031
- Zambia Washbasin Market Trend Evolution
- Zambia Washbasin Market Drivers and Challenges
- Zambia Washbasin Price Trends
- Zambia Washbasin Porter's Five Forces
- Zambia Washbasin Industry Life Cycle
- Historical Data and Forecast of Zambia Washbasin Market Revenues & Volume By Type for the Period 2021-2031
- Historical Data and Forecast of Zambia Washbasin Market Revenues & Volume By Wall-mounted for the Period 2021-2031
- Historical Data and Forecast of Zambia Washbasin Market Revenues & Volume By Countertop for the Period 2021-2031
- Historical Data and Forecast of Zambia Washbasin Market Revenues & Volume By Pedestal for the Period 2021-2031
- Historical Data and Forecast of Zambia Washbasin Market Revenues & Volume By Under-mount for the Period 2021-2031
- Historical Data and Forecast of Zambia Washbasin Market Revenues & Volume By Smart for the Period 2021 - 2029
- Historical Data and Forecast of Zambia Washbasin Market Revenues & Volume By Material Used for the Period 2021-2031
- Historical Data and Forecast of Zambia Washbasin Market Revenues & Volume By Ceramic for the Period 2021-2031
- Historical Data and Forecast of Zambia Washbasin Market Revenues & Volume By Stainless Steel for the Period 2021-2031
- Historical Data and Forecast of Zambia Washbasin Market Revenues & Volume By Glass for the Period 2021-2031
- Historical Data and Forecast of Zambia Washbasin Market Revenues & Volume By Porcelain for the Period 2021-2031
- Historical Data and Forecast of Zambia Washbasin Market Revenues & Volume By Composite for the Period 2021 - 2029
- Historical Data and Forecast of Zambia Washbasin Market Revenues & Volume By End User for the Period 2021-2031
- Historical Data and Forecast of Zambia Washbasin Market Revenues & Volume By Residential for the Period 2021-2031
- Historical Data and Forecast of Zambia Washbasin Market Revenues & Volume By Commercial for the Period 2021-2031
- Historical Data and Forecast of Zambia Washbasin Market Revenues & Volume By Hospitality for the Period 2021-2031
- Historical Data and Forecast of Zambia Washbasin Market Revenues & Volume By Healthcare for the Period 2021-2031
- Historical Data and Forecast of Zambia Washbasin Market Revenues & Volume By Industrial for the Period 2021 - 2029
- Historical Data and Forecast of Zambia Washbasin Market Revenues & Volume By Application for the Period 2021-2031
- Historical Data and Forecast of Zambia Washbasin Market Revenues & Volume By Bathroom Fixtures for the Period 2021-2031
- Historical Data and Forecast of Zambia Washbasin Market Revenues & Volume By Public Restrooms for the Period 2021-2031
- Historical Data and Forecast of Zambia Washbasin Market Revenues & Volume By Luxury Bathrooms for the Period 2021-2031
- Historical Data and Forecast of Zambia Washbasin Market Revenues & Volume By Hospital Facilities for the Period 2021-2031
- Historical Data and Forecast of Zambia Washbasin Market Revenues & Volume By High-traffic Areas for the Period 2021 - 2029
- Historical Data and Forecast of Zambia Washbasin Market Revenues & Volume By End Use for the Period 2021-2031
- Historical Data and Forecast of Zambia Washbasin Market Revenues & Volume By Professional Tattooing for the Period 2021-2031
- Historical Data and Forecast of Zambia Washbasin Market Revenues & Volume By Tattoo Studios for the Period 2021-2031
- Zambia Washbasin Import Export Trade Statistics
- Market Opportunity Assessment By Type
- Market Opportunity Assessment By Material Used
- Market Opportunity Assessment By End User
- Market Opportunity Assessment By Application
- Market Opportunity Assessment By End Use
- Zambia Washbasin Top Companies Market Share
- Zambia Washbasin Competitive Benchmarking By Technical and Operational Parameters
- Zambia Washbasin Company Profiles
- Zambia Washbasin Key Strategic Recommendations
Frequently Asked Questions About the Market Study (FAQs):
6Wresearch actively monitors the Zambia Washbasin Market and publishes its comprehensive annual report, highlighting emerging trends, growth drivers, revenue analysis, and forecast outlook. Our insights help businesses to make data-backed strategic decisions with ongoing market dynamics. Our analysts track relevent industries related to the Zambia Washbasin Market, allowing our clients with actionable intelligence and reliable forecasts tailored to emerging regional needs.
Yes, we provide customisation as per your requirements. To learn more, feel free to contact us on sales@6wresearch.com
1 Executive Summary |
2 Introduction |
2.1 Key Highlights of the Report |
2.2 Report Description |
2.3 Market Scope & Segmentation |
2.4 Research Methodology |
2.5 Assumptions |
3 Zambia Washbasin Market Overview |
3.1 Zambia Country Macro Economic Indicators |
3.2 Zambia Washbasin Market Revenues & Volume, 2021 & 2031F |
3.3 Zambia Washbasin Market - Industry Life Cycle |
3.4 Zambia Washbasin Market - Porter's Five Forces |
3.5 Zambia Washbasin Market Revenues & Volume Share, By Type, 2021 & 2031F |
3.6 Zambia Washbasin Market Revenues & Volume Share, By Material Used, 2021 & 2031F |
3.7 Zambia Washbasin Market Revenues & Volume Share, By End User, 2021 & 2031F |
3.8 Zambia Washbasin Market Revenues & Volume Share, By Application, 2021 & 2031F |
4 Zambia Washbasin Market Dynamics |
4.1 Impact Analysis |
4.2 Market Drivers |
4.2.1 Increasing urbanization and population growth leading to higher demand for housing and construction projects. |
4.2.2 Rising disposable income and improving standards of living driving consumer spending on home improvement products. |
4.2.3 Government initiatives to improve sanitation and hygiene practices, increasing the adoption of washbasins. |
4.3 Market Restraints |
4.3.1 Fluctuating raw material costs impacting the production cost of washbasins. |
4.3.2 Intense competition from local and international manufacturers affecting pricing strategies and market share. |
4.3.3 Economic uncertainties and currency fluctuations influencing consumer purchasing power. |
5 Zambia Washbasin Market Trends |
6 Zambia Washbasin Market, By Types |
6.1 Zambia Washbasin Market, By Type |
6.1.1 Overview and Analysis |
6.1.2 Zambia Washbasin Market Revenues & Volume, By Type, 2021 - 2031F |
6.1.3 Zambia Washbasin Market Revenues & Volume, By Wall-mounted, 2021 - 2031F |
6.1.4 Zambia Washbasin Market Revenues & Volume, By Countertop, 2021 - 2031F |
6.1.5 Zambia Washbasin Market Revenues & Volume, By Pedestal, 2021 - 2031F |
6.1.6 Zambia Washbasin Market Revenues & Volume, By Under-mount, 2021 - 2031F |
6.1.7 Zambia Washbasin Market Revenues & Volume, By Smart, 2021 - 2031F |
6.2 Zambia Washbasin Market, By Material Used |
6.2.1 Overview and Analysis |
6.2.2 Zambia Washbasin Market Revenues & Volume, By Ceramic, 2021 - 2031F |
6.2.3 Zambia Washbasin Market Revenues & Volume, By Stainless Steel, 2021 - 2031F |
6.2.4 Zambia Washbasin Market Revenues & Volume, By Glass, 2021 - 2031F |
6.2.5 Zambia Washbasin Market Revenues & Volume, By Porcelain, 2021 - 2031F |
6.2.6 Zambia Washbasin Market Revenues & Volume, By Composite, 2021 - 2031F |
6.3 Zambia Washbasin Market, By End User |
6.3.1 Overview and Analysis |
6.3.2 Zambia Washbasin Market Revenues & Volume, By Residential, 2021 - 2031F |
6.3.3 Zambia Washbasin Market Revenues & Volume, By Commercial, 2021 - 2031F |
6.3.4 Zambia Washbasin Market Revenues & Volume, By Hospitality, 2021 - 2031F |
6.3.5 Zambia Washbasin Market Revenues & Volume, By Healthcare, 2021 - 2031F |
6.3.6 Zambia Washbasin Market Revenues & Volume, By Industrial, 2021 - 2031F |
6.4 Zambia Washbasin Market, By Application |
6.4.1 Overview and Analysis |
6.4.2 Zambia Washbasin Market Revenues & Volume, By Bathroom Fixtures, 2021 - 2031F |
6.4.3 Zambia Washbasin Market Revenues & Volume, By Public Restrooms, 2021 - 2031F |
6.4.4 Zambia Washbasin Market Revenues & Volume, By Luxury Bathrooms, 2021 - 2031F |
6.4.5 Zambia Washbasin Market Revenues & Volume, By Hospital Facilities, 2021 - 2031F |
6.4.6 Zambia Washbasin Market Revenues & Volume, By High-traffic Areas, 2021 - 2031F |
7 Zambia Washbasin Market Import-Export Trade Statistics |
7.1 Zambia Washbasin Market Export to Major Countries |
7.2 Zambia Washbasin Market Imports from Major Countries |
8 Zambia Washbasin Market Key Performance Indicators |
8.1 Average selling price of washbasins in Zambia. |
8.2 Number of new housing and construction projects in the region. |
8.3 Percentage of households with access to improved sanitation facilities. |
9 Zambia Washbasin Market - Opportunity Assessment |
9.1 Zambia Washbasin Market Opportunity Assessment, By Type, 2021 & 2031F |
9.2 Zambia Washbasin Market Opportunity Assessment, By Material Used, 2021 & 2031F |
9.3 Zambia Washbasin Market Opportunity Assessment, By End User, 2021 & 2031F |
9.4 Zambia Washbasin Market Opportunity Assessment, By Application, 2021 & 2031F |
10 Zambia Washbasin Market - Competitive Landscape |
10.1 Zambia Washbasin Market Revenue Share, By Companies, 2024 |
10.2 Zambia Washbasin Market Competitive Benchmarking, By Operating and Technical Parameters |
11 Company Profiles |
12 Recommendations |
13 Disclaimer |
Export potential assessment - trade Analytics for 2030
Export potential enables firms to identify high-growth global markets with greater confidence by combining advanced trade intelligence with a structured quantitative methodology. The framework analyzes emerging demand trends and country-level import patterns while integrating macroeconomic and trade datasets such as GDP and population forecasts, bilateral import–export flows, tariff structures, elasticity differentials between developed and developing economies, geographic distance, and import demand projections. Using weighted trade values from 2020–2024 as the base period to project country-to-country export potential for 2030, these inputs are operationalized through calculated drivers such as gravity model parameters, tariff impact factors, and projected GDP per-capita growth. Through an analysis of hidden potentials, demand hotspots, and market conditions that are most favorable to success, this method enables firms to focus on target countries, maximize returns, and global expansion with data, backed by accuracy.
By factoring in the projected importer demand gap that is currently unmet and could be potential opportunity, it identifies the potential for the Exporter (Country) among 190 countries, against the general trade analysis, which identifies the biggest importer or exporter.
To discover high-growth global markets and optimize your business strategy:
Click Here
Pricing
- Single User License$ 1,995
- Department License$ 2,400
- Site License$ 3,120
- Global License$ 3,795

Search
Thought Leadership and Analyst Meet


Our Clients
Latest Reports
- United Kingdom (UK) Long-term Care Insurance Market (2026-2032) | Growth, Share, Consumer Insights, Drivers, Opportunities, Competition, Pricing Analysis, Segments, Restraints, Companies, Competitive, Value, Outlook, Size, Demand, Analysis, Challenges, Strategic Insights, Investment Trends, Revenue, Trends, Supply, Forecast
- United Kingdom (UK) Long Term Care Market (2026-2032) | Companies, Outlook, Analysis, Trends, Value, Revenue, Segmentation, Share, Forecast, Competitive Landscape, Growth, Size & Forecast
- Iraq Insulation and Waterproofing Market (2026-2032) | Outlook, Drivers, Growth, Size, Share, Industry, Revenue, Trends, Demand, Competitive, Strategic Insights, Opportunities, Segments, Companies, Challenges, Strategy, Consumer Insights, Analysis, Investment Trends, Value, Segmentation, Forecast, Restraints
- India Switchgear Market Outlook (2026 - 2032) | Size, Share, Trends, Growth, Revenue, Forecast, Analysis, Value, Outlook
- Pakistan Contraceptive Implants Market (2025-2031) | Demand, Growth, Size, Share, Industry, Pricing Analysis, Competitive, Strategic Insights, Strategy, Consumer Insights, Analysis, Investment Trends, Opportunities, Revenue, Segments, Value, Segmentation, Supply, Forecast, Restraints, Outlook, Competition, Drivers, Trends, Companies, Challenges
- Sri Lanka Packaging Market (2026-2032) | Outlook, Competition, Drivers, Trends, Demand, Pricing Analysis, Competitive, Strategic Insights, Companies, Challenges, Strategy, Consumer Insights, Analysis, Investment Trends, Opportunities, Growth, Size, Share, Industry, Revenue, Segments, Value, Segmentation, Supply, Forecast, Restraints
- India Kids Watches Market (2026-2032) | Strategy, Consumer Insights, Analysis, Investment Trends, Opportunities, Growth, Size, Share, Industry, Revenue, Segments, Value, Segmentation, Supply, Forecast, Restraints, Outlook, Competition, Drivers, Trends, Demand, Pricing Analysis, Competitive, Strategic Insights, Companies, Challenges
- Saudi Arabia Core Assurance Service Market (2025-2031) | Strategy, Consumer Insights, Analysis, Investment Trends, Opportunities, Growth, Size, Share, Industry, Revenue, Segments, Value, Segmentation, Supply, Forecast, Restraints, Outlook, Competition, Drivers, Trends, Demand, Pricing Analysis, Competitive, Strategic Insights, Companies, Challenges
- Romania Uninterruptible Power Supply (UPS) Market (2026-2032) | Industry, Analysis, Revenue, Size, Forecast, Outlook, Value, Trends, Share, Growth & Companies
- Saudi Arabia Car Window Tinting Film, Paint Protection Film (PPF), and Ceramic Coating Market (2025-2031) | Strategy, Consumer Insights, Analysis, Investment Trends, Opportunities, Growth, Size, Share, Industry, Revenue, Segments, Value, Segmentation, Supply, Forecast, Restraints, Outlook, Competition, Drivers, Trends, Demand, Pricing Analysis, Competitive, Strategic Insights, Companies, Challenges
Industry Events and Analyst Meet

India EV Show 2026

EV tech India Expo 2026

Auto Tech Asia 2026

Battery Tech India 2026

Smart Production Solutions Guangzhou 2026
Whitepaper
- Middle East & Africa Commercial Security Market Click here to view more.
- Middle East & Africa Fire Safety Systems & Equipment Market Click here to view more.
- GCC Drone Market Click here to view more.
- Middle East Lighting Fixture Market Click here to view more.
- GCC Physical & Perimeter Security Market Click here to view more.
6WResearch In News
- Doha a strategic location for EV manufacturing hub: IPA Qatar
- Demand for luxury TVs surging in the GCC, says Samsung
- Empowering Growth: The Thriving Journey of Bangladesh’s Cable Industry
- Demand for luxury TVs surging in the GCC, says Samsung
- Video call with a traditional healer? Once unthinkable, it’s now common in South Africa
- Intelligent Buildings To Smooth GCC’s Path To Net Zero