Middle East & Africa (MEA) OTR Tire Market (2019-2025) | Outlook, Forecast, Industry, Analysis, Trends, Revenue, Companies, Share, Value, Size & Growth
Market Forecast By Types (Radial Tires and Bias Tires), By Vehicle Types (Loaders, Dump Truck, Graders, Cranes, Dumpers, Tractors, Forklifts, and Others), By End Users (Construction, Industrial, Mining, and Others), By Countries (UAE, Saudi Arabia, Turkey, Kuwait, Qatar, Oman, Bahrain, South Africa, Egypt, Nigeria and Rest of the Middle East & Africa) and Competitive Landscape
| Product Code: ETC000744 | Publication Date: Mar 2022 | Product Type: Report | ||
| Publisher: 6Wresearch | Author: Ravi Bhandari | No. of Pages: 360 | No. of Figures: 241 | No. of Tables: 67 |
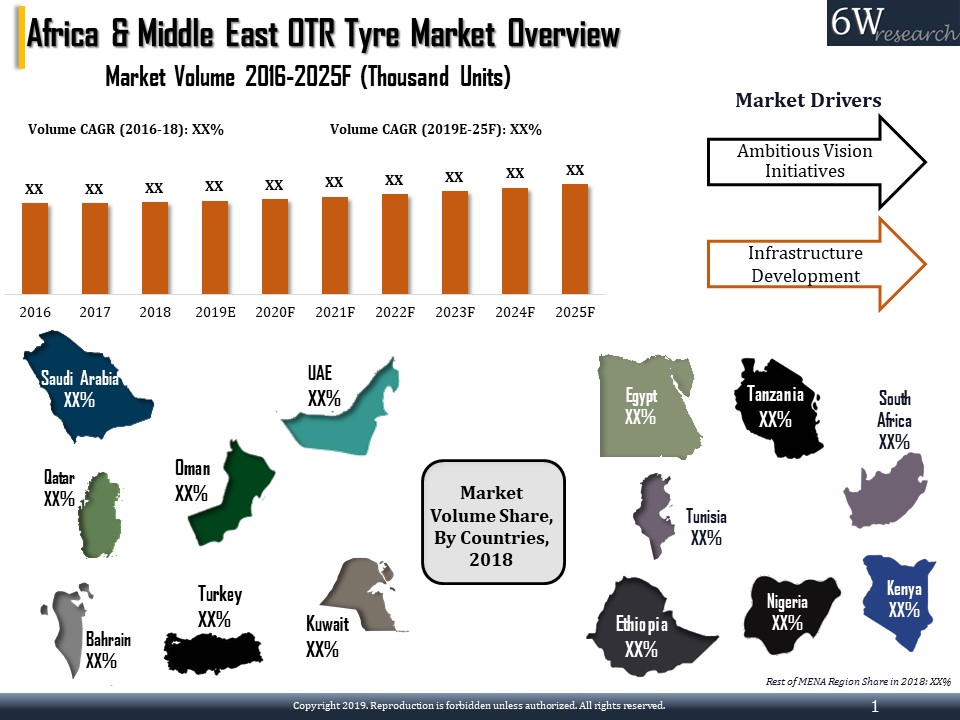
Middle East and Africa OTR Tire Market are expected to grow during the forecast period owing to an expected recovery in key application areas, across key countries of the region such as South Africa, Turkey, Saudi Arabia and Egypt. Infrastructure development aimed at supporting the economic diversification goals of many countries has created an opportunity for Chinese, Indian and European tyre companies to invest in the region. Additionally, the local OTR tyre manufacturing in the region is limited to countries such as Turkey and Egypt, while the majority of the region’s market is catered through imports.
According to 6Wresearch, Middle East and Africa (MEA) OTR Tire Market size is projected to grow at a CAGR of 2.8% during 2019-25. In the overall Middle East and Africa OTR tyre Market Share, South Africa captured the majority of the market volume in 2018 and is expected to lead throughout the forecast period due to large scale mining activity prevalent in the country. However, Tanzania is expected to register maximum growth on the back of developing public infrastructure in the country during the forecast period. Upsurge in the development of the mining sector backed by rising mining equipment beholds the Middle East and Africa OTR Tire Market.
By type, radial tyres lead the overall Middle East and Africa OTR tyre market Revenue due to their superior performance and durability as compared to biased tyres. Furthermore, in terms of applications, the construction segment dominates the OTR tyres market in the Middle East and Africa region as the countries are focusing on developing public infrastructure as a part of their vision guidelines.
The Middle East and Africa (MEA) OTR tyre market report thoroughly covers the market by type, application, sales channels, vehicle types and key countries. The Middle East and Africa (MEA) OTR tyre market outlook report provides an unbiased and detailed analysis of the ongoing Middle East and Africa (MEA) OTR tyre Market trends, opportunities/high growth areas and market drivers which would help the stakeholders to devise and align their market strategies according to the current and future market dynamics.
Some of the major players in the Middle East and Africa OTR tyre market are Triangle Tyre Co. Ltd., The Goodyear Tire & Rubber Company, Balkrishna Industries Limited (BKT) Bridgestone Middle East & Africa FZE and General Company Establishment Michelin.
Key Highlights of the Report
- Middle East and Africa OTR Tyre Market Overview.
- Middle East and Africa OTR Tyre Market Trends.
- Middle East and Africa OTR Tyre Market Forecast
- Historical data & Forecast of Middle East and Africa OTR Tyre Market Volume for the Period 2016-2018.
- Middle East and Africa OTR Tyre Market Size & Middle East and Africa OTR Tyre Market Forecast until 2025.
- Historical Data of Saudi Arabia, UAE, Kuwait, Bahrain, Qatar, Turkey, Oman, Nigeria, Kenya, Tanzania, Tunisia, South Africa, Egypt and Ethiopia OTR Tyre Market Volume for the Period 2016-2018.
- Market Size & Forecast of Saudi Arabia, UAE, Kuwait, Bahrain, Qatar, Turkey, Oman, Nigeria, Kenya, Tanzania, Tunisia, South Africa, Egypt and Ethiopia OTR Tyre Market Volume until 2025.
- Historical Data of Saudi Arabia, UAE, Kuwait, Bahrain, Qatar, Turkey, Oman, Nigeria, Kenya, Tanzania, Tunisia, South Africa, Egypt and Ethiopia OTR Tyre Market Volume, by Type, for the Period 2016-2018.
- Market Size & Forecast of Saudi Arabia, UAE, Kuwait, Bahrain, Qatar, Turkey, Oman, Nigeria, Kenya, Tanzania, Tunisia, South Africa, Egypt and Ethiopia OTR Tyre Market Volume, by Type, until 2025.
- Historical Data of Saudi Arabia, UAE, Kuwait, Bahrain, Qatar, Turkey, Oman, Nigeria, Kenya, Tanzania, Tunisia, South Africa, Egypt and Ethiopia OTR Tyre, by Sales Channel, for the Period 2016-2018.
- Market Size & Forecast of Saudi Arabia, UAE, Kuwait, Bahrain, Qatar, Turkey, Oman, Nigeria, Kenya, Tanzania, Tunisia, South Africa, Egypt and Ethiopia OTR Tyre Market Volume, by Sales Channel, until 2025.
- Historical Data of Saudi Arabia, UAE, Kuwait, Bahrain, Qatar, Turkey, Oman, Nigeria, Kenya, Tanzania, Tunisia, South Africa, Egypt and Ethiopia OTR Tyre Market Volume, by Application, for the Period 2016-2018.
- Market Size & Forecast of Saudi Arabia, UAE, Kuwait, Bahrain, Qatar, Turkey, Oman, Nigeria, Kenya, Tanzania, Tunisia, South Africa, Egypt and Ethiopia OTR Tyre Market Volume, by Application, until 2025.
- Historical Data of Saudi Arabia, UAE, Kuwait, Bahrain, Qatar, Turkey, Oman, Nigeria, Kenya, Tanzania, Tunisia, South Africa, Egypt and Ethiopia OTR Tyre Market Volume, by Vehicle Type, for the Period 2016-2018.
- Market Size & Forecast of Saudi Arabia, UAE, Kuwait, Bahrain, Qatar, Turkey, Oman, Nigeria, Kenya, Tanzania, Tunisia, South Africa, Egypt and Ethiopia OTR Tyre Market Volume, by Vehicle Type, until 2025.
- Middle East and Africa OTR Tyre Market Outlook
- Market Drivers and Restraints
- Porter’s Five Force Analysis
- Market Opportunity Assessment
- Middle East and Africa OTR Tyre Market Overview on Competitive Benchmarking
- Company Profiles
- Middle East and Africa OTR Tyre Market Ranking, by Companies
- Middle East and Africa OTR Tyre Market Share, by Countries
- Strategic Recommendations
Markets Covered
Middle East and Africa OTR tyre market report provide a detailed analysis of the following market segments:
By Types
- Radial
- Bias
- By Sales Channel
- OEM
- Aftermarket
By Applications
- Construction
- Port
- Mining
- Others
By Vehicle Type
- Loader
- Dump Truck
- Excavator
- Grader
- Cranes
- Material Handling Equipment
- Others
By Countries
- Saudi Arabia
- UAE
- Turkey
- Qatar
- Oman
- Bahrain
- Kuwait
- South Africa
- Egypt
- Nigeria
- Kenya
- Ethiopia
- Tanzania
- Tunisia
- Rest of Middle East and Africa
Upcoming Reports:
- UAE OTR Tyre Market Report
- Saudi Arabia OTR Tyre Market Report
- South Africa OTR Tyre Market Report
- Egypt OTR Tyre Market Report
Frequently Asked Questions About the Market Study (FAQs):
6Wresearch actively monitors the Middle East & Africa (MEA) OTR Tire Market and publishes its comprehensive annual report, highlighting emerging trends, growth drivers, revenue analysis, and forecast outlook. Our insights help businesses to make data-backed strategic decisions with ongoing market dynamics. Our analysts track relevent industries related to the Middle East & Africa (MEA) OTR Tire Market, allowing our clients with actionable intelligence and reliable forecasts tailored to emerging regional needs.
Yes, we provide customisation as per your requirements. To learn more, feel free to contact us on sales@6wresearch.com
| 1 Executive Summary |
| 2 Introduction |
| 2.1 Report Description |
| 2.2 Key Highlights of the Report |
| 2.3 Market Scope & Segmentation |
| 2.4 Research Methodology |
| 2.5 Assumptions |
| 3 Middle East and Africa OTR Tyre Market Overview |
| 3.1 Middle East and Africa OTR Tyre Market Volume, 2016 - 2025F |
| 3.2 Middle East and Africa OTR Tyre Market Industry Life Cycle, 2018 |
| 3.3 Middle East and Africa OTR Tyre Market Porter’s Five Forces Model, 2018 |
| 3.4 Middle East and Africa OTR Tyre Market Volume Share, By Regions, 2018 & 2025F |
| 3.5 Middle East OTR Tyre Market Volume Share, By Countries, 2018 & 2025F |
| 3.6 Africa OTR Tyre Market Volume Share, By Countries, 2018 & 2025F |
| 4 Middle East and Africa OTR Tyre Market Dynamics |
| 4.1 Impact Analysis |
| 4.2 Market Drivers |
| 4.3 Market Restraints |
| 5 Middle East and Africa OTR Tyre Market Trends |
| 6 Saudi Arabia OTR Tyre Market Overview |
| 6.1 Saudi Arabia Country Indicator |
| 6.2 Saudi Arabia OTR Tyre Market Volume, 2016 - 2025F |
| 6.3 Saudi Arabia OTR Tyre Market Volume, By Types, 2016 - 2025F |
| 6.4 Saudi Arabia OTR Tyre Market Volume, By Sales Channel, 2016 - 2025F |
| 6.5 Saudi Arabia OTR Tyre Market Volume Share, By Applications, 2018 & 2025F |
| 6.5.1 Saudi Arabia Construction Application OTR Tyre Market Volume, 2016 - 2025F |
| 6.5.1 Saudi Arabia Port Application OTR Tyre Market Volume, 2016 - 2025F |
| 6.5.2 Saudi Arabia Mining Application OTR Tyre Market Volume, 2016 - 2025F |
| 6.5.2 Saudi Arabia Other Application OTR Tyre Market Volume, 2016 - 2025F |
| 6.6 Saudi Arabia Qatar OTR Tyre Market Volume Share, By Vehicle Type, 2018 & 2025F |
| 6.6.1 Saudi Arabia OTR Market Volume, By Vehicle Type, 2016 - 2025F |
| 6.7 Saudi Arabia OTR Tyre Market Key Performance Indicators |
| 6.8 Saudi Arabia OTR Tyre Market Opportunity Assessment |
| 6.8.1 Saudi Arabia OTR Tyre Market Opportunity Assessment, By Types, 2025F |
| 6.8.2 Saudi Arabia OTR Tyre Market Opportunity Assessment, By Sales Channel, 2025F |
| 6.8.3 Saudi Arabia OTR Tyre Market Opportunity Assessment, By Applications, 2025F |
| 7 UAE OTR Tyre Market Overview |
| 7.1 UAE Country Indicator |
| 7.2 UAE OTR Tyre Market Volume, 2016 - 2025F |
| 7.3 UAE OTR Tyre Market Volume, By Types, 2016 - 2025F |
| 7.4 UAE OTR Tyre Market Volume, By Sales Channel, 2016 - 2025F |
| 7.5 UAE OTR Tyre Market Volume Share, By Applications, 2018 & 2025F |
| 7.5.1 UAE Construction Application OTR Tyre Market Volume, 2016 - 2025F |
| 7.5.1 UAE Port Application OTR Tyre Market Volume, 2016 - 2025F |
| 7.5.2 UAE Mining Application OTR Tyre Market Volume, 2016 - 2025F |
| 7.5.2 UAE Other Application OTR Tyre Market Volume, 2016 - 2025F |
| 7.6 UAE Qatar OTR Tyre Market Volume Share, By Vehicle Type, 2018 & 2025F |
| 7.6.1 UAE OTR Market Volume, By Vehicle Type, 2016 - 2025F |
| 7.7 UAE OTR Tyre Market Key Performance Indicators |
| 7.8 UAE OTR Tyre Market Opportunity Assessment |
| 7.8.1 UAE OTR Tyre Market Opportunity Assessment, By Types, 2025F |
| 7.8.2 UAE OTR Tyre Market Opportunity Assessment, By Sales Channels, 2025F |
| 7.8.3 UAE OTR Tyre Market Opportunity Assessment, By Applications, 2025F |
| 8 Turkey OTR Tyre Market Overview |
| 8.1 Turkey Country Indicator |
| 8.2 Turkey OTR Tyre Market Volume, 2016 - 2025F |
| 8.3 Turkey OTR Tyre Market Volume, By Types, 2016 - 2025F |
| 8.4 Turkey OTR Tyre Market Volume, By Sales Channel, 2016 - 2025F |
| 8.5 Turkey OTR Tyre Market Volume Share, By Applications, 2018 & 2025F |
| 8.5.1 Turkey Construction Application OTR Tyre Market Volume, 2016 - 2025F |
| 8.5.1 Turkey Port Application OTR Tyre Market Volume, 2016 - 2025F |
| 8.5.2 Turkey Mining Application OTR Tyre Market Volume, 2016 - 2025F |
| 8.5.2 Turkey Other Application OTR Tyre Market Volume, 2016 - 2025F |
| 8.6 Turkey Qatar OTR Tyre Market Volume Share, By Vehicle Type, 2018 & 2025F |
| 8.6.1 Turkey OTR Market Volume, By Vehicle Type, 2016 - 2025F |
| 8.7 Turkey OTR Tyre Market Key Performance Indicators |
| 8.8 Turkey OTR Tyre Market Opportunity Assessment |
| 8.8.1 Turkey OTR Tyre Market Opportunity Assessment, By Types, 2025F |
| 8.8.2 Turkey OTR Tyre Market Opportunity Assessment, By Sales Channels, 2025F |
| 8.8.3 Turkey OTR Tyre Market Opportunity Assessment, By Applications, 2025F |
| 9 Oman OTR Tyre Market Overview |
| 9.1 Oman Country Indicator |
| 9.2 Oman OTR Tyre Market Volume, 2016 - 2025F |
| 9.3 Oman OTR Tyre Market Volume, By Types, 2016 - 2025F |
| 9.4 Oman OTR Tyre Market Volume, By Sales Channel, 2016 - 2025F |
| 9.5 Oman OTR Tyre Market Volume Share, By Applications, 2018 & 2025F |
| 9.5.1 Oman Construction Application OTR Tyre Market Volume, 2016 - 2025F |
| 9.5.1 Oman Port Application OTR Tyre Market Volume, 2016 - 2025F |
| 9.5.2 Oman Mining Application OTR Tyre Market Volume, 2016 - 2025F |
| 9.5.2 Oman Other Application OTR Tyre Market Volume, 2016 - 2025F |
| 9.6 Oman Qatar OTR Tyre Market Volume Share, By Vehicle Type, 2018 & 2025F |
| 9.6.1 Oman OTR Market Volume, By Vehicle Type, 2016 - 2025F |
| 9.7 Oman OTR Tyre Market Key Performance Indicators |
| 9.8 Oman OTR Tyre Market Opportunity Assessment |
| 9.8.1 Oman OTR Tyre Market Opportunity Assessment, By Types, 2025F |
| 9.8.2 Oman OTR Tyre Market Opportunity Assessment, By Sales Channels, 2025F |
| 9.8.3 Oman OTR Tyre Market Opportunity Assessment, By Applications, 2025F |
| 10 Bahrain OTR Tyre Market Overview |
| 10.1 Bahrain Country Indicator |
| 10.2 BahrainOTR Tyre Market Volume, 2016 - 2025F |
| 10.3 BahrainOTR Tyre Market Volume, By Types, 2016 - 2025F |
| 10.4 Bahrain OTR Tyre Market Volume, By Sales Channel, 2016 - 2025F |
| 10.5 Bahrain OTR Tyre Market Volume Share, By Applications, 2018 & 2025F |
| 10.5.1 Bahrain Construction Application OTR Tyre Market Volume, 2016 - 2025F |
| 10.5.1 Bahrain Port Application OTR Tyre Market Volume, 2016 - 2025F |
| 10.5.2 Bahrain Mining Application OTR Tyre Market Volume, 2016 - 2025F |
| 10.5.2 Bahrain Other Application OTR Tyre Market Volume, 2016 - 2025F |
| 10.6 Bahrain OTR Tyre Market Volume Share, By Vehicle Type, 2018 & 2025F |
| 10.6.1 Bahrain OTR Market Volume, By Vehicle Type, 2016 - 2025F |
| 10.7 Bahrain OTR Tyre Market Key Performance Indicators |
| 10.8 Bahrain OTR Tyre Market Opportunity Assessment |
| 10.8.1 Bahrain OTR Tyre Market Opportunity Assessment, By Types, 2025F |
| 10.8.2 Bahrain OTR Tyre Market Opportunity Assessment, By Sales Channels, 2025F |
| 10.8.2 Bahrain OTR Tyre Market Opportunity Assessment, By Applications, 2025F |
| 11 Kuwait OTR Tyre Market Overview |
| 11.1 Kuwait Country Indicator |
| 11.2 Kuwait OTR Tyre Market Volume, 2016 - 2025F |
| 11.3 Kuwait OTR Tyre Market Volume, By Types, 2016 - 2025F |
| 11.4 Kuwait OTR Tyre Market Volume, By Sales Channel, 2016 - 2025F |
| 11.5 Kuwait OTR Tyre Market Volume Share, By Applications, 2018 & 2025F |
| 11.5.1 Kuwait Construction Application OTR Tyre Market Volume, 2016 - 2025F |
| 11.5.1 Kuwait Port Application OTR Tyre Market Volume, 2016 - 2025F |
| 11.5.2 Kuwait Other Application OTR Tyre Market Volume, 2016 - 2025F |
| 11.6 Kuwait OTR Tyre Market Volume Share, By Vehicle Type, 2018 & 2025F |
| 11.6.1 Kuwait OTR Market Volume, By Vehicle Type, 2016 - 2025F |
| 11.7 Kuwait OTR Tyre Market Key Performance Indicators |
| 11.8 Kuwait OTR Tyre Market Opportunity Assessment |
| 11.8.1 Kuwait OTR Tyre Market Opportunity Assessment, By Types, 2025F |
| 11.8.2 Kuwait OTR Tyre Market Opportunity Assessment, By Sales Channels, 2025F |
| 11.8.3 Kuwait OTR Tyre Market Opportunity Assessment, By Applications, 2025F |
| 12 Qatar OTR Tyre Market Overview |
| 12.1 Qatar Country Indicator |
| 12.2 Qatar OTR Tyre Market Volume, 2016 - 2025F |
| 12.3 Qatar OTR Tyre Market Volume, By Types, 2016 - 2025F |
| 12.4 Qatar OTR Tyre Market Volume, By Sales Channel, 2016 - 2025F |
| 12.5 Qatar OTR Tyre Market Volume Share, By Applications, 2018 & 2025F |
| 12.5.1 Qatar Construction Application OTR Tyre Market Volume, 2016 - 2025F |
| 12.5.1 Qatar Port Application OTR Tyre Market Volume, 2016 - 2025F |
| 12.5.2 Qatar Mining Application OTR Tyre Market Volume, 2016 - 2025F |
| 12.5.2 Qatar Other Application OTR Tyre Market Volume, 2016 - 2025F |
| 12.6 Qatar OTR Tyre Market Volume Share, By Vehicle Type, 2018 & 2025F |
| 12.6.1 Qatar OTR Market Volume, By Vehicle Type, 2016 - 2025F |
| 12.7 Qatar OTR Tyre Market Key Performance Indicators |
| 12.8 Qatar OTR Tyre Market Opportunity Assessment |
| 12.8.1 Qatar OTR Tyre Market Opportunity Assessment, By Types, 2025F |
| 12.8.2 Qatar OTR Tyre Market Opportunity Assessment, By Sales Channels, 2025F |
| 12.8.2 Qatar OTR Tyre Market Opportunity Assessment, By Applications, 2025F |
| 13 South Africa OTR Tyre Market Overview |
| 13.1 South Africa Country Indicator |
| 13.2 South Africa OTR Tyre Market Volume, 2016 - 2025F |
| 13.3 South Africa OTR Tyre Market Volume, By Types, 2016 - 2025F |
| 13.4 South Africa OTR Tyre Market Volume, By Sales Channel, 2016 - 2025F |
| 13.5 South Africa OTR Tyre Market Volume Share, By Applications, 2018 & 2025F |
| 13.5.1 South Africa Construction Application OTR Tyre Market Volume, 2016 - 2025F |
| 13.5.1 South Africa Port Application OTR Tyre Market Volume, 2016 - 2025F |
| 13.5.2 South Africa Mining Application OTR Tyre Market Volume, 2016 - 2025F |
| 13.5.2 South Africa Other Application OTR Tyre Market Volume, 2016 - 2025F |
| 13.6 South Africa OTR Tyre Market Volume Share, By Vehicle Type, 2018 & 2025F |
| 13.6.1 South Africa OTR Market Volume, By Vehicle Type, 2016 - 2025F |
| 13.7 South Africa OTR Tyre Market Key Performance Indicators |
| 13.8 South Africa OTR Tyre Market Opportunity Assessment |
| 13.8.1 South Africa OTR Tyre Market Opportunity Assessment, By Types, 2025F |
| 13.8.2 South Africa OTR Tyre Market Opportunity Assessment, By Sales Channels, 2025F |
| 13.8.3 South Africa OTR Tyre Market Opportunity Assessment, By Applications, 2025F |
| 14 Egypt OTR Tyre Market Overview |
| 14.1 Egypt Country Indicator |
| 14.2 Egypt OTR Tyre Market Volume, 2016 - 2025F |
| 14.3 Egypt OTR Tyre Market Volume, By Types, 2016 - 2025F |
| 14.4 Egypt OTR Tyre Market Volume, By Sales Channel, 2016 - 2025F |
| 14.5 Egypt OTR Tyre Market Volume Share, By Applications, 2018 & 2025F |
| 14.5.1 Egypt Construction Application OTR Tyre Market Volume, 2016 - 2025F |
| 14.5.1 Egypt Port Application OTR Tyre Market Volume, 2016 - 2025F |
| 14.5.2 Egypt Mining Application OTR Tyre Market Volume, 2016 - 2025F |
| 14.5.2 Egypt Other Application OTR Tyre Market Volume, 2016 - 2025F |
| 14.6 Egypt OTR Tyre Market Volume Share, By Vehicle Type, 2018 & 2025F |
| 14.6.1 Egypt OTR Market Volume, By Vehicle Type, 2016 - 2025F |
| 14.7 Egypt OTR Tyre Market Key Performance Indicators |
| 14.8 Egypt OTR Tyre Market Opportunity Assessment |
| 14.8.1 Egypt OTR Tyre Market Opportunity Assessment, By Types, 2025F |
| 14.8.2 Egypt OTR Tyre Market Opportunity Assessment, By Sales Channels, 2025F |
| 14.8.3 Egypt OTR Tyre Market Opportunity Assessment, By Applications, 2025F |
| 15 Kenya OTR Tyre Market Overview |
| 15.1 Kenya Country Indicator |
| 15.2 Kenya OTR Tyre Market Volume, 2016 - 2025F |
| 15.3 Kenya OTR Tyre Market Volume, By Types, 2016 - 2025F |
| 15.4 Kenya OTR Tyre Market Volume, By Sales Channel, 2016 - 2025F |
| 15.5 Kenya OTR Tyre Market Volume Share, By Applications, 2018 & 2025F |
| 15.5.1 Kenya Construction Application OTR Tyre Market Volume, 2016 - 2025F |
| 15.5.1 Kenya Port Application OTR Tyre Market Volume, 2016 - 2025F |
| 15.5.2 Kenya Mining Application OTR Tyre Market Volume, 2016 - 2025F |
| 15.5.2 Kenya Other Application OTR Tyre Market Volume, 2016 - 2025F |
| 15.6 Kenya OTR Tyre Market Volume Share, By Vehicle Type, 2018 & 2025F |
| 15.6.1 Kenya OTR Market Volume, By Vehicle Type, 2016 - 2025F |
| 15.7 Kenya OTR Tyre Market Key Performance Indicators |
| 15.8 Kenya OTR Tyre Market Opportunity Assessment |
| 15.8.1 Kenya OTR Tyre Market Opportunity Assessment, By Types, 2025F |
| 15.8.2 Kenya OTR Tyre Market Opportunity Assessment, By Sales Channels, 2025F |
| 15.8.3 Kenya OTR Tyre Market Opportunity Assessment, By Applications, 2025F |
| 16 Nigeria OTR Tyre Market Overview |
| 16.1 Nigeria Country Indicator |
| 16.2 Nigeria OTR Tyre Market Volume, 2016 - 2025F |
| 16.3 Nigeria OTR Tyre Market Volume, By Types, 2016 - 2025F |
| 16.4 Nigeria OTR Tyre Market Volume, By Sales Channel, 2016 - 2025F |
| 16.5 Nigeria OTR Tyre Market Volume Share, By Applications, 2018 & 2025F |
| 16.5.1 Nigeria Construction Application OTR Tyre Market Volume, 2016 - 2025F |
| 16.5.1 Nigeria Port Application OTR Tyre Market Volume, 2016 - 2025F |
| 16.5.2 Nigeria Mining Application OTR Tyre Market Volume, 2016 - 2025F |
| 16.5.2 Nigeria Other Application OTR Tyre Market Volume, 2016 - 2025F |
| 16.6 Nigeria OTR Tyre Market Volume Share, By Vehicle Type, 2018 & 2025F |
| 16.6.1 Nigeria OTR Market Volume, By Vehicle Type, 2016 - 2025F |
| 16.7 Nigeria OTR Tyre Market Key Performance Indicators |
| 16.8 Nigeria OTR Tyre Market Opportunity Assessment |
| 16.8.1 Nigeria OTR Tyre Market Opportunity Assessment, By Types, 2025F |
| 16.8.2 Nigeria OTR Tyre Market Opportunity Assessment, By Sales Channels, 2025F |
| 16.8.3 Nigeria OTR Tyre Market Opportunity Assessment, By Applications, 2025F |
| 17 Tanzania OTR Tyre Market Overview |
| 17.1 Tanzania Country Indicator |
| 17.2 Tanzania OTR Tyre Market Volume, 2016 - 2025F |
| 17.3 Tanzania OTR Tyre Market Volume, By Types, 2016 - 2025F |
| 17.4 Tanzania OTR Tyre Market Volume, By Sales Channel, 2016 - 2025F |
| 17.5 Tanzania OTR Tyre Market Volume Share, By Applications, 2018 & 2025F |
| 17.5.1 Tanzania Construction Application OTR Tyre Market Volume, 2016 - 2025F |
| 17.5.1 Tanzania Port Application OTR Tyre Market Volume, 2016 - 2025F |
| 17.5.2 Tanzania Mining Application OTR Tyre Market Volume, 2016 - 2025F |
| 17.5.2 Tanzania Other Application OTR Tyre Market Volume, 2016 - 2025F |
| 17.6 Tanzania OTR Tyre Market Volume Share, By Vehicle Type, 2018 & 2025F |
| 17.6.1 Tanzania OTR Market Volume, By Vehicle Type, 2016 - 2025F |
| 17.7 Tanzania OTR Tyre Market Key Performance Indicators |
| 17.8 Tanzania OTR Tyre Market Opportunity Assessment |
| 17.8.1 Tanzania OTR Tyre Market Opportunity Assessment, By Types, 2025F |
| 17.8.2 Tanzania OTR Tyre Market Opportunity Assessment, By Sales Channels, 2025F |
| 17.8.3 Tanzania OTR Tyre Market Opportunity Assessment, By Applications, 2025F |
| 18 Ethiopia OTR Tyre Market Overview |
| 18.1 Ethiopia Country Indicator |
| 18.2 Ethiopia OTR Tyre Market Volume, 2016 - 2025F |
| 18.3 Ethiopia OTR Tyre Market Volume, By Types, 2016 - 2025F |
| 18.4 Ethiopia OTR Tyre Market Volume, By Sales Channel, 2016 - 2025F |
| 18.5 Ethiopia OTR Tyre Market Volume Share, By Applications, 2018 & 2025F |
| 18.5.1 Ethiopia Construction Application OTR Tyre Market Volume, 2016 - 2025F |
| 18.5.1 Ethiopia Port Application OTR Tyre Market Volume, 2016 - 2025F |
| 18.5.2 Ethiopia Mining Application OTR Tyre Market Volume, 2016 - 2025F |
| 18.5.2 Ethiopia Other Application OTR Tyre Market Volume, 2016 - 2025F |
| 18.6 Ethiopia OTR Tyre Market Volume Share, By Vehicle Type, 2018 & 2025F |
| 18.6.1 Ethiopia OTR Market Volume, By Vehicle Type, 2016 - 2025F |
| 18.7 Ethiopia OTR Tyre Market Key Performance Indicators |
| 18.8 Ethiopia OTR Tyre Market Opportunity Assessment |
| 18.8.1 Ethiopia OTR Tyre Market Opportunity Assessment, By Types, 2025F |
| 18.8.2 Ethiopia OTR Tyre Market Opportunity Assessment, By Sales Channels, 2025F |
| 18.8.3 Ethiopia OTR Tyre Market Opportunity Assessment, By Applications, 2025F |
| 19 Tunisia OTR Tyre Market Overview |
| 19.1 Tunisia Country Indicator |
| 19.2 Tunisia OTR Tyre Market Volume, 2016 - 2025F |
| 19.3 Tunisia OTR Tyre Market Volume, By Types, 2016 - 2025F |
| 19.4 Tunisia OTR Tyre Market Volume, By Sales Channel, 2016 - 2025F |
| 19.5 Tunisia OTR Tyre Market Volume Share, By Applications, 2018 & 2025F |
| 19.5.1 Tunisia Construction Application OTR Tyre Market Volume, 2016 - 2025F |
| 19.5.1 Tunisia Port Application OTR Tyre Market Volume, 2016 - 2025F |
| 19.5.2 Tunisia Mining Application OTR Tyre Market Volume, 2016 - 2025F |
| 19.5.2 Tunisia Other Application OTR Tyre Market Volume, 2016 - 2025F |
| 19.6 Tunisia OTR Tyre Market Volume Share, By Vehicle Type, 2018 & 2025F |
| 19.6.1 Tunisia OTR Market Volume, By Vehicle Type, 2016 - 2025F |
| 19.7 Tunisia OTR Tyre Market Key Performance Indicators |
| 19.8 Tunisia OTR Tyre Market Opportunity Assessment |
| 19.8.1 Tunisia OTR Tyre Market Opportunity Assessment, By Types, 2025F |
| 19.8.2 Tunisia OTR Tyre Market Opportunity Assessment, By Sales Channels, 2025F |
| 19.8.3 Tunisia OTR Tyre Market Opportunity Assessment, By Applications, 2025F |
| 20. Rest of Middle East and Africa OTR Tyre Market Overview |
| 20.1 Rest of Middle East and Africa OTR Tyre Market Revenues, 2016-2025F |
| 21. Middle East and Africa OTR Tyre Market Opportunity Assessment |
| 21.1 Middle East and Africa OTR Tyre Market Opportunity Assessment, By Countries, 2025F |
| 22. Middle East and Africa OTR Tyre Market Competitive Landscape |
| 22.1 Middle East and Africa OTR Tyre Market Competitive Benchmarking, By Operating Parameters |
| 22.2 Saudi Arabia OTR Tyre Market Tyre Market Volume, By Company, 2018 |
| 22.3 UAE OTR Tyre Market Tyre Market Volume, By Company, 2018 |
| 22.4 Turkey OTR Tyre Market Tyre Market Volume, By Company, 2018 |
| 22.5 Oman OTR Tyre Market Tyre Market Volume, By Company, 2018 |
| 22.6 Bahrain OTR Tyre Market Tyre Market Volume, By Company, 2018 |
| 22.7 Kuwait OTR Tyre Market Tyre Market Volume, By Company, 2018 |
| 22.8 Qatar OTR Tyre Market Tyre Market Volume, By Company, 2018 |
| 22.9 South Africa OTR Tyre Market Tyre Market Volume, By Company, 2018 |
| 22.10 Egypt OTR Tyre Market Tyre Market Volume, By Company, 2018 |
| 22.11 Kenya OTR Tyre Market Tyre Market Volume, By Company, 2018 |
| 22.12 Nigeria OTR Tyre Market Tyre Market Volume, By Company, 2018 |
| 22.13 Tanzania OTR Tyre Market Tyre Market Volume, By Company, 2018 |
| 22.14 Ethiopia OTR Tyre Market Tyre Market Volume, By Company, 2018 |
| 23. Company Profiles |
| 23.1 Bridgestone Middle East & Africa FZE |
| 23.2 Promoteon Tyre Group S.R.L. |
| 23.3 Triangle Tyre Co. Ltd. |
| 23.4 Petlas Lastik San. Tic. Inc |
| 23.5 MRF Limited |
| 23.6 The Goodyear Tire & Rubber Co. |
| 23.7 Balkrishna Industries Limited |
| 23.8 Compagnie Generale des Etablissements Michelin SCA (Michelin SCA) |
| 23.9 Yokohama Rubber Company |
| 23.10 JK Tyres and Industries |
| 24. Key Strategic Recommendations |
| 25. Disclaimer |
| List of Figures |
| Figure 1. Middle East and Africa OTR Tyre Market Volume, 2016 - 2025F (Thousand Units) |
| Figure 2. Middle East and Africa OTR Tyre Market - Industry Life Cycle, 2018 |
| Figure 3. Middle East and Africa OTR Tyre Market Volume Share, By Regions, 2018 & 2025F |
| Figure 4. Middle East OTR Tyre Market Volume Share, By Countries, 2018 & 2025F |
| Figure 5. Africa OTR Tyre Market Volume Share, By Countries, 2018 & 2025F |
| Figure 6. MEA Urban Population As a Percentage of Total Population |
| Figure 7. Projects Pipeline in the GCC, By Industry & Country, as of January 2019 ($ Billion) |
| Figure 8. GCC Value of Contract Awards, By Country, 2014-18 ($ Million) |
| Figure 9. Saudi Arabia OTR Tyre Market Volume, 2016 - 2025F (Hundred Units) |
| Figure 10. Saudi Arabia OTR Tyre Market Volume Share, By Types, 2018 & 2025F |
| Figure 11. Saudi Arabia OTR Tyre Market Volume Share, By Sales Channels, 2018 & 2025F |
| Figure 12. Saudi Arabia OTR Tyre Market Volume Share, By Applications, 2018 & 2025F |
| Figure 13. Saudi Arabia Construction Application OTR Tyre Market Volume, 2016-2025F (Units) |
| Figure 14. Saudi Arabia Port Application OTR Tyre Market Volume, 2016-2025F (Units) |
| Figure 15. Saudi Arabia Mining Application OTR Tyre Market Volume, 2016-2025F (Units) |
| Figure 16. Saudi Arabia Others Application OTR Tyre Market Volume, 2016-2025F (Units) |
| Figure 17. Saudi Arabia OTR Tyre Market Volume Share, By Vehicle Types, 2018 & 2025F |
| Figure 18. Saudi Arabia Actual Government Spending Vs Actual Government Revenues, 2015-2023F (SR Billion) |
| Figure 19. Saudi Arabia Government Budget Spending Outlook, 2019E (SAR Billion) |
| Figure 20. Upcoming Economic Cities in Saudi Arabia |
| Figure 21. Riyadh Office Supply, 2014-2019E (‘000 Sq. m.) |
| Figure 22. Jeddah Office Supply, 2014-2019E (‘000 Sq. m.) |
| Figure 23. Riyadh Retail Supply, 2014-2019E (‘000 Sq. m.) |
| Figure 24. Jeddah Retail Supply, 2014-2019E (‘000 Sq. m.) |
| Figure 25. Riyadh Hotel Supply, 2014-2019E (No. of Rooms) |
| Figure 26. Jeddah Hotel Supply, 2014-2019E (No. of Rooms) |
| Figure 27. Major Upcoming Healthcare Projects in Saudi Arabia |
| Figure 28. Saudi Arabia Infrastructure Investment Forecast, 2018-2040 ($ Billion) |
| Figure 29. Saudi Arabia Infrastructure Investment Forecast, By Sector, 2016-2040 ($ Billion) |
| Figure 30. Saudi Arabia OTR Tyre Market Opportunity Assessment, By Types, 2025F |
| Figure 31. Saudi Arabia OTR Tyre Market Opportunity Assessment, By Sales Channel, 2025F |
| Figure 32. Saudi Arabia OTR Tyre Market Opportunity Assessment, By Applications, 2025F |
| Figure 33. UAE OTR Tyre Market Volume, 2016 - 2025F (Thousand Units) |
| Figure 34. UAE OTR Tyre Market Volume Share, By Types, 2018 & 2025F |
| Figure 35. UAE OTR Tyre Market Volume Share, By Sales Channels, 2018 & 2025F |
| Figure 36. UAE OTR Tyre Market Volume Share, By Applications, 2018 & 2025F |
| Figure 37. UAE Construction Application OTR Tyre Market Volume, 2016 - 2025F (Units) |
| Figure 38. UAE Port Application OTR Tyre Market Volume, 2016 - 2025F (Units) |
| Figure 39. UAE Mining Application OTR Tyre Market Volume, 2016 - 2025F (Units) |
| Figure 40. UAE Other Application OTR Tyre Market Volume, 2016 - 2025F (Units) |
| Figure 41. UAE OTR Tyre Market Volume Share, By Vehicle Types, 2018 & 2025F |
| Figure 42. U.A.E Actual Government Spending Vs Actual Government Revenues, 2015-2024F (AED Billion) |
| Figure 43. UAE OTR Tyre Market Opportunity Assessment, By Types, 2025F |
| Figure 44. UAE OTR Tyre Market Opportunity Assessment, By Sales Channels, 2025F |
| Figure 45. UAE OTR Tyre Market Opportunity Assessment, By Applications, 2025F |
| Figure 46. Turkey OTR Tyre Market Volume, 2016 - 2025F (Thousand Units) |
| Figure 47. Turkey OTR Tyre Market Volume Share, By Types, 2018 & 2025F |
| Figure 48. Turkey OTR Tyre Market Volume Share, By Sales Channels, 2018 & 2025F |
| Figure 49. Turkey OTR Tyre Market Volume Share, By Applications, 2018 & 2025F |
| Figure 50. Turkey Construction Application OTR Tyre Market Volume, 2016-2025F (Units) |
| Figure 51. Turkey Port Application OTR Tyre Market Volume, 2016-2025F (Units) |
| Figure 52. Turkey Mining Application OTR Tyre Market Volume, 2016-2025F (Units) |
| Figure 53. Turkey Other Application OTR Tyre Market Volume, 2016-2025F (Units) |
| Figure 54. Turkey OTR Tyre Market Volume Share, By Vehicle Types, 2018 & 2025F |
| Figure 55. Turkey Actual Government Spending Vs Actual Government Revenues, 2015-2024F (TL Billion) |
| Figure 56. Turkey Infrastructure Investment Forecast, 2018-2040 ($ Billion) |
| Figure 57. Turkey Infrastructure Investment Forecast, By Sector, 2016-2040 ($ Billion) |
| Figure 58. Turkey OTR Tyre Market Opportunity Assessment, By Types, 2025F |
| Figure 59. Turkey OTR Tyre Market Opportunity Assessment, By Sales Channels, 2025F |
| Figure 60. Turkey OTR Tyre Market Opportunity Assessment, By Applications, 2025F |
| Figure 61. Oman OTR Tyre Market Volume, 2016 - 2025F (Thousand Units) |
| Figure 62. Oman OTR Tyre Market Volume Share, By Types, 2018 & 2025F |
| Figure 63. Oman OTR Tyre Market Volume Share, By Sales Channels, 2018 & 2025F |
| Figure 64. Oman OTR Tyre Market Volume Share, By Applications, 2018 & 2025F |
| Figure 65. Oman Construction Application OTR Tyre Market Volume, 2016-2025F (Units) |
| Figure 66. Oman Port Application OTR Tyre Market Volume, 2016-2025F (Units) |
| Figure 67. Oman Mining Application OTR Tyre Market Volume, 2016-2025F (Units) |
| Figure 68. Oman Others Application OTR Tyre Market Volume, 2016-2025F (Units) |
| Figure 69. Oman OTR Tyre Market Volume Share, By Vehicle Types, 2018 & 2025F |
| Figure 70. Oman Actual Government Spending Vs Actual Government Revenues, 2015-2024F (OMR Billion) |
| Figure 71. Oman Government Budget Spending Outlook, 2018 (OMR Million) |
| Figure 72. Oman OTR Tyre Market Opportunity Assessment, By Types, 2025F |
| Figure 73. Oman OTR Tyre Market Opportunity Assessment, By Sales Channels, 2025F |
| Figure 74. Oman OTR Tyre Market Opportunity Assessment, By Applications, 2025F |
| Figure 75. Bahrain OTR Tyre Market Volume, 2016 - 2025F (Hundred Units) |
| Figure 76. Bahrain OTR Tyre Market Volume Share, By Types, 2018 & 2025F |
| Figure 77. Bahrain OTR Tyre Market Volume Share, By Sales Channels, 2018 & 2025F |
| Figure 78. Bahrain OTR Tyre Market Volume Share, By Applications, 2018 & 2025F |
| Figure 79. Bahrain Construction Application OTR Tyre Market Volume, 2016-2025F (Units) |
| Figure 80. Bahrain Port Application OTR Tyre Market Volume, 2016-2025F (Units) |
| Figure 81. Bahrain Mining Application OTR Tyre Market Volume, 2016-2025F (Units) |
| Figure 82. Bahrain Others Application OTR Tyre Market Volume, 2016-2025F (Units) |
| Figure 83. Bahrain OTR Tyre Market Volume Share, By Vehicle Types, 2018 & 2025F |
| Figure 84. Bahrain Actual Government Spending Vs Actual Government Revenues, 2015-2024F (BHD Billion) |
| Figure 85. Bahrain Forecasted Project Awards, 2018-2022 ($ Billion) |
| Figure 86. Bahrain Upcoming Projects, By Sectors ($ Billion) |
| Figure 87. Bahrain OTR Tyre Market Opportunity Assessment, By Types, 2025F |
| Figure 88. Bahrain OTR Tyre Market Opportunity Assessment, By Sales Channel, 2025F |
| Figure 89. Bahrain OTR Tyre Market Opportunity Assessment, By Applications, 2025F |
| Figure 90. Kuwait OTR Tyre Market Volume, 2016 - 2025F (Hundred Units) |
| Figure 91. Kuwait OTR Tyre Market Volume Share, By Types, 2018 & 2025F |
| Figure 92. Kuwait OTR Tyre Market Volume Share, By Sales Channels, 2018 & 2025F |
| Figure 93. Kuwait OTR Tyre Market Volume Share, By Applications, 2018 & 2025F |
| Figure 94. Kuwait Construction Application OTR Tyre Market Volume, 2016-2025F (Units) |
| Figure 95. Kuwait Port Application OTR Tyre Market Volume, 2016-2025F (Units) |
| Figure 96. Kuwait Others Application OTR Tyre Market Volume, 2016-2025F (Units) |
| Figure 97. Kuwait OTR Tyre Market Volume Share, By Vehicle Types, 2018 & 2025F |
| Figure 98. Kuwait Actual Government Spending Vs Actual Government Revenues, 2015-2024F (KWD Billion) |
| Figure 99. Kuwait OTR Tyre Market Opportunity Assessment, By Types, 2025F |
| Figure 100. Kuwait OTR Tyre Market Opportunity Assessment, By Sales Channel, 2025F |
| Figure 101. Kuwait OTR Tyre Market Opportunity Assessment, By Applications, 2025F |
| Figure 102. Qatar OTR Tyre Market Volume, 2016 - 2025F (Hundred Units) |
| Figure 103. Qatar OTR Tyre Market Volume Share, By Types, 2018 & 2025F |
| Figure 104. Qatar OTR Tyre Market Volume Share, By Sales Channels, 2018 & 2025F |
| Figure 105. Qatar OTR Tyre Market Volume Share, By Applications, 2018 & 2025F |
| Figure 106. Qatar Construction Application OTR Tyre Market Volume, 2016-2025F (Units) |
| Figure 107. Qatar Port Application OTR Tyre Market Volume, 2016-2025F (Units) |
| Figure 108. Qatar Mining Application OTR Tyre Market Volume, 2016-2025F (Units) |
| Figure 109. Qatar Others Application OTR Tyre Market Volume, 2016-2025F (Units) |
| Figure 110. Qatar OTR Tyre Market Volume Share, By Vehicle Types, 2018 & 2025F |
| Figure 111. Qatar Actual Government Spending Vs Actual Government Revenues, 2016-2024F (QAR Billion) |
| Figure 112. Qatar Budget Allocation for Financial Year 2019 ($ Billion) |
| Figure 113. Qatar Organized Retail Supply, 2012-2019 (‘000 Sq.m. GLA) |
| Figure 114. Upcoming Malls in Qatar |
| Figure 115. Qatar OTR Tyre Market Opportunity Assessment, By Types, 2025F |
| Figure 116. Qatar OTR Tyre Market Opportunity Assessment, By Sales Channel, 2025F |
| Figure 117. Qatar OTR Tyre Market Opportunity Assessment, By Applications, 2025F |
| Figure 118. South Africa OTR Tyre Market Volume, 2016 - 2025F (Thousand Units) |
| Figure 119. South Africa OTR Tyre Market Volume Share, By Types, 2018 & 2025F |
| Figure 120. South Africa OTR Tyre Market Volume Share, By Sales Channels, 2018 & 2025F |
| Figure 121. South Africa OTR Tyre Market Volume Share, By Applications, 2018 & 2025F |
| Figure 122. South Africa Construction Application OTR Tyre Market Volume, 2015-2025F (Units) |
| Figure 123. South Africa Port Application OTR Tyre Market Volume, 2015-2025F (Units) |
| Figure 124. South Africa Mining Application OTR Tyre Market Volume, 2015-2025F (Units) |
| Figure 125. South Africa Others Application OTR Tyre Market Volume, 2015-2025F (Units) |
| Figure 126. South Africa OTR Tyre Market Volume Share, By Vehicle Types, 2018 & 2025F |
| Figure 127. South Africa Actual Government Spending Vs Actual Government Revenues, 2015-2024F (RAND Trillion) |
| Figure 128. South Africa Public-sector Infrastructure Expenditure, 2014/15-2020/21 (Billion Rand) |
| Figure 129. South Africa Infrastructure Investment Forecast, 2018-2040 ($ Billion) |
| Figure 130. South Africa Infrastructure Investment Forecast, By Sector, 2016-2040 ($ Billion) |
| Figure 131. South Africa OTR Tyre Market Opportunity Assessment, By Types, 2025F |
| Figure 132. South Africa OTR Tyre Market Opportunity Assessment, By Sales Channels, 2025F |
| Figure 133. South Africa OTR Tyre Market Opportunity Assessment, By Applications, 2025F |
| Figure 134. Egypt OTR Tyre Market Volume, 2016 - 2025F (Thousand Units) |
| Figure 135. Egypt OTR Tyre Market Volume Share, By Types, 2018 & 2025F |
| Figure 136. Egypt OTR Tyre Market Volume Share, By Sales Channels, 2018 & 2025F |
| Figure 137. Egypt OTR Tyre Market Volume Share, By Applications, 2018 & 2025F |
| Figure 138. Egypt Construction Application OTR Tyre Market Volume, 2016-2025F (Units) |
| Figure 139. Egypt Port Application OTR Tyre Market Volume, 2016-2025F (Units) |
| Figure 140. Egypt Mining Application OTR Tyre Market Volume, 2016-2025F (Units) |
| Figure 141. Egypt Others Application OTR Tyre Market Volume, 2016-2025F (Units) |
| Figure 142. Egypt OTR Tyre Market Volume Share, By Vehicle Type, 2018 & 2025F |
| Figure 143. Egypt OTR Tyre Market Opportunity Assessment, By Types, 2025F |
| Figure 144. Egypt OTR Tyre Market Opportunity Assessment, By Sales Channels, 2025F |
| Figure 145. Egypt OTR Tyre Market Opportunity Assessment, By Applications, 2025F |
| Figure 146. Kenya OTR Tyre Market Volume, 2016 - 2025F (Thousand Units) |
| Figure 147. Kenya OTR Tyre Market Volume Share, By Types, 2018 & 2025F |
| Figure 148. Kenya OTR Tyre Market Volume Share, By Sales Channels, 2018 & 2025F |
| Figure 149. Kenya OTR Tyre Market Volume Share, By Applications, 2018 & 2025F |
| Figure 150. Kenya Construction Application OTR Tyre Market Volume, 2016-2025F (Units) |
| Figure 151. Kenya Port Application OTR Tyre Market Volume, 2016-2025F (Units) |
| Figure 152. Kenya Mining Application OTR Tyre Market Volume, 2016-2025F (Units) |
| Figure 153. Kenya Others Application OTR Tyre Market Volume, 2016-2025F (Units) |
| Figure 154. Kenya OTR Tyre Market Volume Share, By Vehicle Types, 2018 & 2025F |
| Figure 155. Kenya Actual Government Spending Vs Actual Government Revenues, 2015-2024F (Kenyan Shilling Trillion) |
| Figure 156. Upcoming Industrial Projects in Kenya |
| Figure 157. Kenya FDI Net Inflows 2016-2017 ($ Billion) |
| Figure 158. Kenya Infrastructure Investment Forecast, 2018-2040 ($ Billion) |
| Figure 159. Kenya Infrastructure Investment Forecast, By Sector, 2016-2040 ($ Billion) |
| Figure 160. Kenya OTR Tyre Market Opportunity Assessment, By Types, 2025F |
| Figure 161. Kenya OTR Tyre Market Opportunity Assessment, By Sales Channel, 2025F |
| Figure 162. Kenya OTR Tyre Market Opportunity Assessment, By Applications, 2025F |
| Figure 163. Nigeria OTR Tyre Market Volume, 2016 - 2025F (Hundred Units) |
| Figure 164. Nigeria OTR Tyre Market Volume Share, By Types, 2018 & 2025F |
| Figure 165. Nigeria OTR Tyre Market Volume Share, By Sales Channels, 2018 & 2025F |
| Figure 166. Nigeria OTR Tyre Market Volume Share, By Applications, 2018 & 2025F |
| Figure 167. Nigeria Construction Application OTR Tyre Market Volume, 2016-2025F (Units) |
| Figure 168. Nigeria Port Application OTR Tyre Market Volume, 2016-2025F (Units) |
| Figure 169. Nigeria Mining Application OTR Tyre Market Volume, 2016-2025F (Units) |
| Figure 170. Nigeria Others Application OTR Tyre Market Volume, 2016-2025F (Units) |
| Figure 171. Nigeria OTR Tyre Market Volume Share, By Vehicle Types, 2018 & 2025F |
| Figure 172. Nigeria Actual Government Spending Vs Actual Government Revenues, 2015-2024F (NGN Trillion) |
| Figure 173. Capital Expenditure of Key Ministries in Nigeria, 2017 &. 2018 ($ Million) |
| Figure 174. Oil Revenues and Non-Oil Revenues in Nigeria, 2017 & 2018 ($ Billion) |
| Figure 175. Nigeria Infrastructure Investment Forecast, 2018-2040 ($ Billion) |
| Figure 176. Nigeria Infrastructure Investment Forecast, By Sector, 2016-2040 ($ Billion) |
| Figure 177. Lagos Under Construction Office Space, 2014- 2020F (Cubic Meter) |
| Figure 178. Lekki Region Purpose Built Of?ce Stock, 2014- 2018 (Cubic Meter) |
| Figure 179. Nigeria Manufacturing Sector Growth Rate at Current Prices (Nominal Growth), Q1 2016 – Q3 2017 |
| Figure 180. Nigeria OTR Tyre Market Opportunity Assessment, By Types, 2025F |
| Figure 181. Nigeria OTR Tyre Market Opportunity Assessment, By Sales Channel, 2025F |
| Figure 182. Tanzania OTR Tyre Market Volume, 2016 - 2025F (Thousand Units) |
| Figure 183. Tanzania OTR Tyre Market Volume Share, By Types, 2018 & 2025F |
| Figure 184. Tanzania OTR Tyre Market Volume Share, By Sales Channels, 2018 & 2025F |
| Figure 185. Tanzania OTR Tyre Market Volume Share, By Applications, 2018 & 2025F |
| Figure 186. Tanzania Construction Application OTR Tyre Market Volume, 2016-2025F (Units) |
| Figure 187. Tanzania Port Application OTR Tyre Market Volume, 2016-2025F (Units) |
| Figure 188. Tanzania Mining Application OTR Tyre Market Volume, 2016-2025F (Units) |
| Figure 189. Tanzania Others Application OTR Tyre Market Volume, 2016-2025F (Units) |
| Figure 190. Tanzania OTR Tyre Market Volume Share, By Vehicle Types, 2018 & 2025F |
| Figure 191. Tanzania Actual Government Spending Vs Actual Government Revenues, 2015-2024F (TZS Trillion) |
| Figure 192. Tanzania Infrastructure Investment Forecast, 2018-2040 ($ Billion) |
| Figure 193. Tanzania Infrastructure Investment Forecast, By Sector, 2016-2040 ($ Billion) |
| Figure 194. Tanzania OTR Tyre Market Opportunity Assessment, By Types, 2025F |
| Figure 195. Tanzania OTR Tyre Market Opportunity Assessment, By Sales Channel, 2025F |
| Figure 196. Tanzania OTR Tyre Market Opportunity Assessment, By Applications, 2025F |
| Figure 197. Ethiopia OTR Tyre Market Volume, 2016 - 2025F (Thousand Units) |
| Figure 198. Ethiopia OTR Tyre Market Volume Share, By Types, 2018 & 2025F |
| Figure 199. Ethiopia OTR Tyre Market Volume Share, By Sales Channels, 2018 & 2025F |
| Figure 200. Ethiopia OTR Tyre Market Volume Share, By Applications, 2018 & 2025F |
| Figure 201. Ethiopia Construction Application OTR Tyre Market Volume, 2016-2025F (Units) |
| Figure 202. Ethiopia Port Application OTR Tyre Market Volume, 2016-2025F (Units) |
| Figure 203. Ethiopia Mining Application OTR Tyre Market Volume, 2016-2025F (Units) |
| Figure 204. Ethiopia Others Application OTR Tyre Market Volume, 2016-2025F (Units) |
| Figure 205. Ethiopia OTR Tyre Market Volume Share, By Vehicle Type, 2018 & 2025F |
| Figure 206. Ethiopia Actual Government Spending Vs Actual Government Revenues, 2015-2024F (Ethiopian Birr Billion) |
| Figure 207. Ethiopia Industrial Sector Growth Rate, 2016-2021F |
| Figure 208. Ethiopia OTR Tyre Market Opportunity Assessment, By Types, 2025F |
| Figure 209. Ethiopia OTR Tyre Market Opportunity Assessment, By Sales Channels, 2025F |
| Figure 210. Ethiopia OTR Tyre Market Opportunity Assessment, By Applications, 2025F |
| Figure 211. Tunisia OTR Tyre Market Volume, 2016 - 2025F (Hundred Units) |
| Figure 212. Tunisia OTR Tyre Market Volume Share, By Types, 2018 & 2025F |
| Figure 213. Tunisia OTR Tyre Market Volume Share, By Sales Channels, 2018 & 2025F |
| Figure 214. Tunisia OTR Tyre Market Volume Share, By Applications, 2018 & 2025F |
| Figure 215. Tunisia Construction Application OTR Tyre Market Volume, 2016-2025F (Units) |
| Figure 216. Tunisia Port Application OTR Tyre Market Volume, 2016-2025F (Units) |
| Figure 217. Tunisia Mining Application OTR Tyre Market Volume, 2016-2025F (Units) |
| Figure 218. Tunisia Others Application OTR Tyre Market Volume, 2016-2025F (Units) |
| Figure 219. Tunisia OTR Tyre Market Volume Share, By Vehicle Type, 2018 & 2025F |
| Figure 220. Tunisia Actual Government Spending Vs Actual Government Revenues, 2015-2024F (TND Billion) |
| Figure 221. Tunisia Infrastructure Investment Forecast, 2018-2040 ($ Million) |
| Figure 222. Tunisia Infrastructure Investment Forecast, By Sector, 2016-2040 ($ Billion) |
| Figure 223. Tunisia OTR Tyre Market Opportunity Assessment, By Types, 2025F |
| Figure 224. Tunisia OTR Tyre Market Opportunity Assessment, By Sales Channels, 2025F |
| Figure 225. Tunisia OTR Tyre Market Opportunity Assessment, By Applications, 2025F |
| Figure 226. Rest of Middle East and Africa OTR Tyre Market Volume, 2016 - 2025F (Hundred Units) |
| Figure 227. Saudi Arabia OTR Tyre Market Volume Rankings, By Companies, 2018 |
| Figure 228. UAE OTR Tyre Market Volume Ranking, By Company, 2018 |
| Figure 229. Turkey OTR Tyre Market Volume Rankings, By Companies, 2018 |
| Figure 230. Oman OTR Tyre Market Volume Ranking, By Companies, 2018 |
| Figure 231. Bahrain OTR Tyre Market Volume Rankings, By Companies, 2018 |
| Figure 232. Kuwait OTR Tyre Market Volume Rankings, By Companies, 2018 |
| Figure 233. Qatar OTR Tyre Market Volume Rankings, By Companies, 2018 |
| Figure 234. South Africa OTR Tyre Market Volume Rankings, By Companies, 2018 |
| Figure 235. Egypt OTR Tyre Market, Company Ranking, 2018 |
| Figure 236. Kenya OTR Tyre Market Volume Rankings, By Companies, 2018 |
| Figure 237. Nigeria OTR Tyre Market Volume Rankings, By Companies, 2018 |
| Figure 238. Nigeria OTR Tyre Market Opportunity Assessment, By Applications, 2025F |
| Figure 239. Tanzania OTR Tyre Market Volume Rankings, By Companies, 2018 |
| Figure 240. Ethiopia OTR Tyre Market, Company Ranking, 2018 |
| List of Tables |
| Table 1. MEA Upcoming Infrastructure Projects |
| Table 2. Upcoming Construction Projects in the Middle East |
| Table 3. GCC Value of Contract Awards, By Country, 2014-18 ($ Million) |
| Table 4. GCC Value of Contract Awards, By Sector, 2014-2018 ($ Million) |
| Table 5. Saudi Arabia OTR Tyre Market Volume, By Types, 2016-2025F (Units) |
| Table 6. Saudi Arabia OTR Tyre Market Volume, By Sales Channels, 2016-2025F (Units) |
| Table 7. Saudi Arabia OTR Tyre Market Volume, By Vehicle Types, 2016-2025F (Units) |
| Table 8. Upcoming Hotel Projects in Saudi Arabia |
| Table 9. List of Major Infrastructure Projects in Saudi Arabia |
| Table 10. UAE OTR Tyre Market Volume, By Types, 2016 - 2025F (Units) |
| Table 11. UAE OTR Tyre Market Volume, By Sales Channels, 2016 - 2025F (Units) |
| Table 12. UAE OTR Tyre Market Volume, By Vehicle Types, 2016 - 2025F (Units) |
| Table 13. List of Major Infrastructure Projects in UAE |
| Table 14. Upcoming Construction Projects in UAE |
| Table 15. Turkey OTR Tyre Market Volume, By Types, 2016-2025F (Units) |
| Table 16. Turkey OTR Tyre Market Volume, By Sales Channels, 2016-2025F (Units) |
| Table 17. Turkey OTR Tyre Market Volume, By Vehicle Types, 2016-2025F (Units) |
| Table 18. Oman OTR Tyre Market Volume, By Types, 2016-2025F (Units) |
| Table 19. Oman OTR Tyre Market Volume, By Sales Channels, 2016-2025F (Units) |
| Table 20. Oman OTR Tyre Market Volume, 2016-2025F (Units) |
| Table 21. Oman Upcoming Hotel Projects+A34A21:A21:A36 |
| Table 22. Oman Upcoming Industrial Projects |
| Table 23. Oman Major Road and Rail Projects |
| Table 24. Bahrain OTR Tyre Market Volume, By Types, 2016-2025F (Units) |
| Table 25. Bahrain OTR Tyre Market Volume, By Sales Channels, 2016-2025F (Units) |
| Table 26. Bahrain OTR Tyre Market Volume, By Vehicle Type, 2016-2025F (Units) |
| Table 27. Kuwait OTR Tyre Market Volume, By Types, 2016-2025F (Units) |
| Table 28. Kuwait OTR Tyre Market Volume, By Sales Channels, 2016-2025F (Units) |
| Table 29. Kuwait OTR Tyre Market Volume, By Vehicle Types, 2016-2025F (Units) |
| Table 30. Kuwait Upcoming Industrial Projects |
| Table 31. Kuwait Upcoming Hospitality Projects |
| Table 32. Kuwait Upcoming Residential Projects |
| Table 33. Qatar OTR Tyre Market Volume, By Types, 2016-2025F (Units) |
| Table 34. Qatar OTR Tyre Market Volume, By Sales Channels, 2016-2025F (Units) |
| Table 35. Qatar OTR Tyre Market Volume, By Vehicle Types, 2016-2025F (Units) |
| Table 36. Qatar Ongoing and Planned Projects Value Estimation, By Sub Sectors |
| Table 37. Upcoming Oil & Gas Projects in Qatar |
| Table 38. Qatar Upcoming Commercial Building Projects |
| Table 39. Qatar Under Development Commercial Infrastructure Projects |
| Table 40. Qatar Upcoming Residential Projects |
| Table 41. South Africa OTR Tyre Market Volumes, By Types, 2016-2025F (Units) |
| Table 42. South Africa OTR Tyre Market Volumes, By Sales Channels, 2016-2025F (Units) |
| Table 43. South OTR Tyre Market Volume, By Vehicle Types, 2016-2025F (Units) |
| Table 44. South Africa Upcoming Residential Projects |
| Table 45. Egypt OTR Tyre Market Volumes, By Types, 2016-2025F (Units) |
| Table 46. Egypt OTR Tyre Market Volumes, By Sales Channels, 2016-2025F (Units) |
| Table 47. Egypt OTR Tyre Market Volume, By Vehicle Type, 2016-2025F (Units) |
| Table 48. Kenya OTR Tyre Market Volume, By Types, 2016-2025F (Units) |
| Table 49. Kenya OTR Tyre Market Volume, By Sales Channels, 2016-2025F (Units) |
| Table 50. Kenya OTR Tyre Market Volume, By Vehicle Types, 2016-2025F (Units) |
| Table 51. Kenya Priority Industrial Sectors Under The Big 4 Agenda |
| Table 52. Nigeria OTR Tyre Market Volume, By Types, 2016-2025F (Units) |
| Table 53. Nigeria OTR Tyre Market Volume, By Sales Channels, 2016-2025F (Units) |
| Table 54. Nigeria OTR Tyre Market Volume, By Vehicle Types, 2016-2025F (Units) |
| Table 55. Priority Industries in the Manufacturing Sector in Accordance with Nigeria Vision 20.2020 |
| Table 56. Tanzania OTR Tyre Market Volume, By Types, 2016-2025F (Units) |
| Table 57. Tanzania OTR Tyre Market Volume, By Sales Channels, 2016-2025F (Units) |
| Table 58. Tanzania OTR Tyre Market Volume, By Vehicle Types, 2016-2025F (Units) |
| Table 59. Ethiopia OTR Tyre Market Volumes, By Types, 2016-2025F (Units) |
| Table 60. Ethiopia OTR Tyre Market Volumes, By Sales Channels, 2016-2025F (Units) |
| Table 61. Ethiopia OTR Tyre Market Volume, By Vehicle Type, 2016-2025F (Units) |
| Table 62. Upcoming Construction Projects in Ethiopia |
| Table 63. Hotel Chain Development Pipelines in Africa, 2018 |
| Table 64. New Highways or Expressways |
| Table 65. Tunisia OTR Tyre Market Volumes, By Types, 2016-2025F (Units) |
| Table 66. Tunisia OTR Tyre Market Volumes, By Sales Channels, 2016-2025F (Units) |
| Table 67. Tunisia OTR Tyre Market Volume, By Vehicle Types, 2016-2025F (Units) |
Global Go To Market Strategy - 2030
Export potential enables firms to identify high-growth global markets with greater confidence by combining advanced trade intelligence with a structured quantitative methodology. The framework analyzes emerging demand trends and country-level import patterns while integrating macroeconomic and trade datasets such as GDP and population forecasts, bilateral import–export flows, tariff structures, elasticity differentials between developed and developing economies, geographic distance, and import demand projections. Using weighted trade values from 2020–2024 as the base period to project country-to-country export potential for 2030, these inputs are operationalized through calculated drivers such as gravity model parameters, tariff impact factors, and projected GDP per-capita growth. Through an analysis of hidden potentials, demand hotspots, and market conditions that are most favorable to success, this method enables firms to focus on target countries, maximize returns, and global expansion with data, backed by accuracy.
By factoring in the projected importer demand gap that is currently unmet and could be potential opportunity, it identifies the potential for the Exporter (Country) among 190 countries, against the general trade analysis, which identifies the biggest importer or exporter.
To discover high-growth global markets and optimize your business strategy:
Click Here
Pricing
- Single User License$ 4,560
- Department License$ 5,055
- Site License$ 5,595
- Global License$ 6,000

Leadership Perspectives from Industry Events
Search
Thought Leadership and Analyst Meet


Our Clients
6WResearch In News
- India Air Conditioner Market Set for Strong Rebound in 2026 After Weather-Led Correction and GST-Driven Recovery: 6Wresearch
- ADAS in India: How Automatic Emergency Braking, Blind Spot Detection & Driver Monitoring are Transforming Road Safety
- Doha a strategic location for EV manufacturing hub: IPA Qatar
- Demand for luxury TVs surging in the GCC, says Samsung
- Empowering Growth: The Thriving Journey of Bangladesh’s Cable Industry
- Demand for luxury TVs surging in the GCC, says Samsung
Latest Reports
- Nicaragua RPG Gaming Market (2026-2032)
- New Zealand RPG Gaming Market (2026-2032)
- Netherlands RPG Gaming Market (2026-2032)
- Nauru RPG Gaming Market (2026-2032)
- Namibia RPG Gaming Market (2026-2032)
- Mozambique RPG Gaming Market (2026-2032)
- Montenegro RPG Gaming Market (2026-2032)
- Mongolia RPG Gaming Market (2026-2032)
- Monaco RPG Gaming Market (2026-2032)
- Micronesia RPG Gaming Market (2026-2032)
Industry Events and Analyst Meet

EV India Expo 2026

HIMTEX 2026

India Refining Summit 2026

India EV Show 2026

EV tech India Expo 2026
Whitepaper
- Middle East & Africa Commercial Security Market Click here to view more.
- Middle East & Africa Fire Safety Systems & Equipment Market Click here to view more.
- GCC Drone Market Click here to view more.
- Middle East Lighting Fixture Market Click here to view more.
- GCC Physical & Perimeter Security Market Click here to view more.