India Thermal Imaging Market (2016-2022) | Trends, Industry, Growth, Companies, Share, Revenue, Analysis, Value, Forecast, Size & Outlook
Market Forecast by Technologies (Cooled and Uncooled), Form Factors (Fixed and Handheld), Verticals (Defense/Military, Commercial and Industrial), Applications (Security, testing & Detection, Surveillance, Firefighting and Others) and Regions (North, South, East and West)
| Product Code: ETC000300 | Publication Date: Mar 2016 | Updated Date: Nov 2025 | Product Type: Report | |
| Publisher: 6Wresearch | Author: Ravi Bhandari | No. of Pages: 152 | No. of Figures: 70 | No. of Tables: 13 |
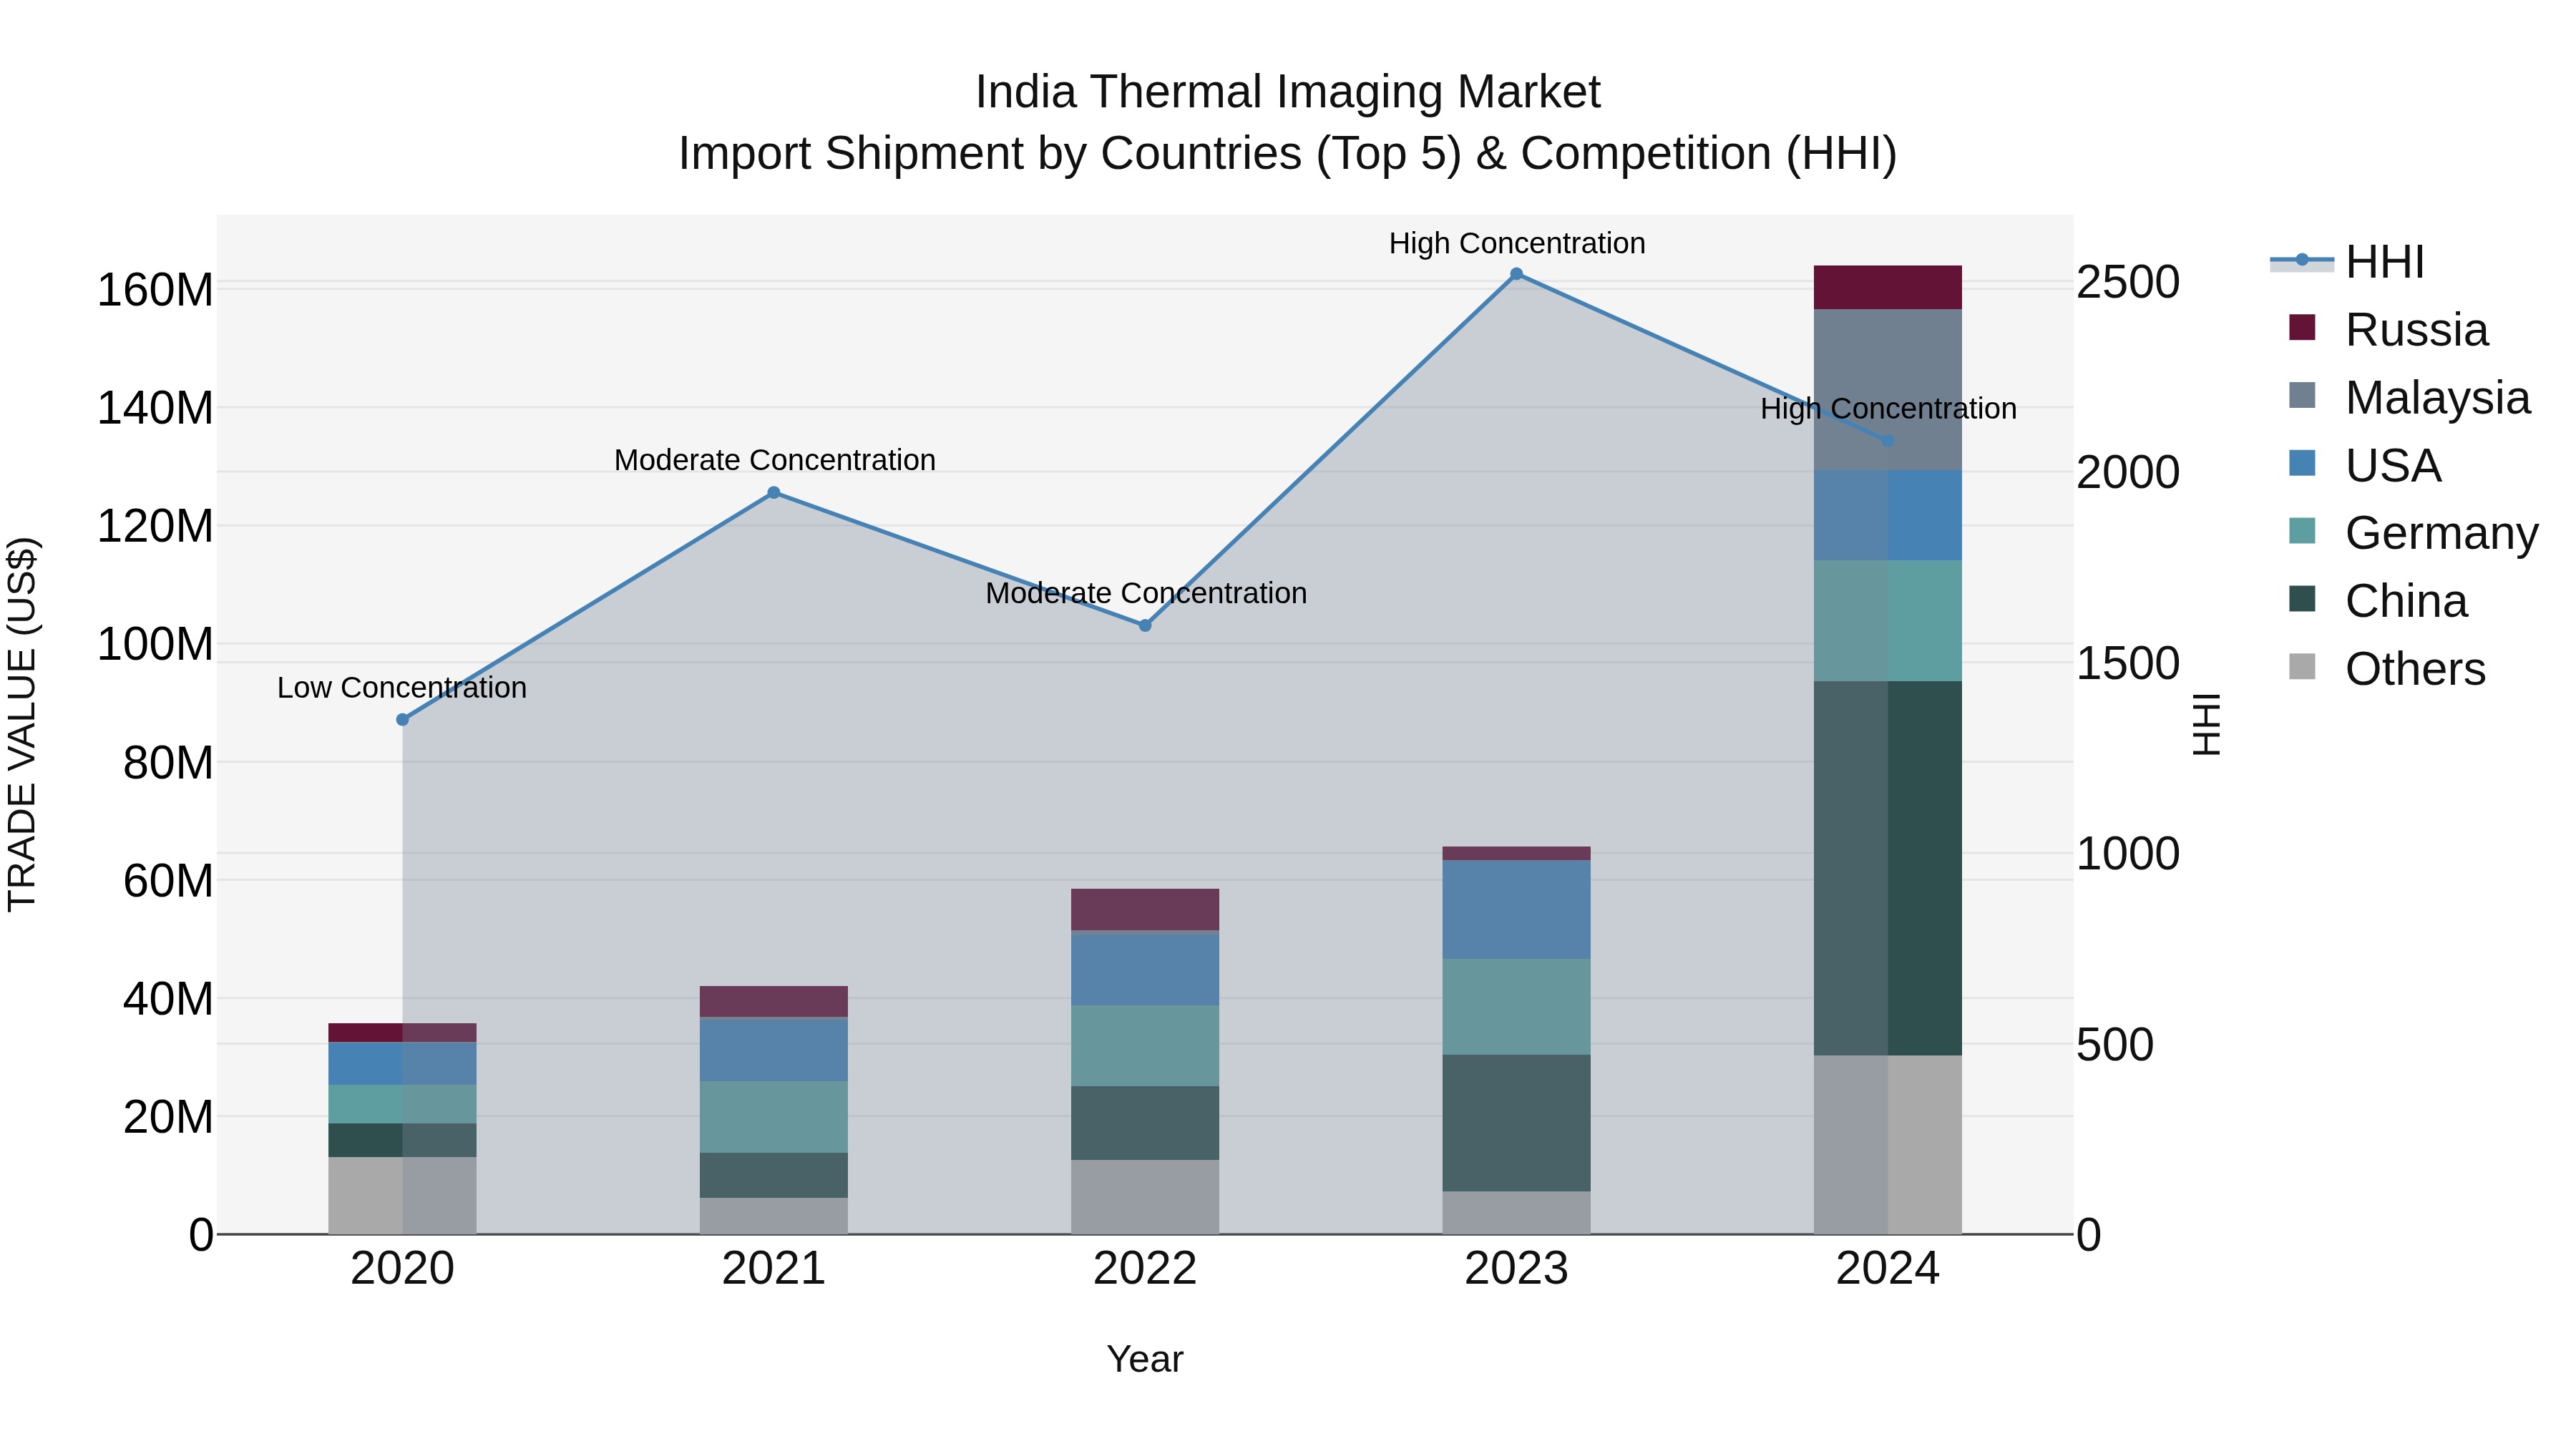
India Thermal Imaging Market Top 5 Importing Countries and Market Competition (HHI) Analysis
India`s thermal imaging import shipments in 2024 saw significant growth, with top exporting countries being China, Malaysia, Germany, USA, and Russia. The market remained concentrated, with a high Herfindahl-Hirschman Index (HHI). The compound annual growth rate (CAGR) from 2020 to 2024 was an impressive 46.32%, showcasing the increasing demand for thermal imaging technology in India. Moreover, the growth rate from 2023 to 2024 surged by 149.92%, indicating a rapid expansion in the market. This data suggests a strong momentum in the thermal imaging sector in India.
India thermal imaging market has been divided into two major sub-segment markets i.e. cooled and uncooled thermal imaging devices & systems. Apart from this India thermal imaging market is further divided into form factors, i.e. fixed-mounted (rotary & non-rotary) and handheld thermal imaging devices & systems.According to 6Wresearch, India thermal imaging market is projected to reach 8.9% during 2016-22. India thermal imaging market is dominated by defense vertical. Presently, uncooled handheld thermal imaging devices accounted for majority of the market demand, wherein Bharat Electronics held majority of the market volume share followed by FLIR, Fluke and others.Amongst all applications, surveillance application acquired largest revenue share owing to deployment of thermal imaging devices and systems for border security, air & ground based surveillance and overall military application. Over the next six years, industrial and commercial verticals are forecast to grow at relatively higher CAGR from 2016 to 2022 attributed to increasing consumer awareness for testing and detection applications.The report thoroughly covers thermal imaging market types, technology, applications and verticals. The report provides an unbiased and detailed analysis of the on-going trends, opportunities/high growth areas, market drivers which would help the stakeholders to decide and align their market strategies according to the current and future market dynamics.
Key Highlights of the Report:
• Market Dynamics Including Drivers, Restraints, Opportunities for India Thermal Imaging Market
• Historical Market Revenue & Volume Trends for Global Thermal Imaging Market, 2010 - 2015
• Market Size & Revenue & Volume Forecast of Global Thermal Imaging Market until 2022
• Historical Market Revenue Trends for India Thermal Imaging Market, 2012 - 2015
• Market Size & Revenue Forecast of India Thermal Imaging Market until 2022
• Historical Market Volume Trends for India Thermal Imaging Market, 2012 - 2015
• Market Size & Volume Forecast of India Thermal Imaging Market until 2022
• Market Volume and Revenue Forecast and Estimations by Technology until 2022
• Market Volume and Revenue Forecast and Estimations by Form Factor until 2022
• Market Revenue Trends and Forecast by Verticals & Applications until 2022
• Market Share Quarterly & Annual Analysis, By Technical Specification
• Market Revenue Trends and Forecast by Region until 2022
• India Thermal Imaging Market Opportunities, By UAV Market
• India Thermal Imaging Market Opportunities, By Video Surveillance Market
• SWOT Analysis
• India Thermal Imaging Market -Government Initiatives and Regulations
• India Thermal Imaging Market -Key Performance Indicators
• India Thermal Imaging Market -Distributor Analysis
• Existing Market Trends
• Industry Life Cycle & Value Chain Analysis
• Porter's Five Forces Analysis
• Players Market Share
• Competitive Benchmarking
• Company Profiles and Key Strategic PointersMarkets Covered:
The report provides the detailed analysis of the following market segments:• By Technologies:
o Cooled
o Uncooled
• Form Factors:
o Fixed Mount
o Rotary
o Non-Rotary
o Handheld
• Verticals:
o Defense/Military
o Commercial
o Industrial
• Applications:
o Security
o Testing & Detection
o Surveillance
o Firefighting
o Others
• Regions:
o North
o South
o East
o West
Frequently Asked Questions About the Market Study (FAQs):
6Wresearch actively monitors the India Thermal Imaging Market and publishes its comprehensive annual report, highlighting emerging trends, growth drivers, revenue analysis, and forecast outlook. Our insights help businesses to make data-backed strategic decisions with ongoing market dynamics. Our analysts track relevent industries related to the India Thermal Imaging Market, allowing our clients with actionable intelligence and reliable forecasts tailored to emerging regional needs.
Yes, we provide customisation as per your requirements. To learn more, feel free to contact us on sales@6wresearch.com
1 Executive Summary
2 Introduction
2.1 Key Highlights of the Report
2.2 Report Description
2.3 Market Scope & Segmentation
2.4 Assumptions & Methodology
3 Global Thermal Imaging Market Overview
3.1 Global Thermal Imaging Market Revenues (2012-2022F)
3.2 Global Thermal Imaging Market Volume (2012-2022F)
3.3 Global Thermal Imaging Market Revenue Share, By Region (2015 & 2022F)
4 India Thermal Imaging Market Overview
4.1 India Thermal Imaging Market Revenues (2012-2022F)
4.2 India Thermal Imaging Market Volume (2012-2022F)
4.3 India Thermal Imaging Industry Life Cycle
4.4 India Thermal Imaging Market Opportunistic Matrix
4.5 India Thermal Imaging Market Value Chain Analysis
4.6 India Thermal Imaging Market Porter's Five Forces Model
4.7 India Thermal Imaging Market Revenue Share, By Technology (2015 & 2022F)
4.8 India Thermal Imaging Market Revenue Share, By Vertical (2015 & 2022F)
5 India Thermal Imaging Market SWOT Analysis
6 India Thermal Imaging Market Dynamics
6.1 Impact Analysis
6.2 Market Drivers
6.3 Market Restraints
7 India Thermal Imaging Market Current & Future Trends
7.1 New Packaging Techniques to Reduce Price
7.2 Growing India's ESDM Market
8 India Thermal Imaging Market Overview, By Technology
8.1 India Cooled Thermal Imaging Devices/ Systems' Market Revenues & Volume (2012-2022F)
8.2 India Uncooled Thermal Imaging Devices/ Systems' Market Revenues & Volume (2012-2022F)
9 India Thermal Imaging Market Overview, By Form Factor
9.1 India Fixed-Mounted Thermal Imaging Devices/ Systems' Market Revenues & Volume (2012-2022F)
9.1.1 India Fixed-Mounted Thermal Imaging Devices/ Systems' Market Revenues & Volume,
By Type (2012-2022F)
9.2 India Handheld Thermal Imaging Devices/ Systems' Market Revenues & Volume (2012-2022F)
10 India Thermal Imaging Market Overview, By Vertical
10.1 India Thermal Imaging Market Revenues, By Military/ Defense Vertical (2012-2022F)
10.2 India Thermal Imaging Market Volume, By Military/ Defense Vertical (2012-2022F)
10.3 Key Defense Projects for Thermal Imaging Devices/ Systems
10.4 India Thermal Imaging Market Revenues, By Industrial Vertical (2012-2022F)
10.5 India Thermal Imaging Market Volume, By Industrial Vertical (2012-2022F)
10.6 India Thermal Imaging Market Revenues, By Commercial Vertical (2012-2022F)
10.7 India Thermal Imaging Market Volume, By Commercial Vertical (2012-2022F)
11 India Thermal Imaging Market Overview, By Applications
11.1 India Thermal Imaging Market Revenues, By Applications (2012-2015)
11.2 India Thermal Imaging Market Revenues, By Applications (2016E-2022F)
11.3 India Thermal Imaging Market Volume, By Applications (2012-2015F)
11.4 India Thermal Imaging Market Volume, By Applications (2016E-2022F)
12 India Thermal Imaging Market Overview, By Technical Specification
12.1 India Thermal Imaging Market Share, By Range of Megapixel (2014 & 2015)
12.2 India Thermal Imaging Market Share, By Range of Thermal Sensitivity (2014 & 2015)
12.3 India Thermal Imaging Market Share, By Range of Detector Resolution (2014 & 2015)
12.4 India Thermal Imaging Market Share, By Display (2014 & 2015)
12.5 India Thermal Imaging Market Share, By Range of Display Resolution (2014 & 2015)
12.6 India Thermal Imaging Market Share, By Bluetooth (2014 & 2015)
12.7 India Thermal Imaging Market Share, By Wi-Fi (2014 & 2015)
12.8 India Thermal Imaging Market Share, By USB (2014 & 2015)
13 India Thermal Imaging Market Overview, By Region
13.1 Northern & Southern India Thermal Imaging Market Revenues (2015-2022F)
13.2 Eastern & Western India Thermal Imaging Market Revenues (2015-2022F)
14 India Thermal Imaging Market Opportunities, By UAV Market
14.1 India UAV Market Revenues & Volume (2012-2021F)
14.2 India UAV Market Volume, By UAV Type (2012-2021F)
14.3 India UAV Market Volume, By UAV Vertical (2012-2021F)
14.4 Upcoming UAV Projects
15 India Thermal Imaging Market Opportunities, By Video Surveillance Market
15.1 India Video Surveillance Market Revenues (2012-2021F)
15.2 India Video Surveillance Market Revenues, By Video Surveillance Type (2012-2021F)
15.3 CCTV Manufacturers/ Assemblers in India and Potential Tie-up Opportunities
16 India Thermal Imaging Market Price Trend, By Technology
16.1 India Cooled Thermal Imaging Devices/ Systems' Market Price Trend, (2012-2022F)
16.2 India Uncooled Thermal Imaging Devices/ Systems' Market Price Trend, (2012-2022F)
17 India Thermal Imaging Market Price Trend, By Form Factor
17.1 India Fixed-Mounted Thermal Imaging Devices/ Systems' Market Price Trend (2012-2022F)
17.2 India Handheld Thermal Imaging Devices Market Price Trend (2012-2022F)
18 India Thermal Imaging Market -Government Initiatives and Regulations
19 India Thermal Imaging Market -Key Performance Indicators
19.1 India Military Spending -Army, Navy and Air force (2013-2022F)
19.2 India Construction Spending (2010-2022F)
19.3 India Energy/Electricity Production (2010-2022F)
19.4 India Oil & Gas Production (2010-2022F)
20 India Thermal Imaging Market -Distributor Analysis
20.1 Distributor Channel Overview
20.2 Major Thermal Imaging Distributors in India
20.3 Voice of Distributors
21 Competitive Landscape
21.1 India Thermal Imaging Market Volume Share, By Company (2015)
21.2 Competitive Benchmarking, By Application
22 Company Profiles
22.1 FLIR Systems, Inc.
22.2 Fluke Corporation
22.3 Testo India Pvt. Ltd.
22.4 Bharat Electronics Limited
22.5 Tak Technologies Pvt. Ltd.
22.6 Elbit Systems Ltd.
23 Key Strategic Note
24 Disclaimer
List of Figures
Figure 1 Global Thermal Imaging Market Revenues, 2010-2022F ($ Billion)
Figure 2 Global Thermal Imaging Market Volume, 2010-2022F (Million Units)
Figure 3 Global Thermal Imaging Devices/ Systems' Market Price Trend, 2010-2022F ($ Per Unit)
Figure 4 Global Thermal Imaging Market Revenue Share, By Region (2015)
Figure 5 India Thermal Imaging Market Revenues, 2012-2022F ($ Million)
Figure 6 Thermal Imaging Market Revenue Share, By India Vs. Rest of the World, 2015
Figure 7 India Thermal Imaging Market Volume, 2012-2022F (Units)
Figure 8 Thermal Imaging Market Volume Share, By India Vs. Rest of the World, 2015
Figure 9 India Homeland Security Expenditure, 2010-2022F ($ Billion)
Figure 10 India Thermal Imaging Industry Life Cycle (2015)
Figure 11 Value Chain Analysis of India Thermal Imaging Market
Figure 12 India Thermal Imaging Market Revenue Share, By Technology (2015)
Figure 13 India Thermal Imaging Market Revenue Share, By Technology (2022F)
Figure 14 India Thermal Imaging Market Revenue Share, By Vertical (2015)
Figure 15 India Thermal Imaging Market Revenue Share, By Vertical (2022F)
Figure 16 India Thermal Imaging Devices/ Systems' Market Price Trend, 2012-2022 ($ Thousand Per Unit)
Figure 17 India Cooled Thermal Imaging Devices/ Systems' Market Revenues & Volume, 2012-2022F ($ Million & Units)
Figure 18 India Uncooled Thermal Imaging Devices/ Systems' Market Revenues & Volume, 2012-2022F ($ Million & Units)
Figure 19 India Fixed-Mounted Thermal Imaging Devices/ Systems' Market Revenues, 2012-2022F ($ Million & Units)
Figure 20 India Rotary Fixed-Mounted Thermal Imaging Devices/ Systems' Market Revenues & Volume, 2012-2022F ($ Million & Units)
Figure 21 India Non-Rotary Fixed-Mounted Thermal Imaging Devices/ Systems' Market Revenues & Volume, 2012-2022F ($ Million & Units)
Figure 22 India Handheld Thermal Imaging Devices/ Systems' Market Revenues, 2012-2022F ($ Million & Units)
Figure 23 India Thermal Imaging Military/ Defense Market Revenues, 2012-2022F ($ Million)
Figure 24 India Thermal Imaging Military/ Defense Vertical Market Volume, 2012-2022F (Units)
Figure 25 India Thermal Imaging Industrial Vertical Market Revenues, 2012-2022F ($ Million)
Figure 26 India Thermal Imaging Industrial Vertical Market Volume, 2012-2022F (Units)
Figure 27 India Thermal Imaging Commercial Vertical Market Revenues, 2012-2022F ($ Million)
Figure 28 India Thermal Imaging Commercial Vertical Market Volume, 2012-2022F (Units)
Figure 29 India Thermal Imaging Market Revenues, By Applications, 2012-2015 ($ Million)
Figure 30 India Thermal Imaging Market Revenues, By Applications, 2016E-2022F ($ Million)
Figure 31 India Thermal Imaging Market Revenue Growth, By Applications, 2012-2022F (in %)
Figure 32 India Thermal Imaging Market Volume, By Applications, 2012-2015 (Units)
Figure 33 India Thermal Imaging Market Volume, By Applications, 2016E-2022F (Units)
Figure 34 India Thermal Imaging Market Volume Growth, By Applications, 2012-2022F (in %)
Figure 35 India Thermal Imaging Market Share, By Range of Megapixel (Quarter-wise Comparison - 2014 Vs. 2015)
Figure 36 India Thermal Imaging Market Share, By Range of Megapixel (Annual Comparison - 2014 Vs. 2015)
Figure 37 India Thermal Imaging Market Share, By Range of Thermal Sensitivity (Quarter-wise Comparison - 2014 Vs. 2015)
Figure 38 India Thermal Imaging Market Share, By Range of Thermal Sensitivity (Annual Comparison - 2014 Vs. 2015)
Figure 39 India Thermal Imaging Market Share, By Range of Detector Resolution (Quarter-wise Comparison - 2014 Vs. 2015)
Figure 40 India Thermal Imaging Market Share, By Range of Detector Resolution (Annual Comparison - 2014 Vs. 2015)
Figure 41 India Thermal Imaging Market Share, By Display (Quarter-wise Comparison - 2014 Vs. 2015)
Figure 42 India Thermal Imaging Market Share, By Display (Annual Comparison - 2014 Vs. 2015)
Figure 43 India Thermal Imaging Market Share, By Display Resolution (Quarter-wise Comparison - 2014 Vs. 2015)
Figure 44 India Thermal Imaging Market Share, By Display Resolution (Annual Comparison - 2014 Vs. 2015)
Figure 45 India Thermal Imaging Market Share, By Bluetooth (Quarter-wise Comparison - 2014 Vs. 2015)
Figure 46 India Thermal Imaging Market Share, By Bluetooth (Annual Comparison - 2014 Vs. 2015)
Figure 47 India Thermal Imaging Market Share, By Wi-Fi (Quarter-wise Comparison - 2014 Vs. 2015)
Figure 48 India Thermal Imaging Market Share, By Wi-Fi (Annual Comparison - 2014 Vs. 2015)
Figure 49 India Thermal Imaging Market Share, By USB (Quarter-wise Comparison - 2014 Vs. 2015)
Figure 50 India Thermal Imaging Market Share, By USB (Annual Comparison - 2014 Vs. 2015)
Figure 51 Northern India Thermal Imaging Market Revenues, 2015-2022F ($ Million)
Figure 52 Southern India Thermal Imaging Market Revenues, 2015-2022F ($ Million)
Figure 53 Eastern India Thermal Imaging Market Revenues, 2015-2022F ($ Million)
Figure 54 Western India Thermal Imaging Market Revenues, 2015-2022F ($ Million)
Figure 55 India UAV Market Revenues & Volume, 2012-2021F ($ Million & Thousand Units)
Figure 56 India UAV Market Volume, By UAV Type 2012-2021F (Units)
Figure 57 India UAV Market Volume, By Vertical 2012-2022F (Units)
Figure 58 India Video Surveillance Market Revenues, 2012-2021F ($ Million)
Figure 59 India Video Surveillance Market Revenues, By Type, 2012-2021F ($ Million)
Figure 60 India Cooled Thermal Imaging Devices/ Systems' Market Price Trend, 2012-2022F ($ Thousand Per Unit)
Figure 61 India Uncooled Thermal Imaging Devices/ Systems' Market Price Trend, 2012-2022F ($ Thousand Per Unit)
Figure 62 India Fixed-Mounted Thermal Imaging Devices/ Systems' Market Price Trend, 2012-2022F ($ Thousand Per Unit)
Figure 63 India Hand Thermal Imaging Devices/ Systems' Market Price Trend, 2012-2022F ($ Per Unit)
Figure 64 India Defense Spending, By Verticals, 2013-2022F ($ Billion)
Figure 65 India Construction Market Spending, 2010-2022F ($ Billion)
Figure 66 India Energy/ Electricity Production, 2010-2022F (Terawatt-hours)
Figure 67 India Oil Production, 2010-2022F (Thousand Barrels Per Day)
Figure 68 India Gas Production, 2010-2022F (Billion Cubic Meters)
Figure 69 India Thermal Imaging Market Volume Share, By Company (2015)
Figure 70 FLIR Systems, Inc. Revenue Share, By Segment (Q3'2015)
List of Tables
Table 1 Key Defense Projects for Thermal Imaging Devices/ Systems
Table 2 Organizations under the Department of Defense Production
Table 3 Value of Production of Defense PSUs and OFB, 2011-2015 ($ Million)
Table 4 Financial Allocation for Different Category of Projects, 2014-2015 ($ Million)
Table 5 Products/ Systems/ Technologies Developed by DRDO till 2015, ($ Million)
Table 6 Service/ Department-wise Break-up of Defense Expenditure, ($ Million)
Table 7 Government UAV Programs and Expected Budgets
Table 8 CCTV Manufacturers/ Assemblers in India and Potential Tie-up Opportunities
Table 9 Thermal Imaging Distributors in India
Table 10 India Thermal Imaging Market Volume Share of Top 3 Players, 2015 (Units)
Table 11 FLIR Systems, Model & Price (2015)
Table 12 Fluke Corporation, Model & Price (2015)
Table 13 Testo India Pvt. Ltd., Model & Price (2015)
Thermal imaging being a new technology in Indian market is registering potential deployment in defense, industrial and commercial verticals for applications pertaining to border security surveillance, testing & measurement, firefighting and process automation. Increasing terrorist activities, increasing defense budget for military & homeland security coupled with favorable government policies buoyed India thermal imaging market.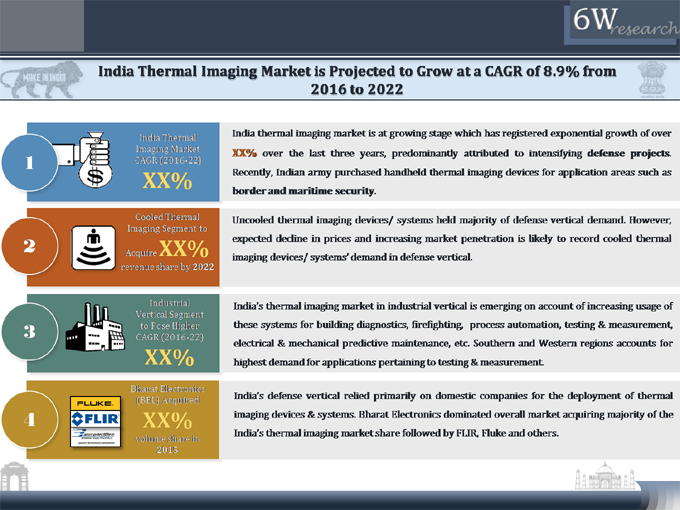
Global Go To Market Strategy - 2030
Export potential enables firms to identify high-growth global markets with greater confidence by combining advanced trade intelligence with a structured quantitative methodology. The framework analyzes emerging demand trends and country-level import patterns while integrating macroeconomic and trade datasets such as GDP and population forecasts, bilateral import–export flows, tariff structures, elasticity differentials between developed and developing economies, geographic distance, and import demand projections. Using weighted trade values from 2020–2024 as the base period to project country-to-country export potential for 2030, these inputs are operationalized through calculated drivers such as gravity model parameters, tariff impact factors, and projected GDP per-capita growth. Through an analysis of hidden potentials, demand hotspots, and market conditions that are most favorable to success, this method enables firms to focus on target countries, maximize returns, and global expansion with data, backed by accuracy.
By factoring in the projected importer demand gap that is currently unmet and could be potential opportunity, it identifies the potential for the Exporter (Country) among 190 countries, against the general trade analysis, which identifies the biggest importer or exporter.
To discover high-growth global markets and optimize your business strategy:
Click Here
Pricing
- Single User License$ 1,995
- Department License$ 2,400
- Site License$ 3,120
- Global License$ 3,795

Leadership Perspectives from Industry Events
Search
Thought Leadership and Analyst Meet


Our Clients
6WResearch In News
- India Export Attractiveness Tracker 2026
- India Air Conditioner Market Set for Strong Rebound in 2026 After Weather-Led Correction and GST-Driven Recovery: 6Wresearch
- ADAS in India: How Automatic Emergency Braking, Blind Spot Detection & Driver Monitoring are Transforming Road Safety
- Doha a strategic location for EV manufacturing hub: IPA Qatar
- Demand for luxury TVs surging in the GCC, says Samsung
- Empowering Growth: The Thriving Journey of Bangladesh’s Cable Industry
Latest Reports
- Nicaragua RPG Gaming Market (2026-2032)
- New Zealand RPG Gaming Market (2026-2032)
- Netherlands RPG Gaming Market (2026-2032)
- Nauru RPG Gaming Market (2026-2032)
- Namibia RPG Gaming Market (2026-2032)
- Mozambique RPG Gaming Market (2026-2032)
- Montenegro RPG Gaming Market (2026-2032)
- Mongolia RPG Gaming Market (2026-2032)
- Monaco RPG Gaming Market (2026-2032)
- Micronesia RPG Gaming Market (2026-2032)
Industry Events and Analyst Meet

EV India Expo 2026

HIMTEX 2026

India Refining Summit 2026

India EV Show 2026

EV tech India Expo 2026
Whitepaper
- Middle East & Africa Commercial Security Market Click here to view more.
- Middle East & Africa Fire Safety Systems & Equipment Market Click here to view more.
- GCC Drone Market Click here to view more.
- Middle East Lighting Fixture Market Click here to view more.
- GCC Physical & Perimeter Security Market Click here to view more.