Japan Magnetic Materials Market (2020-2026) | Outlook, Size, Share, Growth, Forecast, Industry, Companies, COVID-19 IMPACT, Revenue, Value, Analysis & Trends
Market Forecast By Product Types (Semi-hard Magnet, Soft Magnet, Hard Magnet), By Applications (Automotive, Electronics, Industrial, Power Generation, Others) And Competitive Landscape
| Product Code: ETC008982 | Publication Date: Jun 2023 | Updated Date: Oct 2025 | Product Type: Report | |
| Publisher: 6Wresearch | Author: Ravi Bhandari | No. of Pages: 70 | No. of Figures: 35 | No. of Tables: 5 |
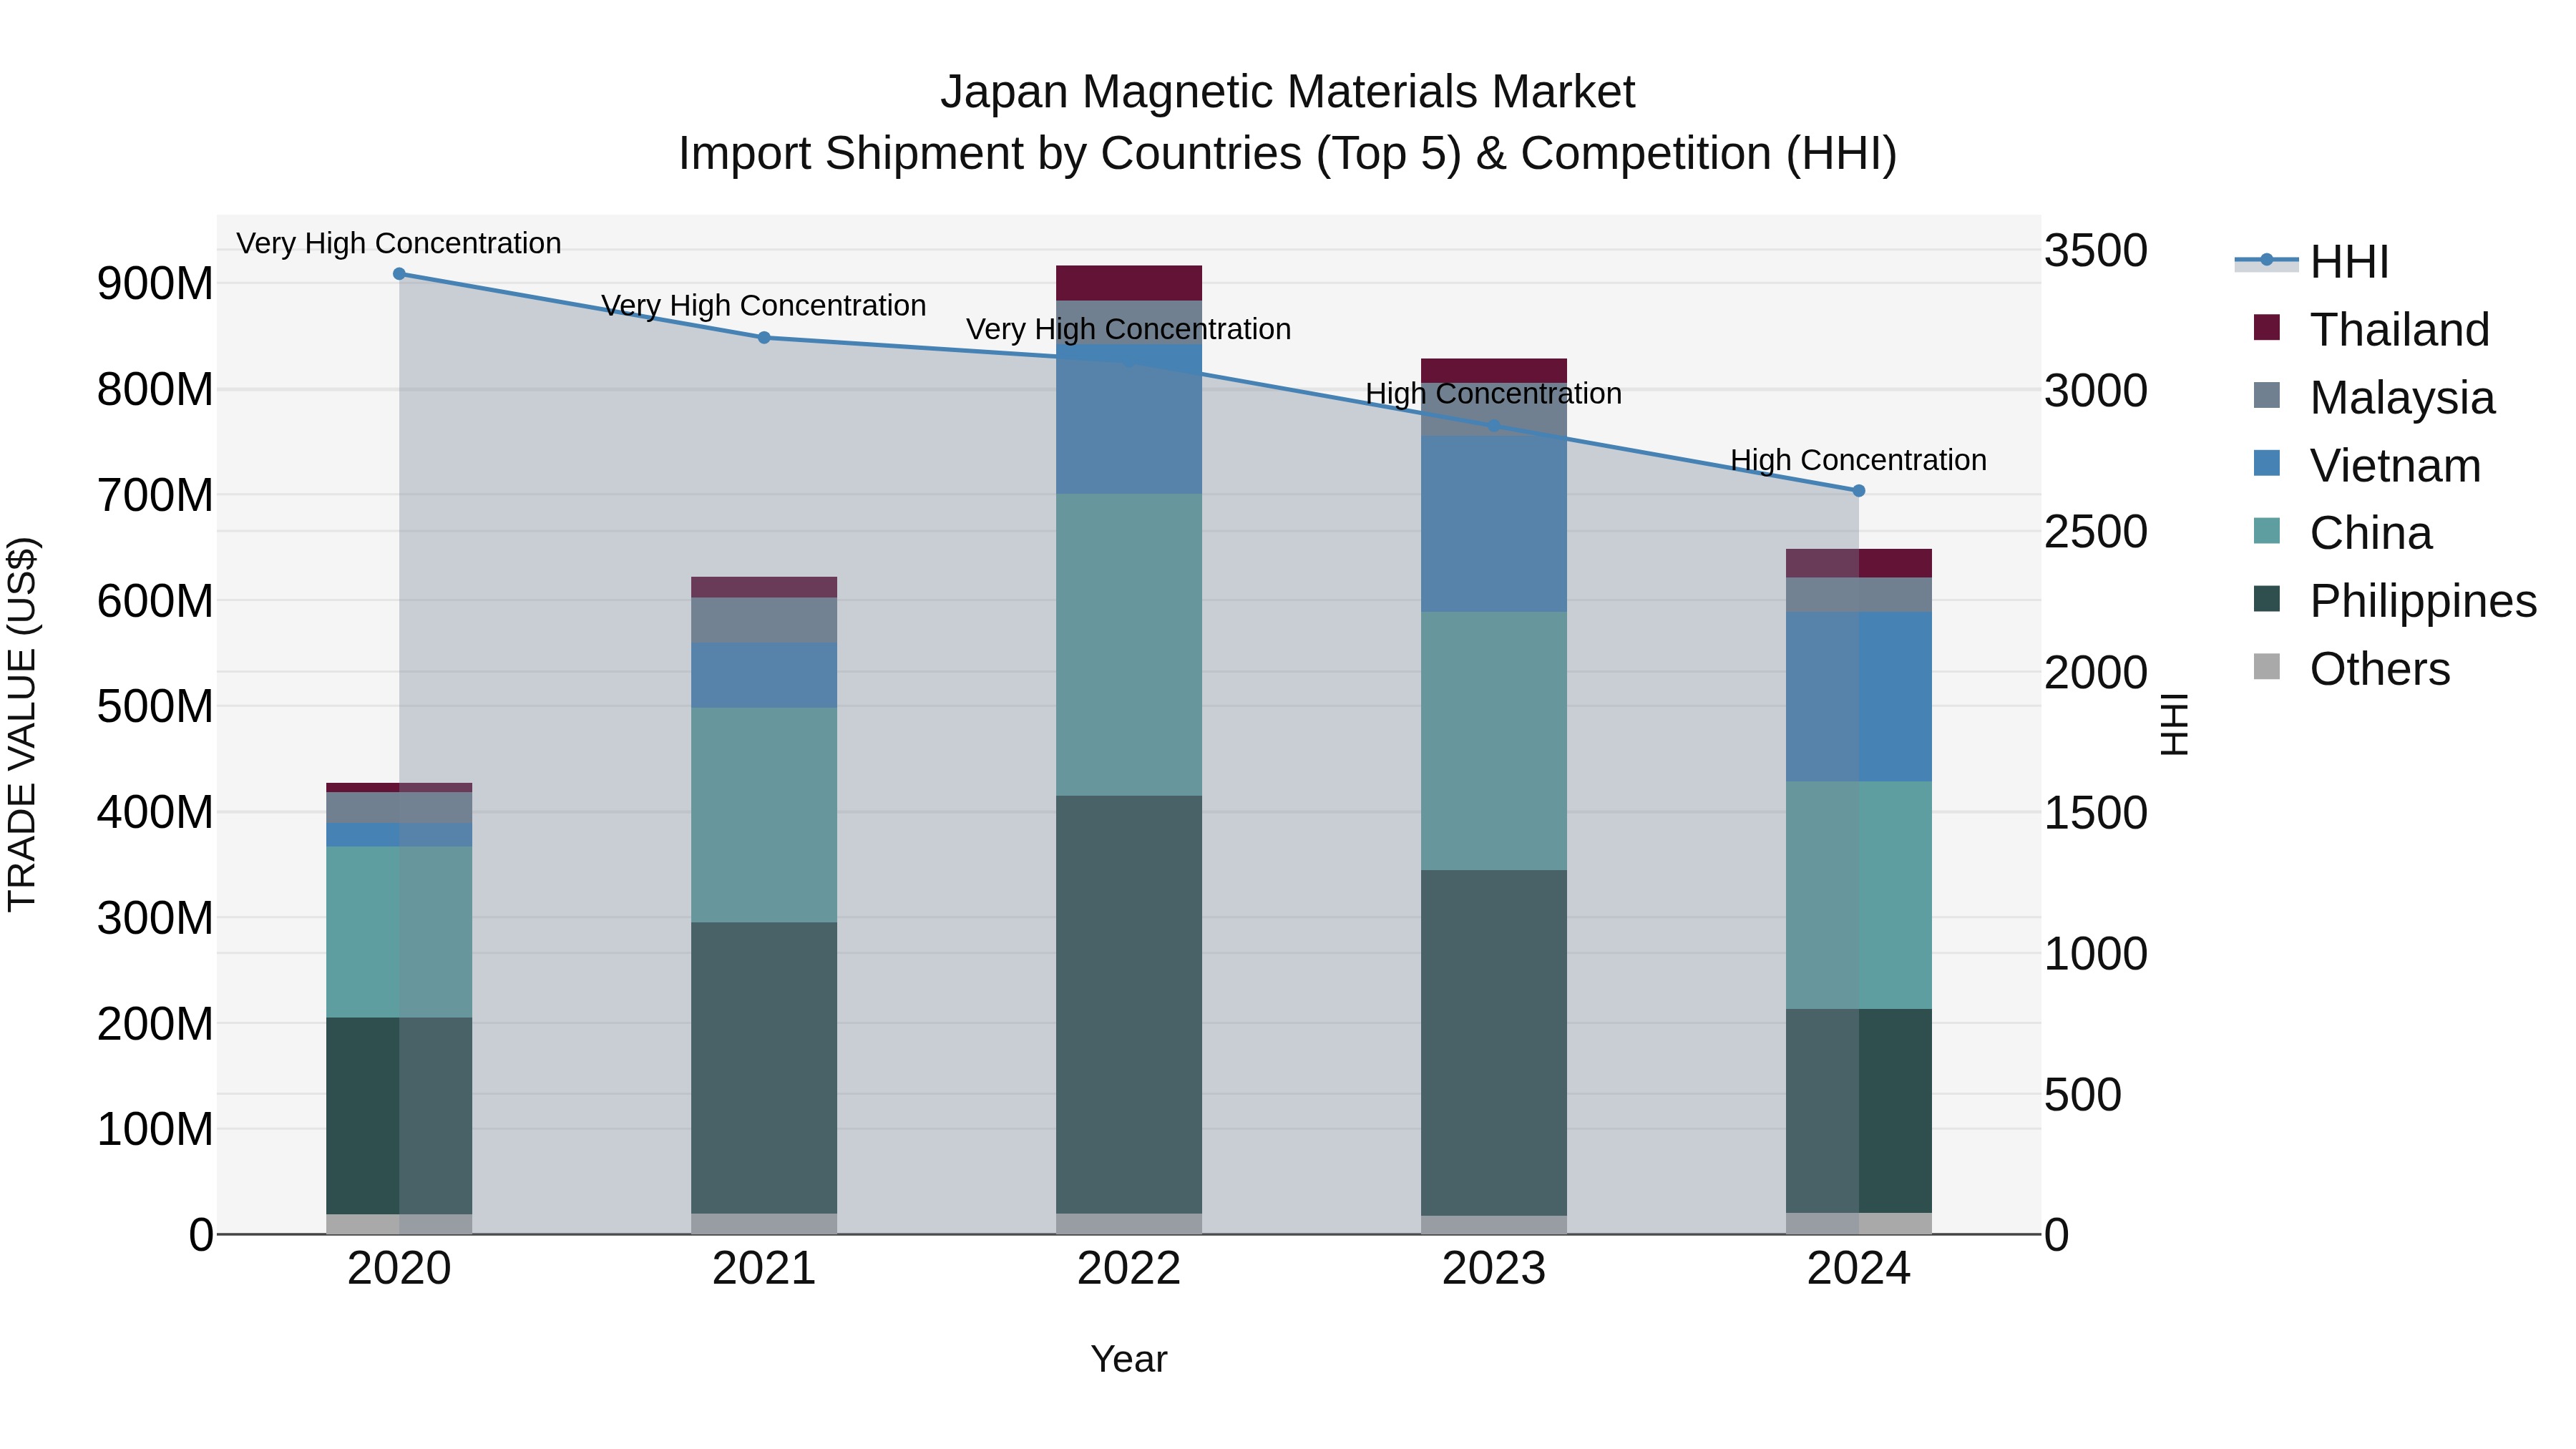
Japan Magnetic Materials Market Import Shipment by Countries (Top 5) & Competition (HHI)
In 2024, Japan continued to see a significant influx of magnetic materials imports, with key suppliers being China, Philippines, Vietnam, Malaysia, and Thailand. Despite a slight decline in growth rate from 2023 to 2024, the overall compound annual growth rate (CAGR) from 2020 to 2024 remained strong at 11.0%. The high Herfindahl-Hirschman Index (HHI) indicates a concentrated market, suggesting that these top exporting countries hold significant influence over Japan's magnetic materials import landscape. This data underscores the importance of monitoring market dynamics and competition within the magnetic materials industry for stakeholders in Japan.
japan magnetic materials market Synopsis
The Japan magnetic materials market is expected to grow at a CAGR of 6.1% from 2020 to 2026. This growth can be attributed to the increasing demand for electric vehicles, renewable energy storage solutions, and other electronic applications such as medical devices, consumer electronics, etc., which are driving the need for advanced materials like magnets in their manufacturing processes. Additionally, increased government support towards the development of advanced material industries like rare-earth magnets will further fuel market growth in this period. Major players operating in this space include TDK Corporation (Japan), Hitachi Metals Ltd (Japan), Shin-Etsu Chemical Co., Ltd (Japan) and Sumitomo Special Metals Co., Ltd (Japan).
Key Highlights of the Report:
- Japan Magnetic Materials Market Outlook
- Market Size of Japan Magnetic Materials Market, 2019
- Forecast of Japan Magnetic Materials Market, 2026
- Historical Data and Forecast of Japan Magnetic Materials Revenues & Volume for the Period 2016 - 2026
- Japan Magnetic Materials Market Trend Evolution
- Japan Magnetic Materials Market Drivers and Challenges
- Japan Magnetic Materials Price Trends
- Japan Magnetic Materials Porter's Five Forces
- Japan Magnetic Materials Industry Life Cycle
- Historical Data and Forecast of Japan Magnetic Materials Market Revenues & Volume By Product Types for the Period 2016 - 2026
- Historical Data and Forecast of Japan Magnetic Materials Market Revenues & Volume By Semi-hard Magnet for the Period 2016 - 2026
- Historical Data and Forecast of Japan Magnetic Materials Market Revenues & Volume By Soft Magnet for the Period 2016 - 2026
- Historical Data and Forecast of Japan Magnetic Materials Market Revenues & Volume By Hard Magnet for the Period 2016 - 2026
- Historical Data and Forecast of Japan Magnetic Materials Market Revenues & Volume By Applications for the Period 2016 - 2026
- Historical Data and Forecast of Japan Magnetic Materials Market Revenues & Volume By Automotive for the Period 2016 - 2026
- Historical Data and Forecast of Japan Magnetic Materials Market Revenues & Volume By Electronics for the Period 2016 - 2026
- Historical Data and Forecast of Japan Magnetic Materials Market Revenues & Volume By Industrial for the Period 2016 - 2026
- Historical Data and Forecast of Japan Magnetic Materials Market Revenues & Volume By Power Generation for the Period 2016 - 2026
- Historical Data and Forecast of Japan Magnetic Materials Market Revenues & Volume By Others for the Period 2016 - 2026
- Japan Magnetic Materials Import Export Trade Statistics
- Market Opportunity Assessment By Product Types
- Market Opportunity Assessment By Applications
- Japan Magnetic Materials Top Companies Market Share
- Japan Magnetic Materials Competitive Benchmarking By Technical and Operational Parameters
- Japan Magnetic Materials Company Profiles
- Japan Magnetic Materials Key Strategic Recommendations
Frequently Asked Questions About the Market Study (FAQs):
6Wresearch actively monitors the Japan Magnetic Materials Market and publishes its comprehensive annual report, highlighting emerging trends, growth drivers, revenue analysis, and forecast outlook. Our insights help businesses to make data-backed strategic decisions with ongoing market dynamics. Our analysts track relevent industries related to the Japan Magnetic Materials Market, allowing our clients with actionable intelligence and reliable forecasts tailored to emerging regional needs.
Yes, we provide customisation as per your requirements. To learn more, feel free to contact us on sales@6wresearch.com
1 Executive Summary |
2 Introduction |
2.1 Key Highlights of the Report |
2.2 Report Description |
2.3 Market Scope & Segmentation |
2.4 Research Methodology |
2.5 Assumptions |
3 Japan Magnetic Materials Market Overview |
3.1 Japan Country Macro Economic Indicators |
3.2 Japan Magnetic Materials Market Revenues & Volume, 2019 & 2026F |
3.3 Japan Magnetic Materials Market - Industry Life Cycle |
3.4 Japan Magnetic Materials Market - Porter's Five Forces |
3.5 Japan Magnetic Materials Market Revenues & Volume Share, By Product Types, 2019 & 2026F |
3.6 Japan Magnetic Materials Market Revenues & Volume Share, By Applications, 2019 & 2026F |
4 Japan Magnetic Materials Market Dynamics |
4.1 Impact Analysis |
4.2 Market Drivers |
4.2.1 Increasing demand for consumer electronics and automotive applications that utilize magnetic materials. |
4.2.2 Growing focus on renewable energy sources such as wind turbines and electric vehicles, which require magnetic materials. |
4.2.3 Technological advancements leading to the development of high-performance magnetic materials. |
4.3 Market Restraints |
4.3.1 Fluctuating prices of raw materials used in the production of magnetic materials. |
4.3.2 Stringent regulations related to environmental concerns and disposal of magnetic materials waste. |
4.3.3 Intense competition from substitute materials or technologies in certain applications. |
5 Japan Magnetic Materials Market Trends |
6 Japan Magnetic Materials Market, By Types |
6.1 Japan Magnetic Materials Market, By Product Types |
6.1.1 Overview and Analysis |
6.1.2 Japan Magnetic Materials Market Revenues & Volume, By Product Types, 2016 - 2026F |
6.1.3 Japan Magnetic Materials Market Revenues & Volume, By Semi-hard Magnet, 2016 - 2026F |
6.1.4 Japan Magnetic Materials Market Revenues & Volume, By Soft Magnet, 2016 - 2026F |
6.1.5 Japan Magnetic Materials Market Revenues & Volume, By Hard Magnet, 2016 - 2026F |
6.2 Japan Magnetic Materials Market, By Applications |
6.2.1 Overview and Analysis |
6.2.2 Japan Magnetic Materials Market Revenues & Volume, By Automotive, 2016 - 2026F |
6.2.3 Japan Magnetic Materials Market Revenues & Volume, By Electronics, 2016 - 2026F |
6.2.4 Japan Magnetic Materials Market Revenues & Volume, By Industrial, 2016 - 2026F |
6.2.5 Japan Magnetic Materials Market Revenues & Volume, By Power Generation, 2016 - 2026F |
6.2.6 Japan Magnetic Materials Market Revenues & Volume, By Others, 2016 - 2026F |
7 Japan Magnetic Materials Market Import-Export Trade Statistics |
7.1 Japan Magnetic Materials Market Export to Major Countries |
7.2 Japan Magnetic Materials Market Imports from Major Countries |
8 Japan Magnetic Materials Market Key Performance Indicators |
8.1 Research and development investment in new magnetic materials technologies. |
8.2 Adoption rate of magnetic materials in emerging applications such as renewable energy and medical devices. |
8.3 Percentage of revenue generated from high-performance magnetic materials compared to traditional materials. |
8.4 Number of patents filed for innovative magnetic materials and manufacturing processes. |
8.5 Customer satisfaction and feedback on the performance and quality of magnetic materials. |
9 Japan Magnetic Materials Market - Opportunity Assessment |
9.1 Japan Magnetic Materials Market Opportunity Assessment, By Product Types, 2019 & 2026F |
9.2 Japan Magnetic Materials Market Opportunity Assessment, By Applications, 2019 & 2026F |
10 Japan Magnetic Materials Market - Competitive Landscape |
10.1 Japan Magnetic Materials Market Revenue Share, By Companies, 2019 |
10.2 Japan Magnetic Materials Market Competitive Benchmarking, By Operating and Technical Parameters |
11 Company Profiles |
12 Recommendations |
13 Disclaimer |
Global Go To Market Strategy - 2030
Export potential enables firms to identify high-growth global markets with greater confidence by combining advanced trade intelligence with a structured quantitative methodology. The framework analyzes emerging demand trends and country-level import patterns while integrating macroeconomic and trade datasets such as GDP and population forecasts, bilateral import–export flows, tariff structures, elasticity differentials between developed and developing economies, geographic distance, and import demand projections. Using weighted trade values from 2020–2024 as the base period to project country-to-country export potential for 2030, these inputs are operationalized through calculated drivers such as gravity model parameters, tariff impact factors, and projected GDP per-capita growth. Through an analysis of hidden potentials, demand hotspots, and market conditions that are most favorable to success, this method enables firms to focus on target countries, maximize returns, and global expansion with data, backed by accuracy.
By factoring in the projected importer demand gap that is currently unmet and could be potential opportunity, it identifies the potential for the Exporter (Country) among 190 countries, against the general trade analysis, which identifies the biggest importer or exporter.
To discover high-growth global markets and optimize your business strategy:
Click Here
Pricing
- Single User License$ 1,995
- Department License$ 2,400
- Site License$ 3,120
- Global License$ 3,795

Leadership Perspectives from Industry Events
Search
Thought Leadership and Analyst Meet


Our Clients
6WResearch In News
- India Export Attractiveness Tracker 2026
- India Air Conditioner Market Set for Strong Rebound in 2026 After Weather-Led Correction and GST-Driven Recovery: 6Wresearch
- ADAS in India: How Automatic Emergency Braking, Blind Spot Detection & Driver Monitoring are Transforming Road Safety
- Doha a strategic location for EV manufacturing hub: IPA Qatar
- Demand for luxury TVs surging in the GCC, says Samsung
- Empowering Growth: The Thriving Journey of Bangladesh’s Cable Industry
Latest Reports
- Qatar Access and Home Network Market (2026-2032)
- Nicaragua RPG Gaming Market (2026-2032)
- New Zealand RPG Gaming Market (2026-2032)
- Netherlands RPG Gaming Market (2026-2032)
- Nauru RPG Gaming Market (2026-2032)
- Namibia RPG Gaming Market (2026-2032)
- Mozambique RPG Gaming Market (2026-2032)
- Montenegro RPG Gaming Market (2026-2032)
- Mongolia RPG Gaming Market (2026-2032)
- Monaco RPG Gaming Market (2026-2032)
Industry Events and Analyst Meet

EV India Expo 2026

HIMTEX 2026

India Refining Summit 2026

India EV Show 2026

EV tech India Expo 2026
Whitepaper
- Middle East & Africa Commercial Security Market Click here to view more.
- Middle East & Africa Fire Safety Systems & Equipment Market Click here to view more.
- GCC Drone Market Click here to view more.
- Middle East Lighting Fixture Market Click here to view more.
- GCC Physical & Perimeter Security Market Click here to view more.