Poland Phenolic Resins Market Outlook | Trends, Value, Revenue, Companies, Growth, Industry, Size, Share, Analysis, Forecast & COVID-19 IMPACT
Market Forecast By Product (Novolac, Resol, Others), By Application (Wood Adhesives, Molding, Insulation, Laminates, Paper Impregnation, Coatings, Others) And Competitive Landscape
| Product Code: ETC081814 | Publication Date: Jun 2021 | Updated Date: Feb 2026 | Product Type: Report | |
| Publisher: 6Wresearch | Author: Ravi Bhandari | No. of Pages: 70 | No. of Figures: 35 | No. of Tables: 5 |
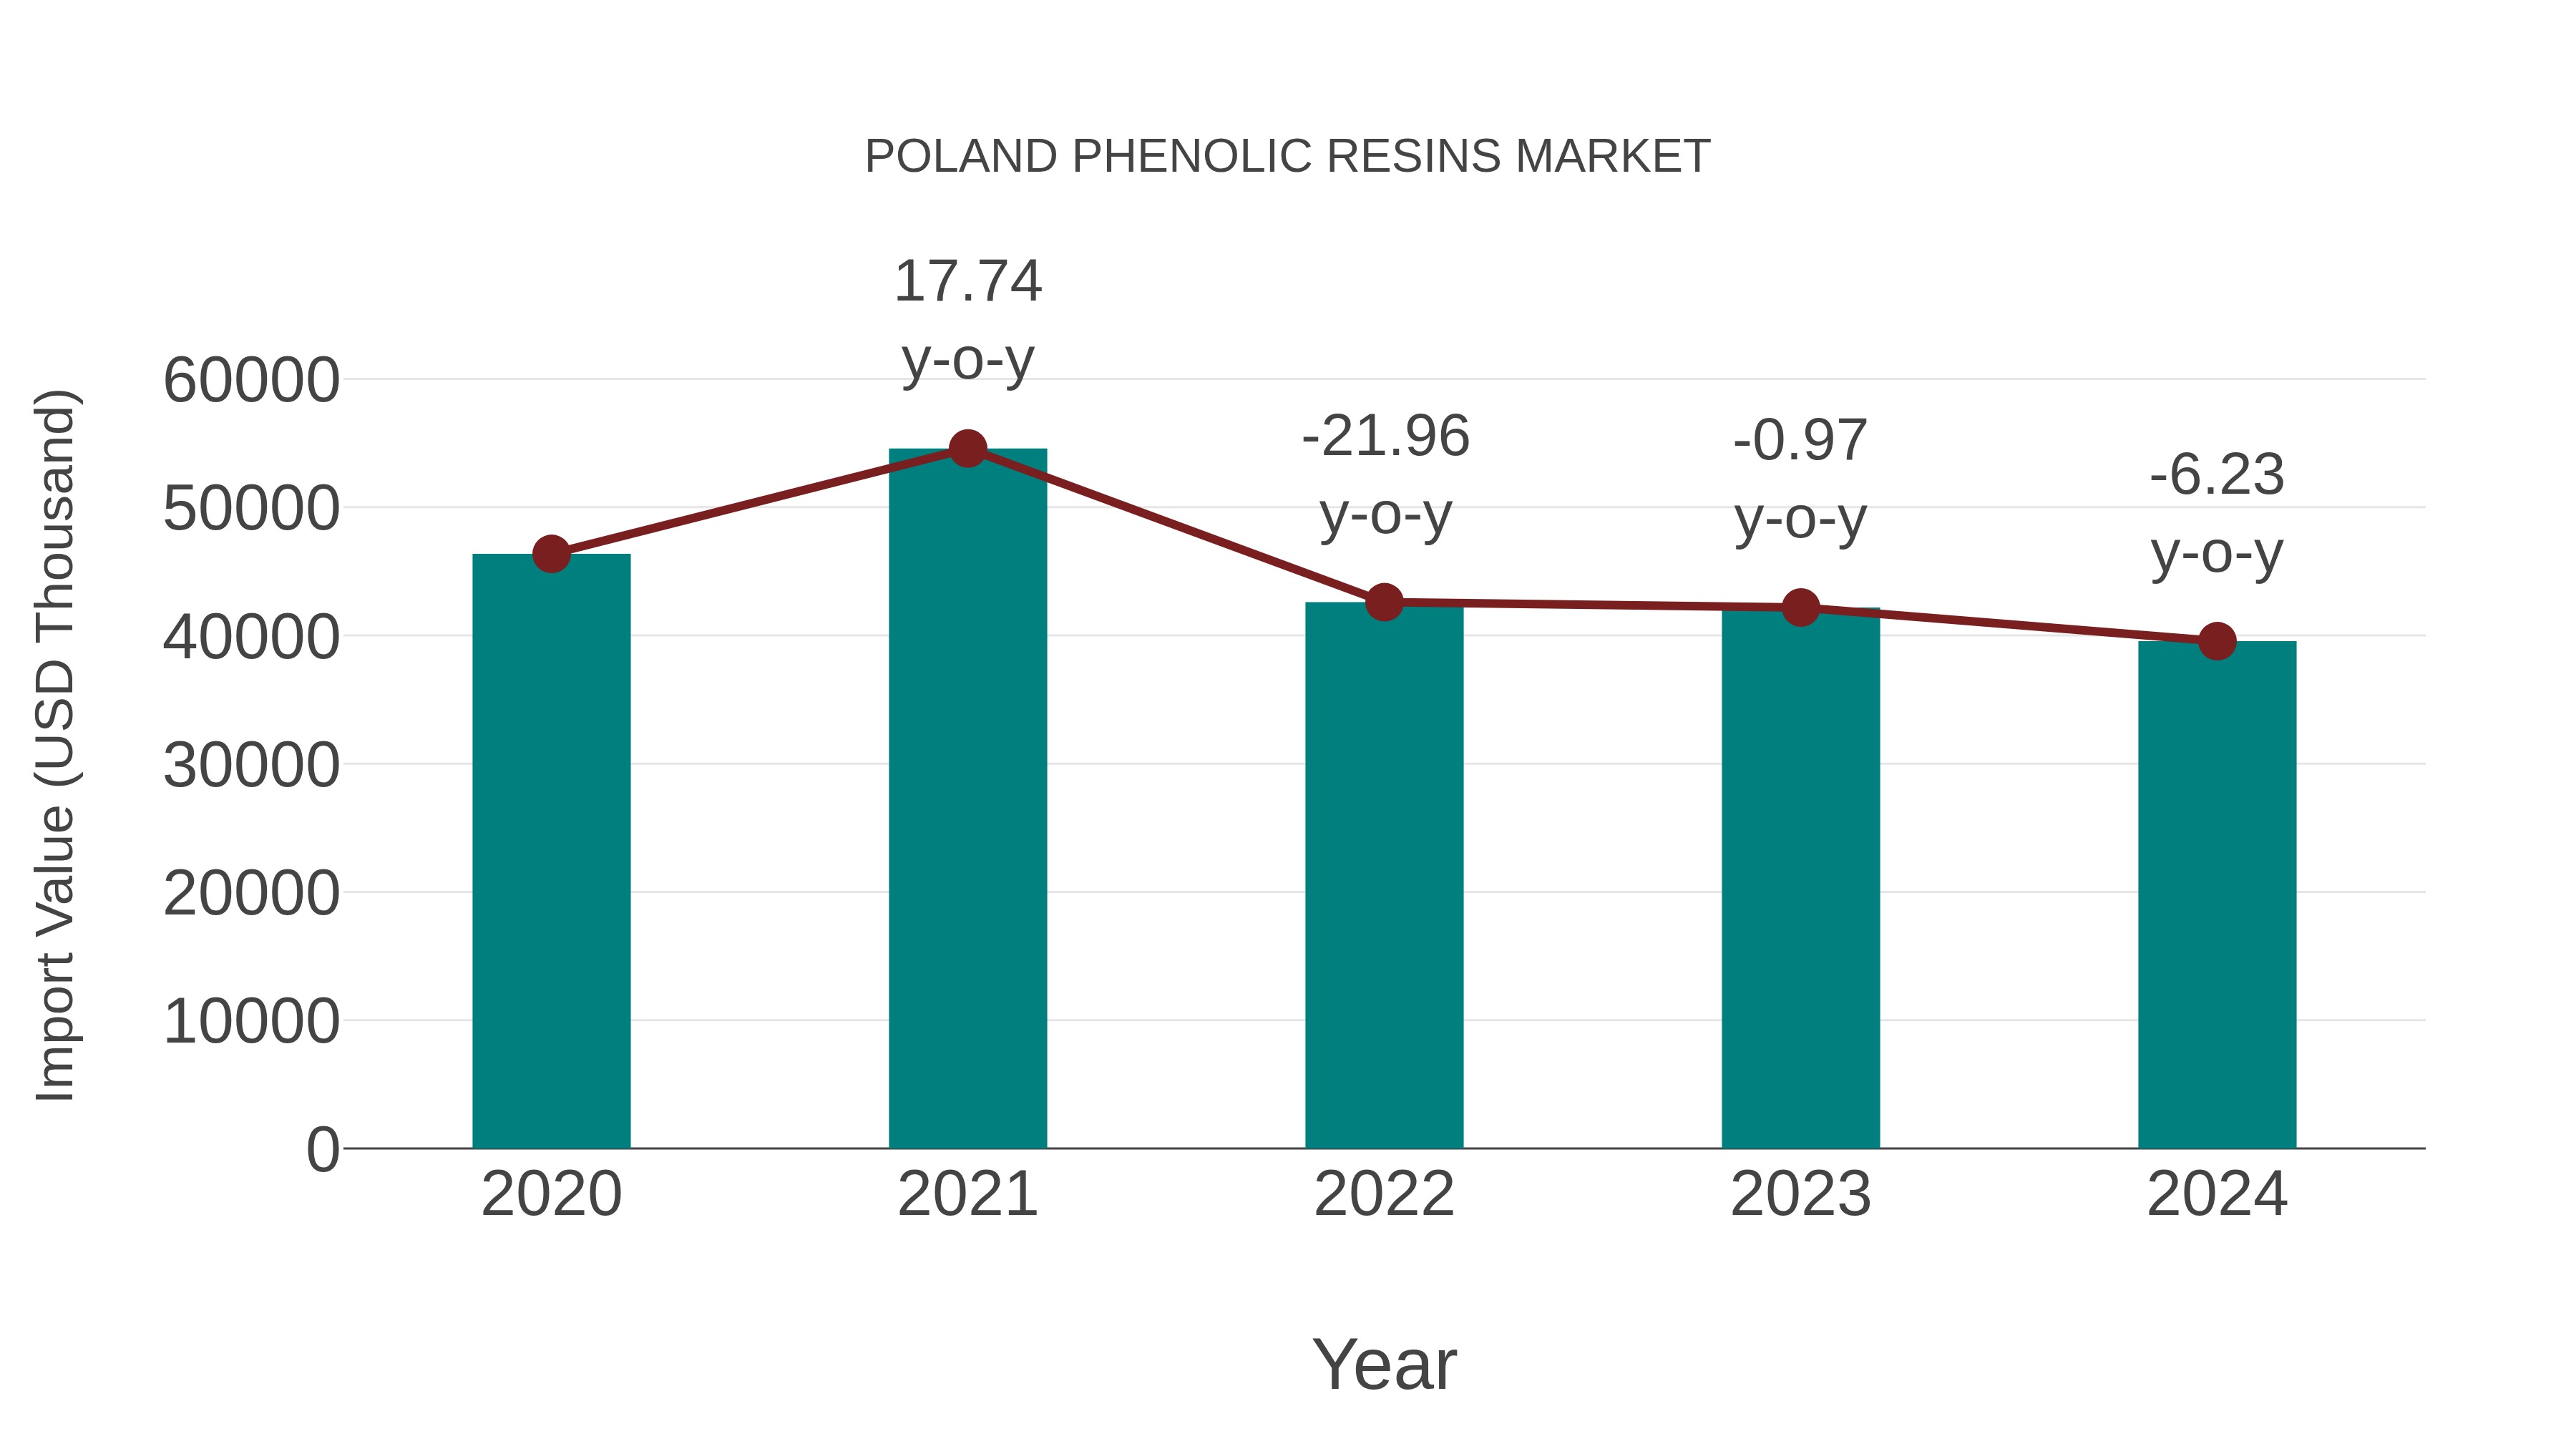
Poland Phenolic Resins Market: Import Trend Analysis
In 2024, Poland import trend for phenolic resins experienced a decline, with a growth rate of -6.23% compared to the previous year. The compound annual growth rate (CAGR) for the period 2020-2024 stood at -3.89%. This negative momentum in imports could be attributed to shifting market demands or evolving trade policies impacting the market stability.
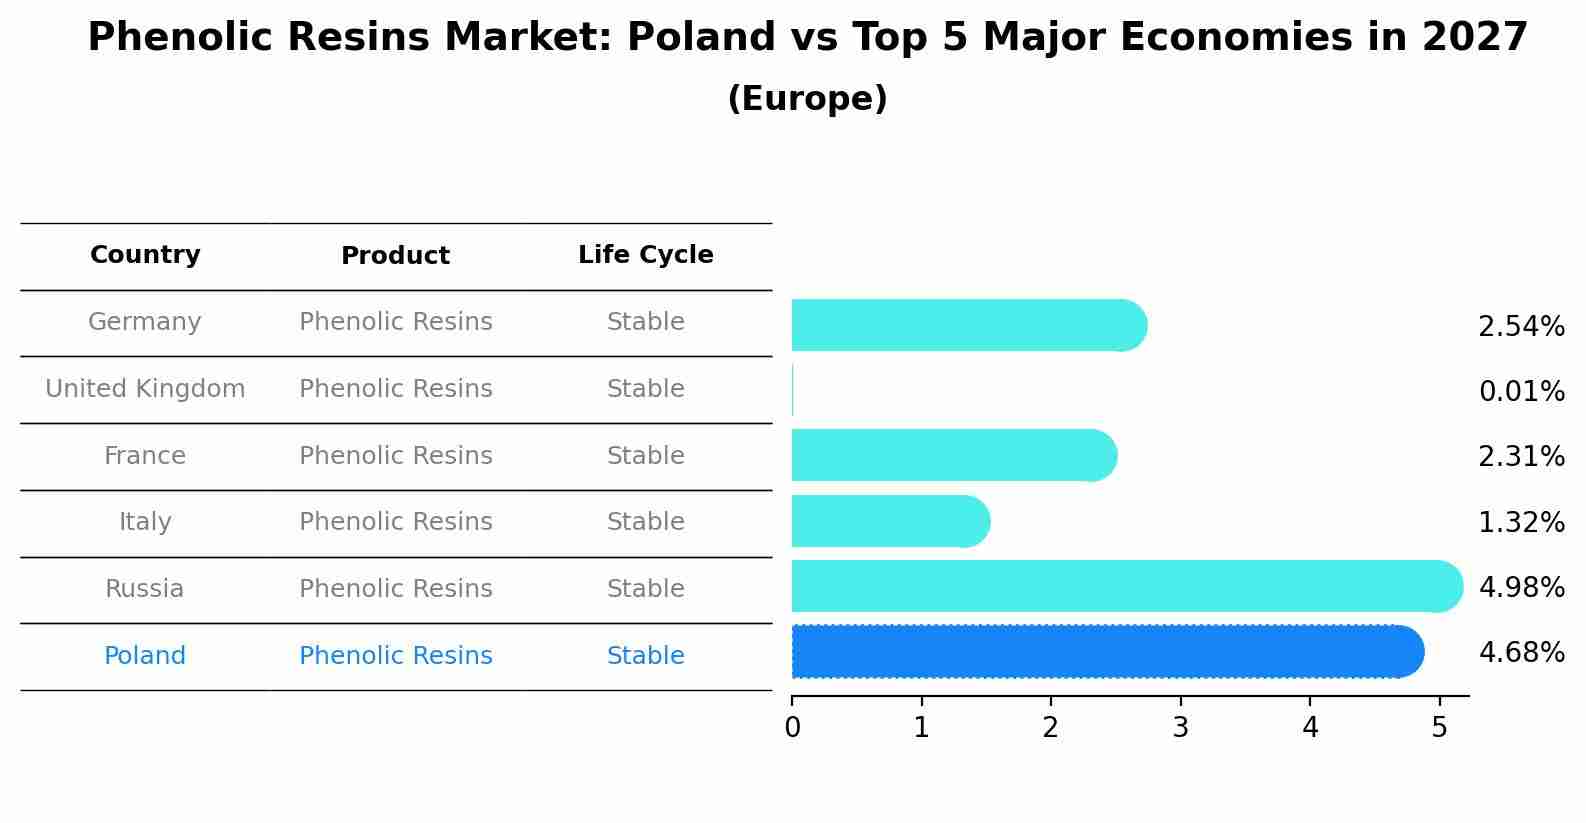
Phenolic Resins Market: Poland vs Top 5 Major Economies in 2027 (Europe)
By 2027, Poland's Phenolic Resins market is forecasted to achieve a stable growth rate of 4.68%, with Germany leading the Europe region, followed by United Kingdom, France, Italy and Russia.
Poland Phenolic Resins Market Overview
Polands phenolic resins market is growing due to their use in various applications, including adhesives, coatings, and composites. Phenolic resins are valued for their durability, heat resistance, and strong bonding properties, contributing to their demand in industrial and consumer products.
Drivers of the market
The phenolic resins market in Poland is growing as these resins are widely used in various industrial applications, including automotive, construction, and electronics. Phenolic resins are valued for their excellent heat resistance, chemical resistance, and mechanical strength. The market expansion is supported by advancements in resin formulations, increasing demand for durable materials, and the need for high-performance resins in diverse manufacturing processes.
Challenges of the market
The phenolic resins market in Poland faces difficulties due to the environmental concerns surrounding the formaldehyde used in their production. The rise of stricter environmental regulations, particularly concerning emissions and waste management, requires companies to invest in cleaner technologies, raising operational costs. Moreover, phenolic resins face competition from newer, more sustainable resin technologies, which are increasingly preferred by industries focused on reducing their environmental impact.
Government Policy of the market
The phenolic resins market in Poland is influenced by government manufacturing standards and environmental compliance regulations. National policies promoting the use of high-performance materials in construction and automotive applications drive demand for phenolic resins, ensuring adherence to safety and environmental guidelines.
Key Highlights of the Report:
- Poland Phenolic Resins Market Outlook
- Market Size of Poland Phenolic Resins Market, 2024
- Forecast of Poland Phenolic Resins Market, 2031
- Historical Data and Forecast of Poland Phenolic Resins Revenues & Volume for the Period 2018 - 2031
- Poland Phenolic Resins Market Trend Evolution
- Poland Phenolic Resins Market Drivers and Challenges
- Poland Phenolic Resins Price Trends
- Poland Phenolic Resins Porter's Five Forces
- Poland Phenolic Resins Industry Life Cycle
- Historical Data and Forecast of Poland Phenolic Resins Market Revenues & Volume By Product for the Period 2018 - 2031
- Historical Data and Forecast of Poland Phenolic Resins Market Revenues & Volume By Novolac for the Period 2018 - 2031
- Historical Data and Forecast of Poland Phenolic Resins Market Revenues & Volume By Resol for the Period 2018 - 2031
- Historical Data and Forecast of Poland Phenolic Resins Market Revenues & Volume By Others for the Period 2018 - 2031
- Historical Data and Forecast of Poland Phenolic Resins Market Revenues & Volume By Application for the Period 2018 - 2031
- Historical Data and Forecast of Poland Phenolic Resins Market Revenues & Volume By Wood Adhesives for the Period 2018 - 2031
- Historical Data and Forecast of Poland Phenolic Resins Market Revenues & Volume By Molding for the Period 2018 - 2031
- Historical Data and Forecast of Poland Phenolic Resins Market Revenues & Volume By Insulation for the Period 2018 - 2031
- Historical Data and Forecast of Poland Phenolic Resins Market Revenues & Volume By Laminates for the Period 2018 - 2031
- Historical Data and Forecast of Poland Phenolic Resins Market Revenues & Volume By Paper Impregnation for the Period 2018 - 2031
- Historical Data and Forecast of Poland Phenolic Resins Market Revenues & Volume By Coatings for the Period 2018 - 2031
- Historical Data and Forecast of Poland Phenolic Resins Market Revenues & Volume By Others for the Period 2018 - 2031
- Poland Phenolic Resins Import Export Trade Statistics
- Market Opportunity Assessment By Product
- Market Opportunity Assessment By Application
- Poland Phenolic Resins Top Companies Market Share
- Poland Phenolic Resins Competitive Benchmarking By Technical and Operational Parameters
- Poland Phenolic Resins Company Profiles
- Poland Phenolic Resins Key Strategic Recommendations
Frequently Asked Questions About the Market Study (FAQs):
6Wresearch actively monitors the Poland Phenolic Resins Market and publishes its comprehensive annual report, highlighting emerging trends, growth drivers, revenue analysis, and forecast outlook. Our insights help businesses to make data-backed strategic decisions with ongoing market dynamics. Our analysts track relevent industries related to the Poland Phenolic Resins Market, allowing our clients with actionable intelligence and reliable forecasts tailored to emerging regional needs.
Yes, we provide customisation as per your requirements. To learn more, feel free to contact us on sales@6wresearch.com
1 Executive Summary |
2 Introduction |
2.1 Key Highlights of the Report |
2.2 Report Description |
2.3 Market Scope & Segmentation |
2.4 Research Methodology |
2.5 Assumptions |
3 Poland Phenolic Resins Market Overview |
3.1 Poland Country Macro Economic Indicators |
3.2 Poland Phenolic Resins Market Revenues & Volume, 2021 & 2031F |
3.3 Poland Phenolic Resins Market - Industry Life Cycle |
3.4 Poland Phenolic Resins Market - Porter's Five Forces |
3.5 Poland Phenolic Resins Market Revenues & Volume Share, By Product, 2021 & 2031F |
3.6 Poland Phenolic Resins Market Revenues & Volume Share, By Application, 2021 & 2031F |
4 Poland Phenolic Resins Market Dynamics |
4.1 Impact Analysis |
4.2 Market Drivers |
4.3 Market Restraints |
5 Poland Phenolic Resins Market Trends |
6 Poland Phenolic Resins Market, By Types |
6.1 Poland Phenolic Resins Market, By Product |
6.1.1 Overview and Analysis |
6.1.2 Poland Phenolic Resins Market Revenues & Volume, By Product, 2021-2031F |
6.1.3 Poland Phenolic Resins Market Revenues & Volume, By Novolac, 2021-2031F |
6.1.4 Poland Phenolic Resins Market Revenues & Volume, By Resol, 2021-2031F |
6.1.5 Poland Phenolic Resins Market Revenues & Volume, By Others, 2021-2031F |
6.2 Poland Phenolic Resins Market, By Application |
6.2.1 Overview and Analysis |
6.2.2 Poland Phenolic Resins Market Revenues & Volume, By Wood Adhesives, 2021-2031F |
6.2.3 Poland Phenolic Resins Market Revenues & Volume, By Molding, 2021-2031F |
6.2.4 Poland Phenolic Resins Market Revenues & Volume, By Insulation, 2021-2031F |
6.2.5 Poland Phenolic Resins Market Revenues & Volume, By Laminates, 2021-2031F |
6.2.6 Poland Phenolic Resins Market Revenues & Volume, By Paper Impregnation, 2021-2031F |
6.2.7 Poland Phenolic Resins Market Revenues & Volume, By Coatings, 2021-2031F |
7 Poland Phenolic Resins Market Import-Export Trade Statistics |
7.1 Poland Phenolic Resins Market Export to Major Countries |
7.2 Poland Phenolic Resins Market Imports from Major Countries |
8 Poland Phenolic Resins Market Key Performance Indicators |
9 Poland Phenolic Resins Market - Opportunity Assessment |
9.1 Poland Phenolic Resins Market Opportunity Assessment, By Product, 2021 & 2031F |
9.2 Poland Phenolic Resins Market Opportunity Assessment, By Application, 2021 & 2031F |
10 Poland Phenolic Resins Market - Competitive Landscape |
10.1 Poland Phenolic Resins Market Revenue Share, By Companies, 2024 |
10.2 Poland Phenolic Resins Market Competitive Benchmarking, By Operating and Technical Parameters |
11 Company Profiles |
12 Recommendations |
13 Disclaimer |
Global Go To Market Strategy - 2030
Export potential enables firms to identify high-growth global markets with greater confidence by combining advanced trade intelligence with a structured quantitative methodology. The framework analyzes emerging demand trends and country-level import patterns while integrating macroeconomic and trade datasets such as GDP and population forecasts, bilateral import–export flows, tariff structures, elasticity differentials between developed and developing economies, geographic distance, and import demand projections. Using weighted trade values from 2020–2024 as the base period to project country-to-country export potential for 2030, these inputs are operationalized through calculated drivers such as gravity model parameters, tariff impact factors, and projected GDP per-capita growth. Through an analysis of hidden potentials, demand hotspots, and market conditions that are most favorable to success, this method enables firms to focus on target countries, maximize returns, and global expansion with data, backed by accuracy.
By factoring in the projected importer demand gap that is currently unmet and could be potential opportunity, it identifies the potential for the Exporter (Country) among 190 countries, against the general trade analysis, which identifies the biggest importer or exporter.
To discover high-growth global markets and optimize your business strategy:
Click Here
Pricing
- Single User License$ 1,995
- Department License$ 2,400
- Site License$ 3,120
- Global License$ 3,795

Leadership Perspectives from Industry Events
Search
Thought Leadership and Analyst Meet


Our Clients
6WResearch In News
- India Export Attractiveness Tracker 2026
- India Air Conditioner Market Set for Strong Rebound in 2026 After Weather-Led Correction and GST-Driven Recovery: 6Wresearch
- ADAS in India: How Automatic Emergency Braking, Blind Spot Detection & Driver Monitoring are Transforming Road Safety
- Doha a strategic location for EV manufacturing hub: IPA Qatar
- Demand for luxury TVs surging in the GCC, says Samsung
- Empowering Growth: The Thriving Journey of Bangladesh’s Cable Industry
Latest Reports
- Greece Insulated Sandwich Panels Market (2026-2032)
- Qatar Access and Home Network Market (2026-2032)
- Nicaragua RPG Gaming Market (2026-2032)
- New Zealand RPG Gaming Market (2026-2032)
- Netherlands RPG Gaming Market (2026-2032)
- Nauru RPG Gaming Market (2026-2032)
- Namibia RPG Gaming Market (2026-2032)
- Mozambique RPG Gaming Market (2026-2032)
- Montenegro RPG Gaming Market (2026-2032)
- Mongolia RPG Gaming Market (2026-2032)
Industry Events and Analyst Meet

EV India Expo 2026

HIMTEX 2026

India Refining Summit 2026

India EV Show 2026

EV tech India Expo 2026
Whitepaper
- Middle East & Africa Commercial Security Market Click here to view more.
- Middle East & Africa Fire Safety Systems & Equipment Market Click here to view more.
- GCC Drone Market Click here to view more.
- Middle East Lighting Fixture Market Click here to view more.
- GCC Physical & Perimeter Security Market Click here to view more.