United States (US) Gambling Market (2026-2032) | Growth, Companies, Outlook, Value, Forecast, Trends, Analysis, Size, Industry, Share & Revenue
Market Forecast By Product Type (Betting, Casino, Lottery, Others), By Channel Type (Offline, Online, Virtual Reality VR), By Platform (Land-Based, Online) And Competitive Landscape
| Product Code: ETC014661 | Publication Date: Oct 2020 | Updated Date: Jun 2026 | Product Type: Report | |
| Publisher: 6Wresearch | Author: Summon Dutta | No. of Pages: 70 | No. of Figures: 35 | No. of Tables: 5 |
United States (US) Gambling Market Summary
The united states (us) gambling market was estimated at USD 143 Million in 2025 and is projected to reach USD 168 Million by 2032, growing at a CAGR of 3.1% from 2026 to 2032.
United States (US) Gambling Market Growth Rate Analysis (2021-2032)
The US gambling market has seen a notable resurgence following a challenging period in 2021, where it faced a slight decline of -0.9%. However, the sector rebounded impressively with a growth of 6.0% in 2022, driven by increased consumer demand and the expansion of online gaming platforms. This upward trend continues, with expected growth rates of 2.9% in 2023 and stabilizing at around 3.3% through 2025. Factors such as technological advancements in mobile gaming, favorable regulatory changes, and enhanced infrastructure are fueling this growth. While demand remains strong, slight fluctuations are anticipated, with the market expected to evolve towards a more mature phase, reflecting shifts in consumer preferences and digitalization.
United States (US) Gambling Market Year-wise Growth Rate and Key Drivers
This graph highlights how the United States (US) Gambling Market has steadily grown over the past five years, supported by major growth factors.
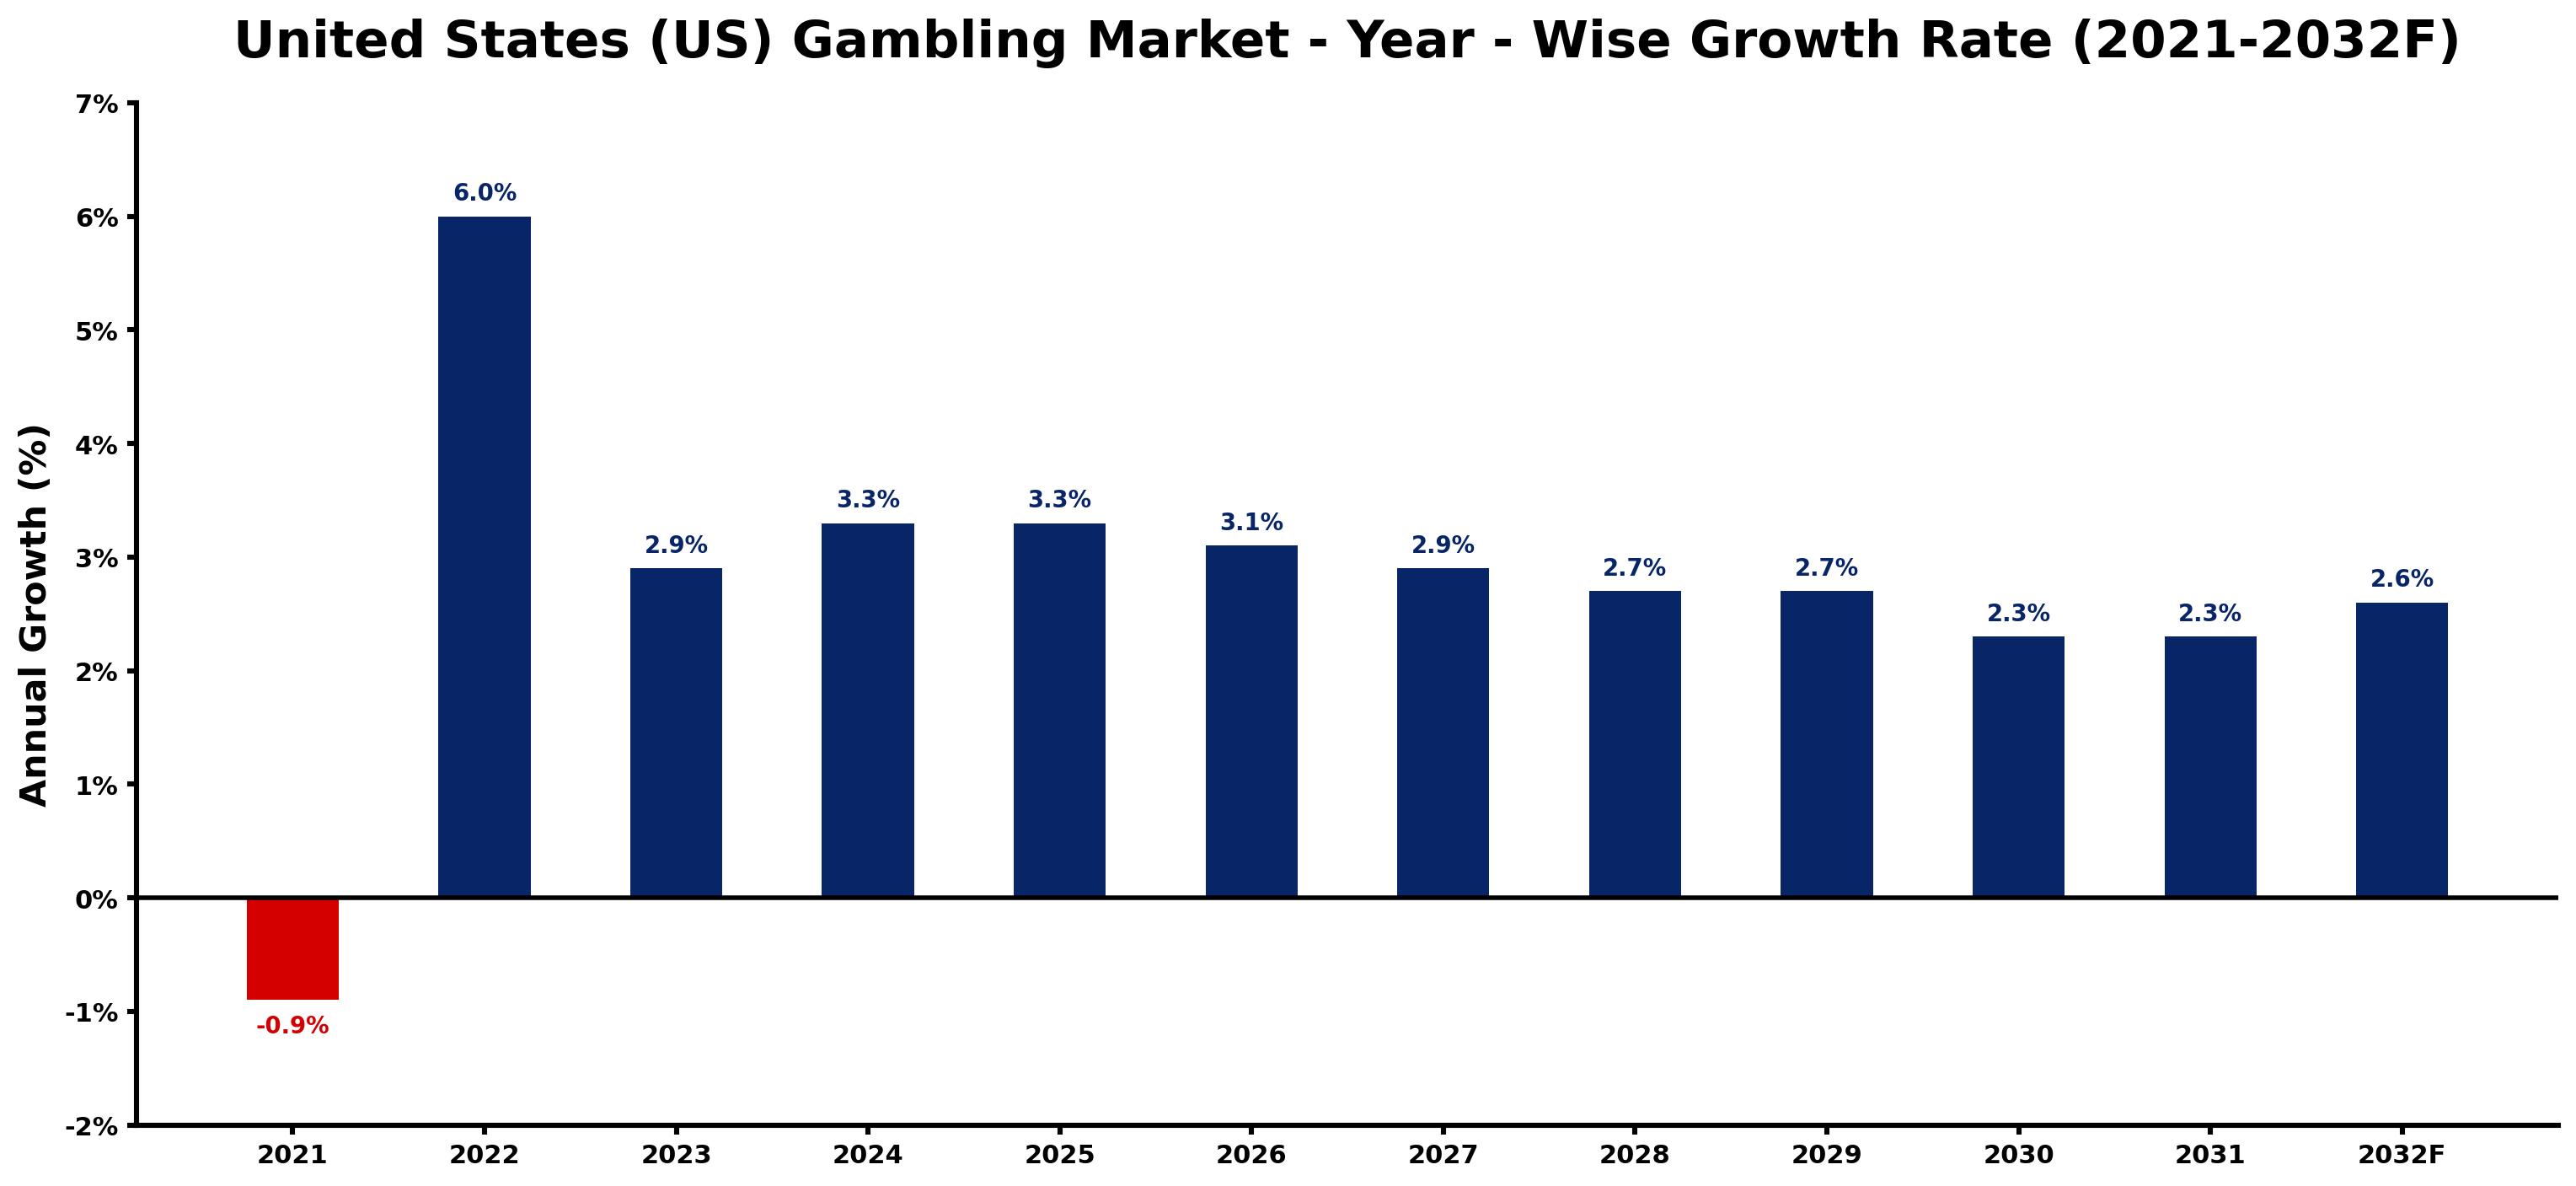
The table below presents the year wise growth rates along with the key drivers influencing the market
| Year | Growth Rate | Major Drivers |
| 2021 | -0.9% | Increased competition from online gaming alternatives diminished traditional casino attendance and revenue streams. |
| 2022 | 6.0% | Legalization efforts in various states expanded access to sports betting nationwide. |
| 2023 | 2.9% | Innovation in technology allowed for immersive gambling experiences through virtual reality. |
| 2024 | 3.3% | Mobile app enhancements improved user engagement, increasing overall participation rates. |
| 2025 | 3.3% | Collaborations between casinos and tech firms introduced advanced data analytics strategies. |
| 2026 | 3.1% | Demographic shifts revealed younger audiences showing a preference for online gaming. |
| 2027 | 2.9% | Investment in cybersecurity solutions became essential to protect user data and trust. |
| 2028 | 2.7% | Social gaming features integrated into platforms attracted non-traditional gambling participants. |
| 2029 | 2.7% | Emerging markets within iGaming offered lucrative opportunities for established players. |
| 2030 | 2.3% | Personalized marketing strategies enhanced customer retention and loyalty across platforms. |
| 2031 | 2.3% | Global competition encouraged US brands to innovate and diversify their offerings. |
| 2032 | 2.6% | Sustainability practices in operations attracted socially conscious consumers toward brands. |
Note - Market size estimations and growth projections presented in this report are based on 6Wresearch's advanced forecasting approach, validated with industry datasets as of June 2026.
United States (US) Gambling Market Synopsis
The United States (US) Gambling Market is projected to reach 3.1% and witness significant growth during the forecast period (2026-2032). The landscape of this market is markedly influenced by evolving regulations, technological advancements, and shifting consumer preferences. With brick-and-mortar establishments coexisting alongside a burgeoning online gambling sector, the market has adapted dynamically to changing circumstances, thereby ensuring its robust expansion.
United States (US) Gambling Market Growth Drivers
Several factors are propelling the growth of the United States (US) Gambling Market. Firstly, the legalization of sports betting across numerous states has unlocked substantial revenue potential, enabling operators to cater to a larger audience. Additionally, the rise of online gambling options has attracted a younger demographic, further expanding the market's reach.
- The favorable regulatory environment following the Supreme Court's decision in 2018 has encouraged more states to legalize sports betting, contributing to market growth.
- Technological advancements have led to the creation of innovative online platforms, improving user experience and engagement in the gambling process.
- Mobile betting has grown in popularity, allowing consumers to gamble conveniently from anywhere, thus enlarging the customer base.
- Increased investment in marketing and promotions has bolstered the visibility of legal gambling options, attracting more participants to the market.
- The incorporation of responsible gambling initiatives is fostering a sustainable market environment, ensuring long-term growth while prioritizing consumer protection.
United States (US) Gambling Market Trends and Opportunities
In the evolving landscape of the United States (US) Gambling Market, several trends and opportunities are emerging. The integration of advanced technologies such as virtual reality and augmented reality in gaming experiences is revolutionizing how consumers engage with gambling platforms.
- Online gambling is increasingly being accepted as a legitimate form of entertainment, leading to a widespread shift in consumer attitudes towards gambling activities.
- The expansion of eSports betting is attracting younger gamblers, providing a new avenue for growth within the market.
- Collaboration between technology firms and gambling operators is fostering innovation, enhancing game offerings, and improving operational efficiencies.
- As states continue to explore new gambling avenues, opportunities in areas like mobile gaming and fantasy sports are anticipated to grow significantly.
- The rising emphasis on responsible gambling and mental health initiatives is promoting ethical practices, which can lead to enhanced public perception and trust in the industry.
United States (US) Gambling Market Challenges and Restraints
Despite its promising prospects, the United States (US) Gambling Market faces several challenges and constraints. The patchwork of regulations across different states complicates compliance and operational strategies for operators.
- The varying state laws regarding gambling create a regulatory landscape that can hinder companies' expansion efforts, requiring tailored approaches for each jurisdiction.
- Illegal gambling operations continue to present a formidable challenge, offering services that can undercut legal operators both in cost and accessibility.
- Shifting consumer preferences necessitate ongoing investments in technology and marketing, placing financial pressure on operators to continuously innovate and adapt.
- The potential for backlash against gambling activities remains, as some communities voice concerns over social impacts, leading to possible legislative pushback.
- Increased competition, both from established firms and new entrants, requires companies to differentiate their offerings to maintain market position.
United States (US) Gambling Market Government Investment and Initiatives
Government policies play a critical role in shaping the United States (US) Gambling Market. Gambling laws are predominantly regulated at the state level, with significant variation among states in terms of legalization and types of permissible activities.
- States that have legalized gambling often implement comprehensive frameworks to regulate casinos, sports betting, and online platforms, balancing economic benefits with social responsibilities.
- Public spending on regulatory agencies has increased, enabling more robust enforcement mechanisms to combat illegal gambling operations.
- Development plans for casino resorts and entertainment complexes are being promoted through government incentives, attracting private investment to enhance local economies.
- Collaboration with federal entities, particularly regarding tribal casinos, remains essential for ensuring compliance with overarching federal laws.
- Initiatives to promote responsible gambling are gaining traction, with government support for educational programs aimed at minimizing gambling addiction and promoting safer gambling environments.
United States (US) Gambling Market Latest Developments (May 2025 - June 2026)
The period from May 2025 to June 2026 has seen significant developments in the United States (US) Gambling Market. Numerous states have advanced legislation to expand gambling options, particularly in sports betting and online platforms.
- Several states have initiated pilot programs for online sports betting, focusing on trial runs to assess regulatory frameworks and consumer responses.
- The industry has witnessed a surge in partnerships between technology firms and gambling operators to enhance mobile gambling applications and improve user experiences.
- There has been a notable increase in the focus on responsible gambling measures, with multiple states launching campaigns aimed at promoting awareness and providing resources for problem gamblers.
- The introduction of new payment technologies, such as cryptocurrency options, has gained traction, offering consumers more flexible and secure payment methods.
- Regulatory bodies are actively engaging with stakeholders to adapt to the changing landscape, ensuring that laws reflect current consumer behavior and technology advancements.
United States (US) Gambling Market - Key Attractiveness of the Report
- 10 Years of Market Numbers
- Historical Data Starting from 2022 to 2025
- Base Year: 2025
- Forecast Data until 2032
- Key Performance Indicators Impacting the Market
- Major Upcoming Developments and Projects
Key Highlights of the Report:
- United States (US) Gambling Market Outlook
- Market Size of United States (US) Gambling Market, 2025
- Forecast of United States (US) Gambling Market, 2032F
- Historical Data and Forecast of United States (US) Gambling Revenues & Volume for the Period 2022-2032F
- United States (US) Gambling Market Trend Evolution
- United States (US) Gambling Market Drivers and Challenges
- United States (US) Gambling Price Trends
- United States (US) Gambling Porter's Five Forces
- United States (US) Gambling Industry Life Cycle
- Historical Data and Forecast of United States (US) Gambling Market Revenues & Volume By Product Type for the Period 2022-2032F
- Historical Data and Forecast of United States (US) Gambling Market Revenues & Volume By Betting for the Period 2022-2032F
- Historical Data and Forecast of United States (US) Gambling Market Revenues & Volume By Casino for the Period 2022-2032F
- Historical Data and Forecast of United States (US) Gambling Market Revenues & Volume By Lottery for the Period 2022-2032F
- Historical Data and Forecast of United States (US) Gambling Market Revenues & Volume By Others for the Period 2022-2032F
- Historical Data and Forecast of United States (US) Gambling Market Revenues & Volume By Channel Type for the Period 2022-2032F
- Historical Data and Forecast of United States (US) Gambling Market Revenues & Volume By Offline for the Period 2022-2032F
- Historical Data and Forecast of United States (US) Gambling Market Revenues & Volume By Online for the Period 2022-2032F
- Historical Data and Forecast of United States (US) Gambling Market Revenues & Volume By Virtual Reality VR for the Period 2022-2032F
- Historical Data and Forecast of United States (US) Gambling Market Revenues & Volume By Platform for the Period 2022-2032F
- Historical Data and Forecast of United States (US) Gambling Market Revenues & Volume By Land-Based for the Period 2022-2032F
- Historical Data and Forecast of United States (US) Gambling Market Revenues & Volume By Online for the Period 2022-2032F
- United States (US) Gambling Import Export Trade Statistics
- Market Opportunity Assessment By Product Type
- Market Opportunity Assessment By Channel Type
- Market Opportunity Assessment By Platform
- United States (US) Gambling Top Companies Market Share
- United States (US) Gambling Competitive Benchmarking By Technical and Operational Parameters
- United States (US) Gambling Company Profiles
- United States (US) Gambling Key Strategic Recommendations
Frequently Asked Questions About the Market Study (FAQs):
The current market size of the United States (US) Gambling Market is evaluating trends and data to assess its potential growth, particularly as regulations continue to evolve.
State regulations create a complex environment that affects operational strategies for companies, necessitating tailored compliance approaches in various jurisdictions.
The main trends include the rise of online and mobile gambling, technological advancements in user experience, and a growing emphasis on responsible gambling practices.
Investment opportunities lie across various sectors, particularly in online platforms, sports betting technologies, and established casino operations as the market expands.
6Wresearch actively monitors the United States (US) Gambling Market and publishes its comprehensive annual report, highlighting emerging trends, growth drivers, revenue analysis, and forecast outlook. Our insights help businesses to make data-backed strategic decisions with ongoing market dynamics. Our analysts track relevent industries related to the United States (US) Gambling Market, allowing our clients with actionable intelligence and reliable forecasts tailored to emerging regional needs.
Yes, we provide customisation as per your requirements. To learn more, feel free to contact us on sales@6wresearch.com
1 Executive Summary |
2 Introduction |
2.1 Key Highlights of the Report |
2.2 Report Description |
2.3 Market Scope & Segmentation |
2.4 Research Methodology |
2.5 Assumptions |
3 United States (US) Gambling Market Overview |
3.1 United States (US) Country Macro Economic Indicators |
3.2 United States (US) Gambling Market Revenues & Volume, 2022 & 2032F |
3.3 United States (US) Gambling Market - Industry Life Cycle |
3.4 United States (US) Gambling Market - Porter's Five Forces |
3.5 United States (US) Gambling Market Revenues & Volume Share, By Product Type, 2022 & 2032F |
3.6 United States (US) Gambling Market Revenues & Volume Share, By Channel Type, 2022 & 2032F |
3.7 United States (US) Gambling Market Revenues & Volume Share, By Platform, 2022 & 2032F |
4 United States (US) Gambling Market Dynamics |
4.1 Impact Analysis |
4.2 Market Drivers |
4.2.1 Legalization of online gambling in more states |
4.2.2 Growing popularity of sports betting |
4.2.3 Increasing disposable income of consumers |
4.3 Market Restraints |
4.3.1 Regulatory challenges and compliance costs |
4.3.2 Social stigma associated with gambling |
4.3.3 Competition from illegal gambling activities |
5 United States (US) Gambling Market Trends |
6 United States (US) Gambling Market, By Types |
6.1 United States (US) Gambling Market, By Product Type |
6.1.1 Overview and Analysis |
6.1.2 United States (US) Gambling Market Revenues & Volume, By Product Type, 2022-2032F |
6.1.3 United States (US) Gambling Market Revenues & Volume, By Betting, 2022-2032F |
6.1.4 United States (US) Gambling Market Revenues & Volume, By Casino, 2022-2032F |
6.1.5 United States (US) Gambling Market Revenues & Volume, By Lottery, 2022-2032F |
6.1.6 United States (US) Gambling Market Revenues & Volume, By Others, 2022-2032F |
6.2 United States (US) Gambling Market, By Channel Type |
6.2.1 Overview and Analysis |
6.2.2 United States (US) Gambling Market Revenues & Volume, By Offline, 2022-2032F |
6.2.3 United States (US) Gambling Market Revenues & Volume, By Online, 2022-2032F |
6.2.4 United States (US) Gambling Market Revenues & Volume, By Virtual Reality VR, 2022-2032F |
6.3 United States (US) Gambling Market, By Platform |
6.3.1 Overview and Analysis |
6.3.2 United States (US) Gambling Market Revenues & Volume, By Land-Based, 2022-2032F |
6.3.3 United States (US) Gambling Market Revenues & Volume, By Online, 2022-2032F |
7 United States (US) Gambling Market Import-Export Trade Statistics |
7.1 United States (US) Gambling Market Export to Major Countries |
7.2 United States (US) Gambling Market Imports from Major Countries |
8 United States (US) Gambling Market Key Performance Indicators |
8.1 Average revenue per user (ARPU) |
8.2 Number of active users on gambling platforms |
8.3 Percentage of revenue from mobile gambling |
8.4 Customer retention rate |
8.5 Average session duration on gambling platforms |
9 United States (US) Gambling Market - Opportunity Assessment |
9.1 United States (US) Gambling Market Opportunity Assessment, By Product Type, 2022 & 2032F |
9.2 United States (US) Gambling Market Opportunity Assessment, By Channel Type, 2022 & 2032F |
9.3 United States (US) Gambling Market Opportunity Assessment, By Platform, 2022 & 2032F |
10 United States (US) Gambling Market - Competitive Landscape |
10.1 United States (US) Gambling Market Revenue Share, By Companies, 2025 |
10.2 United States (US) Gambling Market Competitive Benchmarking, By Operating and Technical Parameters |
11 Company Profiles |
12 Recommendations |
13 Disclaimer |
Global Go To Market Strategy - 2030
Export potential enables firms to identify high-growth global markets with greater confidence by combining advanced trade intelligence with a structured quantitative methodology. The framework analyzes emerging demand trends and country-level import patterns while integrating macroeconomic and trade datasets such as GDP and population forecasts, bilateral import–export flows, tariff structures, elasticity differentials between developed and developing economies, geographic distance, and import demand projections. Using weighted trade values from 2020–2024 as the base period to project country-to-country export potential for 2030, these inputs are operationalized through calculated drivers such as gravity model parameters, tariff impact factors, and projected GDP per-capita growth. Through an analysis of hidden potentials, demand hotspots, and market conditions that are most favorable to success, this method enables firms to focus on target countries, maximize returns, and global expansion with data, backed by accuracy.
By factoring in the projected importer demand gap that is currently unmet and could be potential opportunity, it identifies the potential for the Exporter (Country) among 190 countries, against the general trade analysis, which identifies the biggest importer or exporter.
To discover high-growth global markets and optimize your business strategy:
Click Here
Pricing
- Single User License$ 1,995
- Department License$ 2,400
- Site License$ 3,120
- Global License$ 3,795

Leadership Perspectives from Industry Events
Search
Thought Leadership and Analyst Meet


Our Clients
6WResearch In News
- India Air Conditioner Market Set for Strong Rebound in 2026 After Weather-Led Correction and GST-Driven Recovery: 6Wresearch
- ADAS in India: How Automatic Emergency Braking, Blind Spot Detection & Driver Monitoring are Transforming Road Safety
- Doha a strategic location for EV manufacturing hub: IPA Qatar
- Demand for luxury TVs surging in the GCC, says Samsung
- Empowering Growth: The Thriving Journey of Bangladesh’s Cable Industry
- Demand for luxury TVs surging in the GCC, says Samsung
Latest Reports
- Poland Fire Protection Systems Market (2026-2032)
- Cape Verde Portable Hand-Thrown Extinguisher Market (2026-2032)
- Canada Portable Hand-Thrown Extinguisher Market (2026-2032)
- Cameroon Portable Hand-Thrown Extinguisher Market (2026-2032)
- Burundi Portable Hand-Thrown Extinguisher Market (2026-2032)
- Burkina Faso Portable Hand-Thrown Extinguisher Market (2026-2032)
- Bulgaria Portable Hand-Thrown Extinguisher Market (2026-2032)
- Brunei Portable Hand-Thrown Extinguisher Market (2026-2032)
- Botswana Portable Hand-Thrown Extinguisher Market (2026-2032)
- Bosnia and Herzegovina Portable Hand-Thrown Extinguisher Market (2026-2032)
Industry Events and Analyst Meet

HIMTEX 2026

India Refining Summit 2026

India EV Show 2026

EV tech India Expo 2026

Auto Tech Asia 2026
Whitepaper
- Middle East & Africa Commercial Security Market Click here to view more.
- Middle East & Africa Fire Safety Systems & Equipment Market Click here to view more.
- GCC Drone Market Click here to view more.
- Middle East Lighting Fixture Market Click here to view more.
- GCC Physical & Perimeter Security Market Click here to view more.