Antigua and Barbuda Optical Emission Spectroscopy Market (2026-2032) | Industry, Trends, Forecast, Share, Analysis, Value, Outlook, Segmentation, Revenue, Growth, Size & Companies
Market Forecast By Offering (Equipment, Services), By Form Factor (Benchtop, Portable), By Excitation Source Type (Arc/Spark Optical Emission Spectroscopy, Inductively Coupled Plasma Optical Emission Spectroscopy), By Detector Type (Photomultiplier Tube (PMT), Solid State Detector (SSD), Hybrid), By Vertical (Oil & Gas, Metals and Heavy Machinery, Automotive, Scrap and Recycling, Aerospace & Defense, Chemicals, Infrastructure, Pharmaceuticals and Life Sciences) And Competitive Landscape
| Product Code: ETC5600874 | Publication Date: Nov 2023 | Updated Date: Mar 2026 | Product Type: Market Research Report | |
| Publisher: 6Wresearch | Author: Ravi Bhandari | No. of Pages: 60 | No. of Figures: 30 | No. of Tables: 5 |
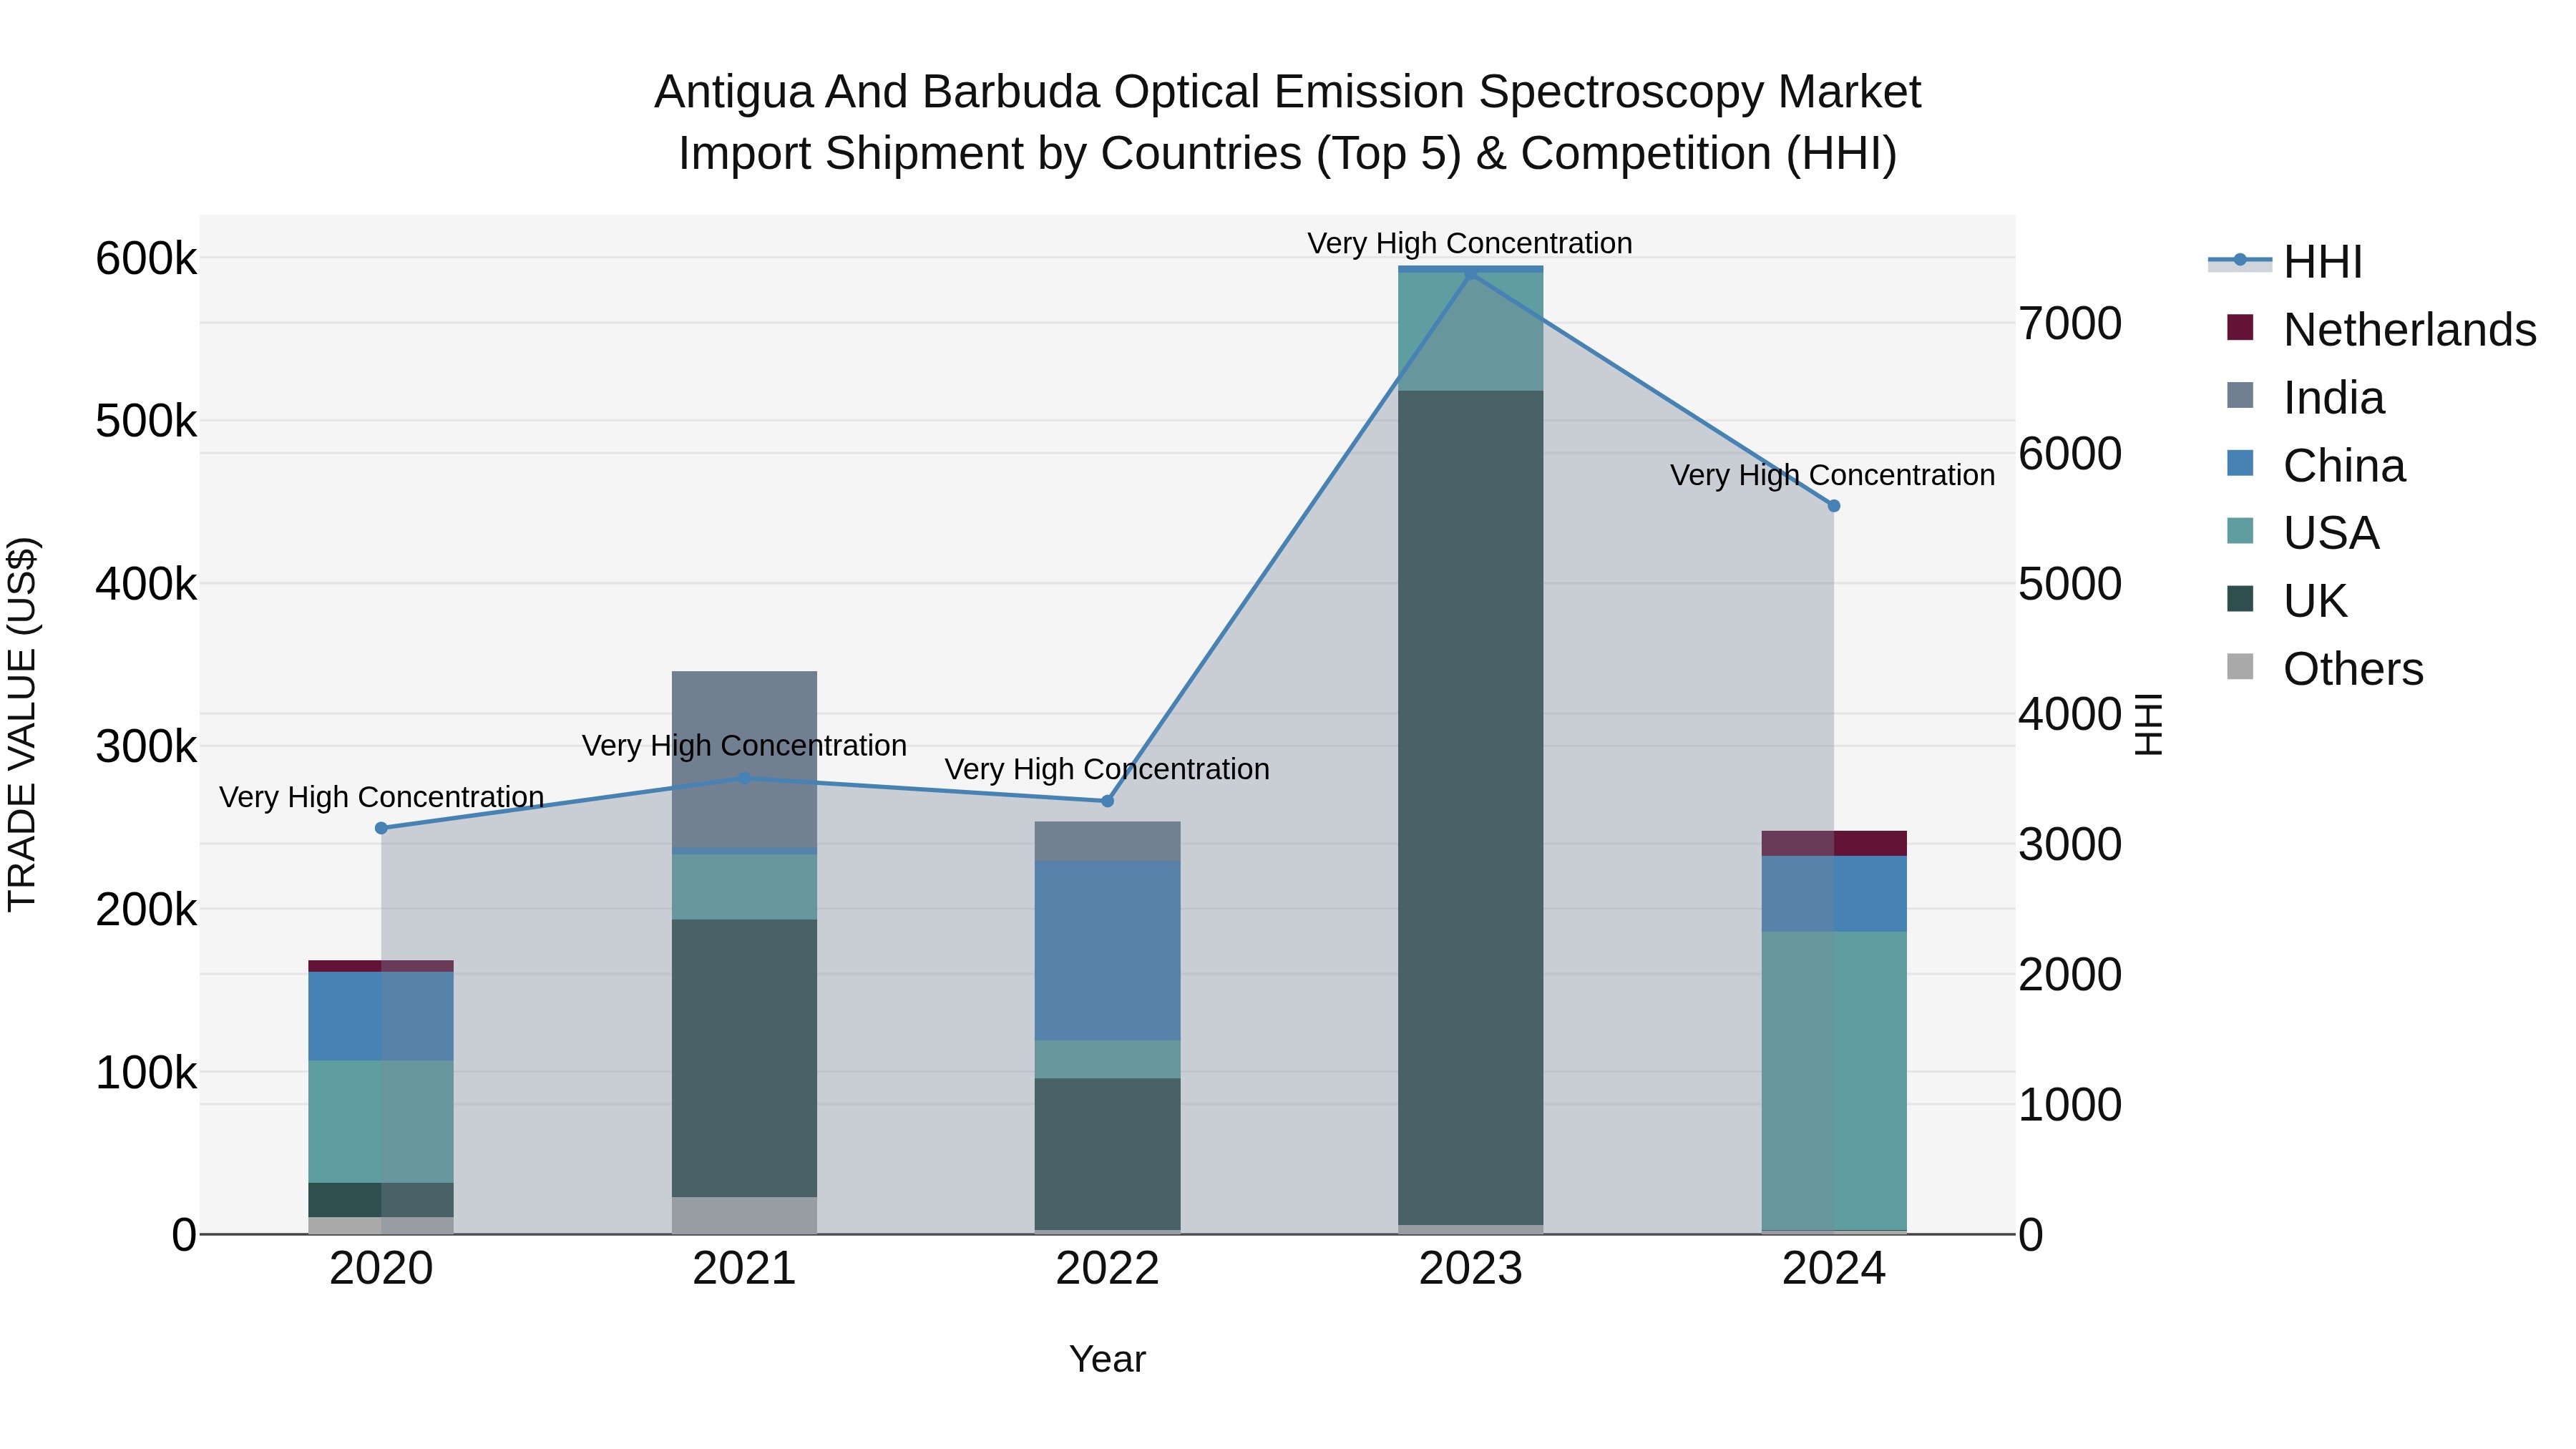
Antigua and Barbuda Optical Emission Spectroscopy Market Top 5 Importing Countries and Market Competition (HHI) Analysis
Antigua and Barbuda continued to heavily rely on optical emission spectroscopy imports in 2024, with the top exporting countries being the USA, China, Netherlands, Canada, and Germany. Despite a significant decrease in growth rate from 2023 to 2024, the compound annual growth rate from 2020 to 2024 remained strong at 10.17%. The High Herfindahl-Hirschman Index (HHI) indicates a very high concentration of imports in this sector, suggesting a dominant market presence by key exporting countries. This data underscores the importance of monitoring market dynamics and exploring diversification strategies in the optical emission spectroscopy industry for Antigua and Barbuda.
Key Highlights of the Report:
- Antigua and Barbuda Optical Emission Spectroscopy Market Outlook
- Market Size of Antigua and Barbuda Optical Emission Spectroscopy Market, 2025
- Forecast of Antigua and Barbuda Optical Emission Spectroscopy Market, 2032
- Historical Data and Forecast of Antigua and Barbuda Optical Emission Spectroscopy Revenues & Volume for the Period 2022 - 2032F
- Antigua and Barbuda Optical Emission Spectroscopy Market Trend Evolution
- Antigua and Barbuda Optical Emission Spectroscopy Market Drivers and Challenges
- Antigua and Barbuda Optical Emission Spectroscopy Price Trends
- Antigua and Barbuda Optical Emission Spectroscopy Porter`s Five Forces
- Antigua and Barbuda Optical Emission Spectroscopy Industry Life Cycle
- Historical Data and Forecast of Antigua and Barbuda Optical Emission Spectroscopy Market Revenues & Volume By Offering for the Period 2022 - 2032F
- Historical Data and Forecast of Antigua and Barbuda Optical Emission Spectroscopy Market Revenues & Volume By Equipment for the Period 2022 - 2032F
- Historical Data and Forecast of Antigua and Barbuda Optical Emission Spectroscopy Market Revenues & Volume By Services for the Period 2022 - 2032F
- Historical Data and Forecast of Antigua and Barbuda Optical Emission Spectroscopy Market Revenues & Volume By Form Factor for the Period 2022 - 2032F
- Historical Data and Forecast of Antigua and Barbuda Optical Emission Spectroscopy Market Revenues & Volume By Benchtop for the Period 2022 - 2032F
- Historical Data and Forecast of Antigua and Barbuda Optical Emission Spectroscopy Market Revenues & Volume By Portable for the Period 2022 - 2032F
- Historical Data and Forecast of Antigua and Barbuda Optical Emission Spectroscopy Market Revenues & Volume By Excitation Source Type for the Period 2022 - 2032F
- Historical Data and Forecast of Antigua and Barbuda Optical Emission Spectroscopy Market Revenues & Volume By Arc/Spark Optical Emission Spectroscopy for the Period 2022 - 2032F
- Historical Data and Forecast of Antigua and Barbuda Optical Emission Spectroscopy Market Revenues & Volume By Inductively Coupled Plasma Optical Emission Spectroscopy for the Period 2022 - 2032F
- Historical Data and Forecast of Antigua and Barbuda Optical Emission Spectroscopy Market Revenues & Volume By Detector Type for the Period 2022 - 2032F
- Historical Data and Forecast of Antigua and Barbuda Optical Emission Spectroscopy Market Revenues & Volume By Photomultiplier Tube (PMT) for the Period 2022 - 2032F
- Historical Data and Forecast of Antigua and Barbuda Optical Emission Spectroscopy Market Revenues & Volume By Solid State Detector (SSD) for the Period 2022 - 2032F
- Historical Data and Forecast of Antigua and Barbuda Optical Emission Spectroscopy Market Revenues & Volume By Hybrid for the Period 2022 - 2032F
- Historical Data and Forecast of Antigua and Barbuda Optical Emission Spectroscopy Market Revenues & Volume By Vertical for the Period 2022 - 2032F
- Historical Data and Forecast of Antigua and Barbuda Optical Emission Spectroscopy Market Revenues & Volume By Oil & Gas for the Period 2022 - 2032F
- Historical Data and Forecast of Antigua and Barbuda Optical Emission Spectroscopy Market Revenues & Volume By Metals and Heavy Machinery for the Period 2022 - 2032F
- Historical Data and Forecast of Antigua and Barbuda Optical Emission Spectroscopy Market Revenues & Volume By Automotive for the Period 2022 - 2032F
- Historical Data and Forecast of Antigua and Barbuda Optical Emission Spectroscopy Market Revenues & Volume By Scrap and Recycling for the Period 2022 - 2032F
- Historical Data and Forecast of Antigua and Barbuda Optical Emission Spectroscopy Market Revenues & Volume By Aerospace & Defense for the Period 2022 - 2032F
- Historical Data and Forecast of Antigua and Barbuda Optical Emission Spectroscopy Market Revenues & Volume By Chemicals for the Period 2022 - 2032F
- Historical Data and Forecast of Antigua and Barbuda Optical Emission Spectroscopy Market Revenues & Volume By Infrastructure for the Period 2022 - 2032F
- Historical Data and Forecast of Antigua and Barbuda Optical Emission Spectroscopy Market Revenues & Volume By Pharmaceuticals and Life Sciences for the Period 2022 - 2032F
- Antigua and Barbuda Optical Emission Spectroscopy Import Export Trade Statistics
- Market Opportunity Assessment By Offering
- Market Opportunity Assessment By Form Factor
- Market Opportunity Assessment By Excitation Source Type
- Market Opportunity Assessment By Detector Type
- Market Opportunity Assessment By Vertical
- Antigua and Barbuda Optical Emission Spectroscopy Top Companies Market Share
- Antigua and Barbuda Optical Emission Spectroscopy Competitive Benchmarking By Technical and Operational Parameters
- Antigua and Barbuda Optical Emission Spectroscopy Company Profiles
- Antigua and Barbuda Optical Emission Spectroscopy Key Strategic Recommendations
Frequently Asked Questions About the Market Study (FAQs):
6Wresearch actively monitors the Antigua and Barbuda Optical Emission Spectroscopy Market and publishes its comprehensive annual report, highlighting emerging trends, growth drivers, revenue analysis, and forecast outlook. Our insights help businesses to make data-backed strategic decisions with ongoing market dynamics. Our analysts track relevent industries related to the Antigua and Barbuda Optical Emission Spectroscopy Market, allowing our clients with actionable intelligence and reliable forecasts tailored to emerging regional needs.
Yes, we provide customisation as per your requirements. To learn more, feel free to contact us on sales@6wresearch.com
1 Executive Summary |
2 Introduction |
2.1 Key Highlights of the Report |
2.2 Report Description |
2.3 Market Scope & Segmentation |
2.4 Research Methodology |
2.5 Assumptions |
3 Antigua and Barbuda Optical Emission Spectroscopy Market Overview |
3.1 Antigua and Barbuda Country Macro Economic Indicators |
3.2 Antigua and Barbuda Optical Emission Spectroscopy Market Revenues & Volume, 2022 & 2032F |
3.3 Antigua and Barbuda Optical Emission Spectroscopy Market - Industry Life Cycle |
3.4 Antigua and Barbuda Optical Emission Spectroscopy Market - Porter's Five Forces |
3.5 Antigua and Barbuda Optical Emission Spectroscopy Market Revenues & Volume Share, By Offering , 2022 & 2032F |
3.6 Antigua and Barbuda Optical Emission Spectroscopy Market Revenues & Volume Share, By Form Factor, 2022 & 2032F |
3.7 Antigua and Barbuda Optical Emission Spectroscopy Market Revenues & Volume Share, By Excitation Source Type, 2022 & 2032F |
3.8 Antigua and Barbuda Optical Emission Spectroscopy Market Revenues & Volume Share, By Detector Type, 2022 & 2032F |
3.9 Antigua and Barbuda Optical Emission Spectroscopy Market Revenues & Volume Share, By Vertical, 2022 & 2032F |
4 Antigua and Barbuda Optical Emission Spectroscopy Market Dynamics |
4.1 Impact Analysis |
4.2 Market Drivers |
4.2.1 Growing demand for high-quality analytical instruments for research and industrial applications |
4.2.2 Increasing focus on environmental monitoring and compliance regulations driving the need for spectroscopy solutions |
4.2.3 Technological advancements leading to the development of more efficient and accurate optical emission spectroscopy systems |
4.3 Market Restraints |
4.3.1 High initial investment costs associated with purchasing and maintaining optical emission spectroscopy equipment |
4.3.2 Limited availability of skilled professionals proficient in operating and interpreting data from spectroscopy instruments |
4.3.3 Challenges related to calibration and standardization of optical emission spectroscopy systems |
5 Antigua and Barbuda Optical Emission Spectroscopy Market Trends |
6 Antigua and Barbuda Optical Emission Spectroscopy Market Segmentations |
6.1 Antigua and Barbuda Optical Emission Spectroscopy Market, By Offering |
6.1.1 Overview and Analysis |
6.1.2 Antigua and Barbuda Optical Emission Spectroscopy Market Revenues & Volume, By Equipment, 2022 - 2032F |
6.1.3 Antigua and Barbuda Optical Emission Spectroscopy Market Revenues & Volume, By Services, 2022 - 2032F |
6.2 Antigua and Barbuda Optical Emission Spectroscopy Market, By Form Factor |
6.2.1 Overview and Analysis |
6.2.2 Antigua and Barbuda Optical Emission Spectroscopy Market Revenues & Volume, By Benchtop, 2022 - 2032F | 6.2.3 Antigua and Barbuda Optical Emission Spectroscopy Market Revenues & Volume, By Portable, 2022 - 2032F |
6.3 Antigua and Barbuda Optical Emission Spectroscopy Market, By Excitation Source Type |
6.3.1 Overview and Analysis |
6.3.2 Antigua and Barbuda Optical Emission Spectroscopy Market Revenues & Volume, By Arc/Spark Optical Emission Spectroscopy, 2022 - 2032F |
6.3.3 Antigua and Barbuda Optical Emission Spectroscopy Market Revenues & Volume, By Inductively Coupled Plasma Optical Emission Spectroscopy, 2022 - 2032F |
6.4 Antigua and Barbuda Optical Emission Spectroscopy Market, By Detector Type |
6.4.1 Overview and Analysis |
6.4.2 Antigua and Barbuda Optical Emission Spectroscopy Market Revenues & Volume, By Photomultiplier Tube (PMT), 2022 - 2032F |
6.4.3 Antigua and Barbuda Optical Emission Spectroscopy Market Revenues & Volume, By Solid State Detector (SSD), 2022 - 2032F |
6.4.4 Antigua and Barbuda Optical Emission Spectroscopy Market Revenues & Volume, By Hybrid, 2022 - 2032F |
6.5 Antigua and Barbuda Optical Emission Spectroscopy Market, By Vertical |
6.5.1 Overview and Analysis |
6.5.2 Antigua and Barbuda Optical Emission Spectroscopy Market Revenues & Volume, By Oil & Gas, 2022 - 2032F |
6.5.3 Antigua and Barbuda Optical Emission Spectroscopy Market Revenues & Volume, By Metals and Heavy Machinery, 2022 - 2032F |
6.5.4 Antigua and Barbuda Optical Emission Spectroscopy Market Revenues & Volume, By Automotive, 2022 - 2032F |
6.5.5 Antigua and Barbuda Optical Emission Spectroscopy Market Revenues & Volume, By Scrap and Recycling, 2022 - 2032F |
6.5.6 Antigua and Barbuda Optical Emission Spectroscopy Market Revenues & Volume, By Aerospace & Defense, 2022 - 2032F |
6.5.7 Antigua and Barbuda Optical Emission Spectroscopy Market Revenues & Volume, By Chemicals, 2022 - 2032F |
6.5.8 Antigua and Barbuda Optical Emission Spectroscopy Market Revenues & Volume, By Pharmaceuticals and Life Sciences, 2022 - 2032F |
6.5.9 Antigua and Barbuda Optical Emission Spectroscopy Market Revenues & Volume, By Pharmaceuticals and Life Sciences, 2022 - 2032F |
7 Antigua and Barbuda Optical Emission Spectroscopy Market Import-Export Trade Statistics |
7.1 Antigua and Barbuda Optical Emission Spectroscopy Market Export to Major Countries |
7.2 Antigua and Barbuda Optical Emission Spectroscopy Market Imports from Major Countries |
8 Antigua and Barbuda Optical Emission Spectroscopy Market Key Performance Indicators |
8.1 Average number of new research projects utilizing optical emission spectroscopy technology |
8.2 Percentage increase in government spending on environmental monitoring initiatives |
8.3 Rate of adoption of next-generation optical emission spectroscopy systems |
8.4 Level of participation in industry conferences and workshops related to spectroscopy technology |
8.5 Number of research publications citing the use of optical emission spectroscopy in Antigua and Barbuda |
9 Antigua and Barbuda Optical Emission Spectroscopy Market - Opportunity Assessment |
9.1 Antigua and Barbuda Optical Emission Spectroscopy Market Opportunity Assessment, By Offering , 2022 & 2032F |
9.2 Antigua and Barbuda Optical Emission Spectroscopy Market Opportunity Assessment, By Form Factor, 2022 & 2032F |
9.3 Antigua and Barbuda Optical Emission Spectroscopy Market Opportunity Assessment, By Excitation Source Type, 2022 & 2032F |
9.4 Antigua and Barbuda Optical Emission Spectroscopy Market Opportunity Assessment, By Detector Type, 2022 & 2032F |
9.5 Antigua and Barbuda Optical Emission Spectroscopy Market Opportunity Assessment, By Vertical, 2022 & 2032F |
10 Antigua and Barbuda Optical Emission Spectroscopy Market - Competitive Landscape |
10.1 Antigua and Barbuda Optical Emission Spectroscopy Market Revenue Share, By Companies, 2025 |
10.2 Antigua and Barbuda Optical Emission Spectroscopy Market Competitive Benchmarking, By Operating and Technical Parameters |
11 Company Profiles |
12 Recommendations | 13 Disclaimer |
Global Go To Market Strategy - 2030
Export potential enables firms to identify high-growth global markets with greater confidence by combining advanced trade intelligence with a structured quantitative methodology. The framework analyzes emerging demand trends and country-level import patterns while integrating macroeconomic and trade datasets such as GDP and population forecasts, bilateral import–export flows, tariff structures, elasticity differentials between developed and developing economies, geographic distance, and import demand projections. Using weighted trade values from 2020–2024 as the base period to project country-to-country export potential for 2030, these inputs are operationalized through calculated drivers such as gravity model parameters, tariff impact factors, and projected GDP per-capita growth. Through an analysis of hidden potentials, demand hotspots, and market conditions that are most favorable to success, this method enables firms to focus on target countries, maximize returns, and global expansion with data, backed by accuracy.
By factoring in the projected importer demand gap that is currently unmet and could be potential opportunity, it identifies the potential for the Exporter (Country) among 190 countries, against the general trade analysis, which identifies the biggest importer or exporter.
To discover high-growth global markets and optimize your business strategy:
Click Here
Pricing
- Single User License$ 1,995
- Department License$ 2,400
- Site License$ 3,120
- Global License$ 3,795

Leadership Perspectives from Industry Events
Search
Thought Leadership and Analyst Meet


Our Clients
6WResearch In News
- India Export Attractiveness Tracker 2026
- India Air Conditioner Market Set for Strong Rebound in 2026 After Weather-Led Correction and GST-Driven Recovery: 6Wresearch
- ADAS in India: How Automatic Emergency Braking, Blind Spot Detection & Driver Monitoring are Transforming Road Safety
- Doha a strategic location for EV manufacturing hub: IPA Qatar
- Demand for luxury TVs surging in the GCC, says Samsung
- Empowering Growth: The Thriving Journey of Bangladesh’s Cable Industry
Latest Reports
- Nicaragua RPG Gaming Market (2026-2032)
- New Zealand RPG Gaming Market (2026-2032)
- Netherlands RPG Gaming Market (2026-2032)
- Nauru RPG Gaming Market (2026-2032)
- Namibia RPG Gaming Market (2026-2032)
- Mozambique RPG Gaming Market (2026-2032)
- Montenegro RPG Gaming Market (2026-2032)
- Mongolia RPG Gaming Market (2026-2032)
- Monaco RPG Gaming Market (2026-2032)
- Micronesia RPG Gaming Market (2026-2032)
Industry Events and Analyst Meet

EV India Expo 2026

HIMTEX 2026

India Refining Summit 2026

India EV Show 2026

EV tech India Expo 2026
Whitepaper
- Middle East & Africa Commercial Security Market Click here to view more.
- Middle East & Africa Fire Safety Systems & Equipment Market Click here to view more.
- GCC Drone Market Click here to view more.
- Middle East Lighting Fixture Market Click here to view more.
- GCC Physical & Perimeter Security Market Click here to view more.