Argentina Pour Point Depressant Market (2026-2032) Outlook | Companies, Industry, Trends, Size, Share, Revenue, Forecast, Analysis, Value & Growth
Market Forecast By Chemistry (polyalkylmethacrylates, styrene esters, ethylene co vinyl acetate, poly alpha olefin, others), By End User (Lubricant Industry , Oil & Gas Industry) And Competitive Landscape
| Product Code: ETC4484226 | Publication Date: Jul 2023 | Updated Date: Mar 2026 | Product Type: Report | |
| Publisher: 6Wresearch | Author: Dhaval Chaurasia | No. of Pages: 85 | No. of Figures: 45 | No. of Tables: 25 |
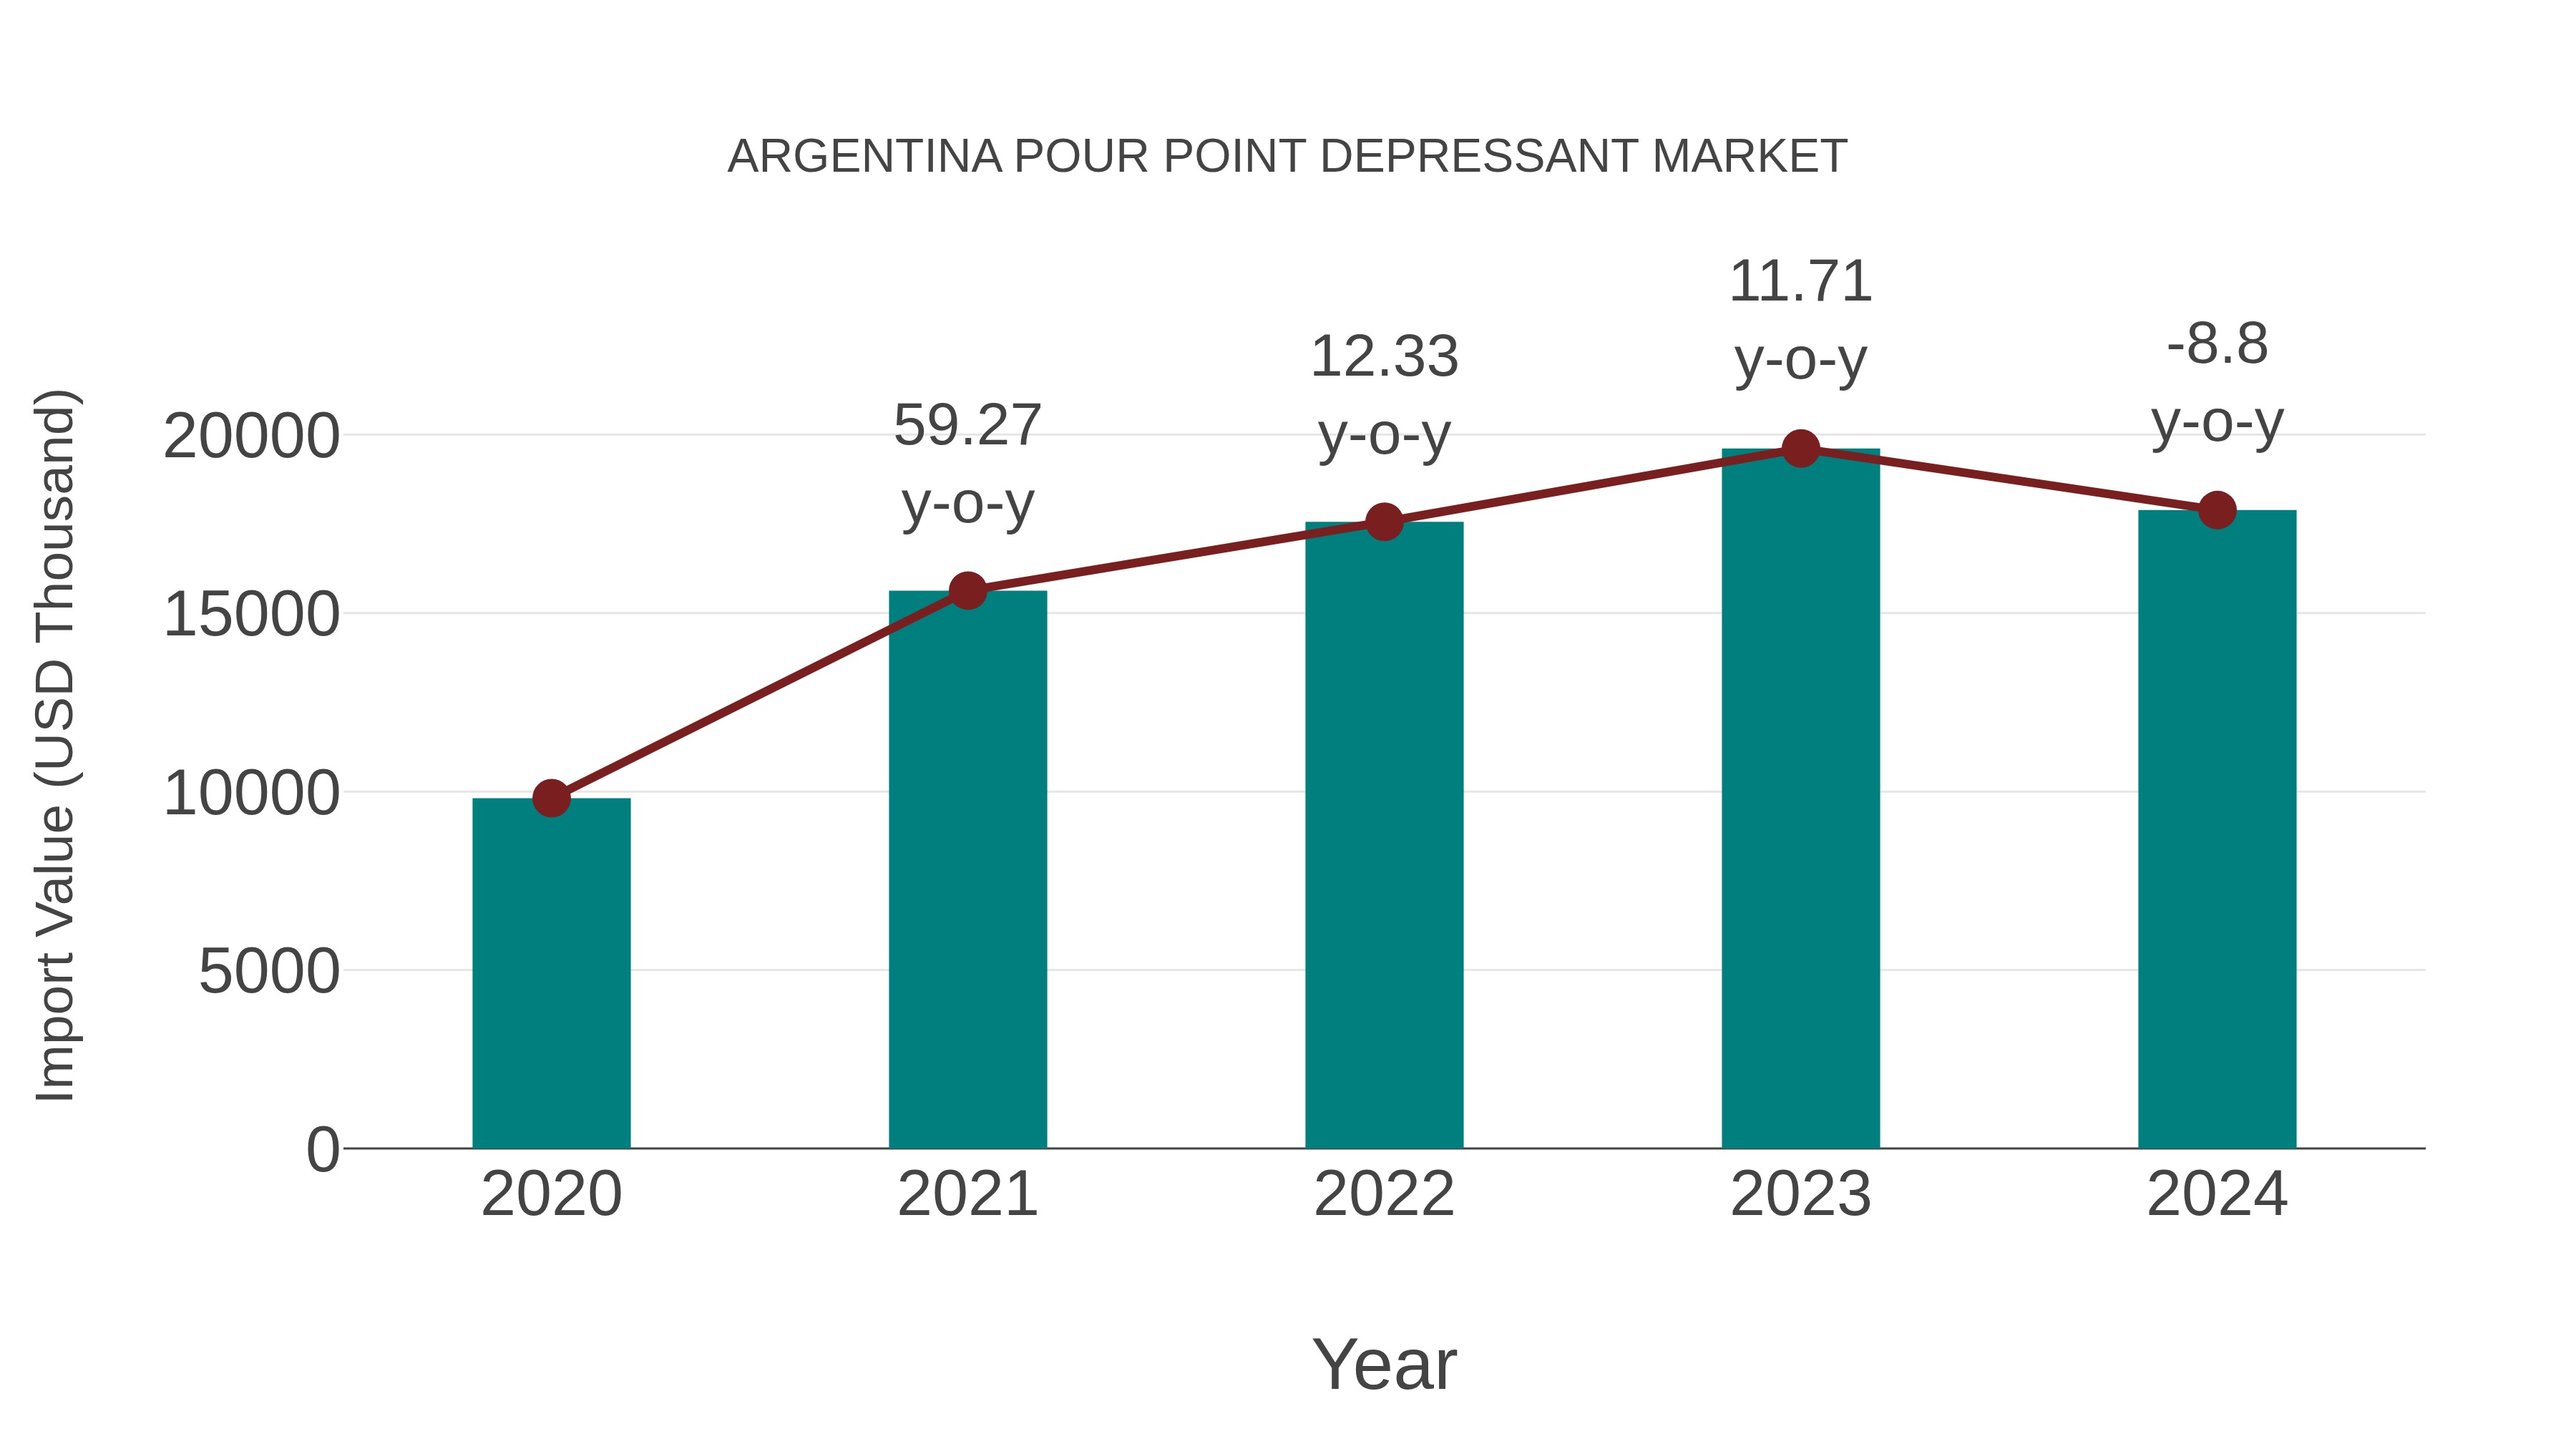
Argentina Pour Point Depressant Market: Import Trend Analysis
The Argentina pour point depressant market saw a steady growth trend in imports from 2020 to 2024, with a Compound Annual Growth Rate (CAGR) of 16.19%. However, in 2023-2024, there was a slight decline in the year-on-year growth rate, which stood at -8.80%. Despite this, the overall import volume increased during this period.
Argentina Pour Point Depressant Market Synopsis
The Argentina pour point depressant market is expanding, supported by the demand for additives that improve the low-temperature flow properties of oils and fuels. Pour point depressants prevent wax crystal formation and gelling in cold climates, ensuring the operability and performance of lubricants, diesel fuels, and heating oils in Argentina.
Drivers of the market
The Argentina pour point depressant market is experiencing significant growth owing to the increasing demand for efficient oil extraction techniques in the country`s oil and gas industry. Pour point depressants are additives used to lower the pour point of crude oil, enabling easier transportation and extraction in cold environments. With the expansion of oil exploration and production activities, there is a growing need for pour point depressants to optimize oil recovery processes, thereby driving market growth.
Challenges of the market
In the pour point depressant market of Argentina, challenges stem from climate variability and infrastructure limitations. Pour point depressants, used in the oil and gas industry to improve flow properties of crude oil, are essential for operations in cold climates. However, unpredictable weather conditions and inadequate infrastructure for transporting treated crude oil can hinder market growth and operational efficiency.
Government Policy of the market
Argentina chemical and petroleum regulations govern the production, distribution, and usage of pour point depressants, which are additives used to lower the pour point of oils and fuels. Government measures may include chemical safety standards, environmental regulations, and import/export controls to ensure the effectiveness and safety of pour point depressants in various applications.
Key Highlights of the Report:
- Argentina Pour Point Depressant Market Outlook
- Market Size of Argentina Pour Point Depressant Market, 2025
- Forecast of Argentina Pour Point Depressant Market, 2032
- Historical Data and Forecast of Argentina Pour Point Depressant Revenues & Volume for the Period 2022-2032F
- Argentina Pour Point Depressant Market Trend Evolution
- Argentina Pour Point Depressant Market Drivers and Challenges
- Argentina Pour Point Depressant Price Trends
- Argentina Pour Point Depressant Porter's Five Forces
- Argentina Pour Point Depressant Industry Life Cycle
- Historical Data and Forecast of Argentina Pour Point Depressant Market Revenues & Volume By Chemistry for the Period 2022-2032F
- Historical Data and Forecast of Argentina Pour Point Depressant Market Revenues & Volume By polyalkylmethacrylates for the Period 2022-2032F
- Historical Data and Forecast of Argentina Pour Point Depressant Market Revenues & Volume By styrene esters for the Period 2022-2032F
- Historical Data and Forecast of Argentina Pour Point Depressant Market Revenues & Volume By ethylene co vinyl acetate for the Period 2022-2032F
- Historical Data and Forecast of Argentina Pour Point Depressant Market Revenues & Volume By poly alpha olefin for the Period 2022-2032F
- Historical Data and Forecast of Argentina Pour Point Depressant Market Revenues & Volume By others for the Period 2022-2032F
- Historical Data and Forecast of Argentina Pour Point Depressant Market Revenues & Volume By End User for the Period 2022-2032F
- Historical Data and Forecast of Argentina Pour Point Depressant Market Revenues & Volume By Lubricant Industry for the Period 2022-2032F
- Historical Data and Forecast of Argentina Pour Point Depressant Market Revenues & Volume By Oil & Gas Industry for the Period 2022-2032F
- Argentina Pour Point Depressant Import Export Trade Statistics
- Market Opportunity Assessment By Chemistry
- Market Opportunity Assessment By End User
- Argentina Pour Point Depressant Top Companies Market Share
- Argentina Pour Point Depressant Competitive Benchmarking By Technical and Operational Parameters
- Argentina Pour Point Depressant Company Profiles
- Argentina Pour Point Depressant Key Strategic Recommendations
Argentina Pour Point Depressant Market (2026-2032): FAQs
6Wresearch actively monitors the Argentina Pour Point Depressant Market and publishes its comprehensive annual report, highlighting emerging trends, growth drivers, revenue analysis, and forecast outlook. Our insights help businesses to make data-backed strategic decisions with ongoing market dynamics. Our analysts track relevent industries related to the Argentina Pour Point Depressant Market, allowing our clients with actionable intelligence and reliable forecasts tailored to emerging regional needs.
Yes, we provide customisation as per your requirements. To learn more, feel free to contact us on sales@6wresearch.com
1 Executive Summary |
2 Introduction |
2.1 Key Highlights of the Report |
2.2 Report Description |
2.3 Market Scope & Segmentation |
2.4 Research Methodology |
2.5 Assumptions |
3 Argentina Pour Point Depressant Market Overview |
3.1 Argentina Country Macro Economic Indicators |
3.2 Argentina Pour Point Depressant Market Revenues & Volume, 2022 & 2032F |
3.3 Argentina Pour Point Depressant Market - Industry Life Cycle |
3.4 Argentina Pour Point Depressant Market - Porter's Five Forces |
3.5 Argentina Pour Point Depressant Market Revenues & Volume Share, By Chemistry, 2022 & 2032F |
3.6 Argentina Pour Point Depressant Market Revenues & Volume Share, By End User, 2022 & 2032F |
4 Argentina Pour Point Depressant Market Dynamics |
4.1 Impact Analysis |
4.2 Market Drivers |
4.2.1 Growing demand for crude oil and refined petroleum products in Argentina |
4.2.2 Increasing focus on energy efficiency and environmental regulations driving the need for pour point depressants |
4.2.3 Technological advancements leading to the development of more efficient and cost-effective pour point depressants |
4.3 Market Restraints |
4.3.1 Fluctuating raw material prices impacting the production cost of pour point depressants |
4.3.2 Slow adoption of new technologies and products in the market |
4.3.3 Regulatory challenges and compliance issues related to pour point depressants |
5 Argentina Pour Point Depressant Market Trends |
6 Argentina Pour Point Depressant Market, By Types |
6.1 Argentina Pour Point Depressant Market, By Chemistry |
6.1.1 Overview and Analysis |
6.1.2 Argentina Pour Point Depressant Market Revenues & Volume, By Chemistry, 2022-2032F |
6.1.3 Argentina Pour Point Depressant Market Revenues & Volume, By polyalkylmethacrylates, 2022-2032F |
6.1.4 Argentina Pour Point Depressant Market Revenues & Volume, By styrene esters, 2022-2032F |
6.1.5 Argentina Pour Point Depressant Market Revenues & Volume, By ethylene co vinyl acetate, 2022-2032F |
6.1.6 Argentina Pour Point Depressant Market Revenues & Volume, By poly alpha olefin, 2022-2032F |
6.1.7 Argentina Pour Point Depressant Market Revenues & Volume, By others, 2022-2032F |
6.2 Argentina Pour Point Depressant Market, By End User |
6.2.1 Overview and Analysis |
6.2.2 Argentina Pour Point Depressant Market Revenues & Volume, By Lubricant Industry , 2022-2032F |
6.2.3 Argentina Pour Point Depressant Market Revenues & Volume, By Oil & Gas Industry, 2022-2032F |
7 Argentina Pour Point Depressant Market Import-Export Trade Statistics |
7.1 Argentina Pour Point Depressant Market Export to Major Countries |
7.2 Argentina Pour Point Depressant Market Imports from Major Countries |
8 Argentina Pour Point Depressant Market Key Performance Indicators |
8.1 Research and development investment in pour point depressant technologies |
8.2 Number of patents filed for innovative pour point depressant solutions |
8.3 Adoption rate of pour point depressants in the Argentine oil and gas industry |
9 Argentina Pour Point Depressant Market - Opportunity Assessment |
9.1 Argentina Pour Point Depressant Market Opportunity Assessment, By Chemistry, 2022 & 2032F |
9.2 Argentina Pour Point Depressant Market Opportunity Assessment, By End User, 2022 & 2032F |
10 Argentina Pour Point Depressant Market - Competitive Landscape |
10.1 Argentina Pour Point Depressant Market Revenue Share, By Companies, 2025 |
10.2 Argentina Pour Point Depressant Market Competitive Benchmarking, By Operating and Technical Parameters |
11 Company Profiles |
12 Recommendations |
13 Disclaimer |
Global Go To Market Strategy - 2030
Export potential enables firms to identify high-growth global markets with greater confidence by combining advanced trade intelligence with a structured quantitative methodology. The framework analyzes emerging demand trends and country-level import patterns while integrating macroeconomic and trade datasets such as GDP and population forecasts, bilateral import–export flows, tariff structures, elasticity differentials between developed and developing economies, geographic distance, and import demand projections. Using weighted trade values from 2020–2024 as the base period to project country-to-country export potential for 2030, these inputs are operationalized through calculated drivers such as gravity model parameters, tariff impact factors, and projected GDP per-capita growth. Through an analysis of hidden potentials, demand hotspots, and market conditions that are most favorable to success, this method enables firms to focus on target countries, maximize returns, and global expansion with data, backed by accuracy.
By factoring in the projected importer demand gap that is currently unmet and could be potential opportunity, it identifies the potential for the Exporter (Country) among 190 countries, against the general trade analysis, which identifies the biggest importer or exporter.
To discover high-growth global markets and optimize your business strategy:
Click Here
Pricing
- Single User License$ 1,995
- Department License$ 2,400
- Site License$ 3,120
- Global License$ 3,795

Leadership Perspectives from Industry Events
Search
Thought Leadership and Analyst Meet


Our Clients
6WResearch In News
- India Export Attractiveness Tracker 2026
- India Air Conditioner Market Set for Strong Rebound in 2026 After Weather-Led Correction and GST-Driven Recovery: 6Wresearch
- ADAS in India: How Automatic Emergency Braking, Blind Spot Detection & Driver Monitoring are Transforming Road Safety
- Doha a strategic location for EV manufacturing hub: IPA Qatar
- Demand for luxury TVs surging in the GCC, says Samsung
- Empowering Growth: The Thriving Journey of Bangladesh’s Cable Industry
Latest Reports
- Nicaragua RPG Gaming Market (2026-2032)
- New Zealand RPG Gaming Market (2026-2032)
- Netherlands RPG Gaming Market (2026-2032)
- Nauru RPG Gaming Market (2026-2032)
- Namibia RPG Gaming Market (2026-2032)
- Mozambique RPG Gaming Market (2026-2032)
- Montenegro RPG Gaming Market (2026-2032)
- Mongolia RPG Gaming Market (2026-2032)
- Monaco RPG Gaming Market (2026-2032)
- Micronesia RPG Gaming Market (2026-2032)
Industry Events and Analyst Meet

EV India Expo 2026

HIMTEX 2026

India Refining Summit 2026

India EV Show 2026

EV tech India Expo 2026
Whitepaper
- Middle East & Africa Commercial Security Market Click here to view more.
- Middle East & Africa Fire Safety Systems & Equipment Market Click here to view more.
- GCC Drone Market Click here to view more.
- Middle East Lighting Fixture Market Click here to view more.
- GCC Physical & Perimeter Security Market Click here to view more.