Argentina Rare Earth & Products Market (2026-2032) | Industry, Size, Forecast, Growth, Trends, Value, Outlook, Companies, COVID-19 IMPACT, Share, Revenue & Analysis
Market Forecast By Product Types (Cerium, Dysprosium, Erbium, Europium, Gadolinium, Holmium, Lanthanum, Others), By Applications (Magnets, Catalysts, Metallurgy, Polishing, Glass, Phosphors, Ceramics, Others) And Competitive Landscape
| Product Code: ETC008725 | Publication Date: Jun 2023 | Product Type: Report | ||
| Publisher: 6Wresearch | Author: Ravi Bhandari | No. of Pages: 70 | No. of Figures: 35 | No. of Tables: 5 |
Argentina Rare Earth & Products Market Summary
The argentina rare earth & products market was estimated at USD 382 Million in 2025 and is projected to reach USD 523 Million by 2032, growing at a CAGR of 5.2% from 2026 to 2032.
Argentina Rare Earth & Products Market Year-wise Growth Rate and Key Drivers
This graph highlights how the Argentina Rare Earth & Products Market has steadily grown over the years, supported by major growth factors.
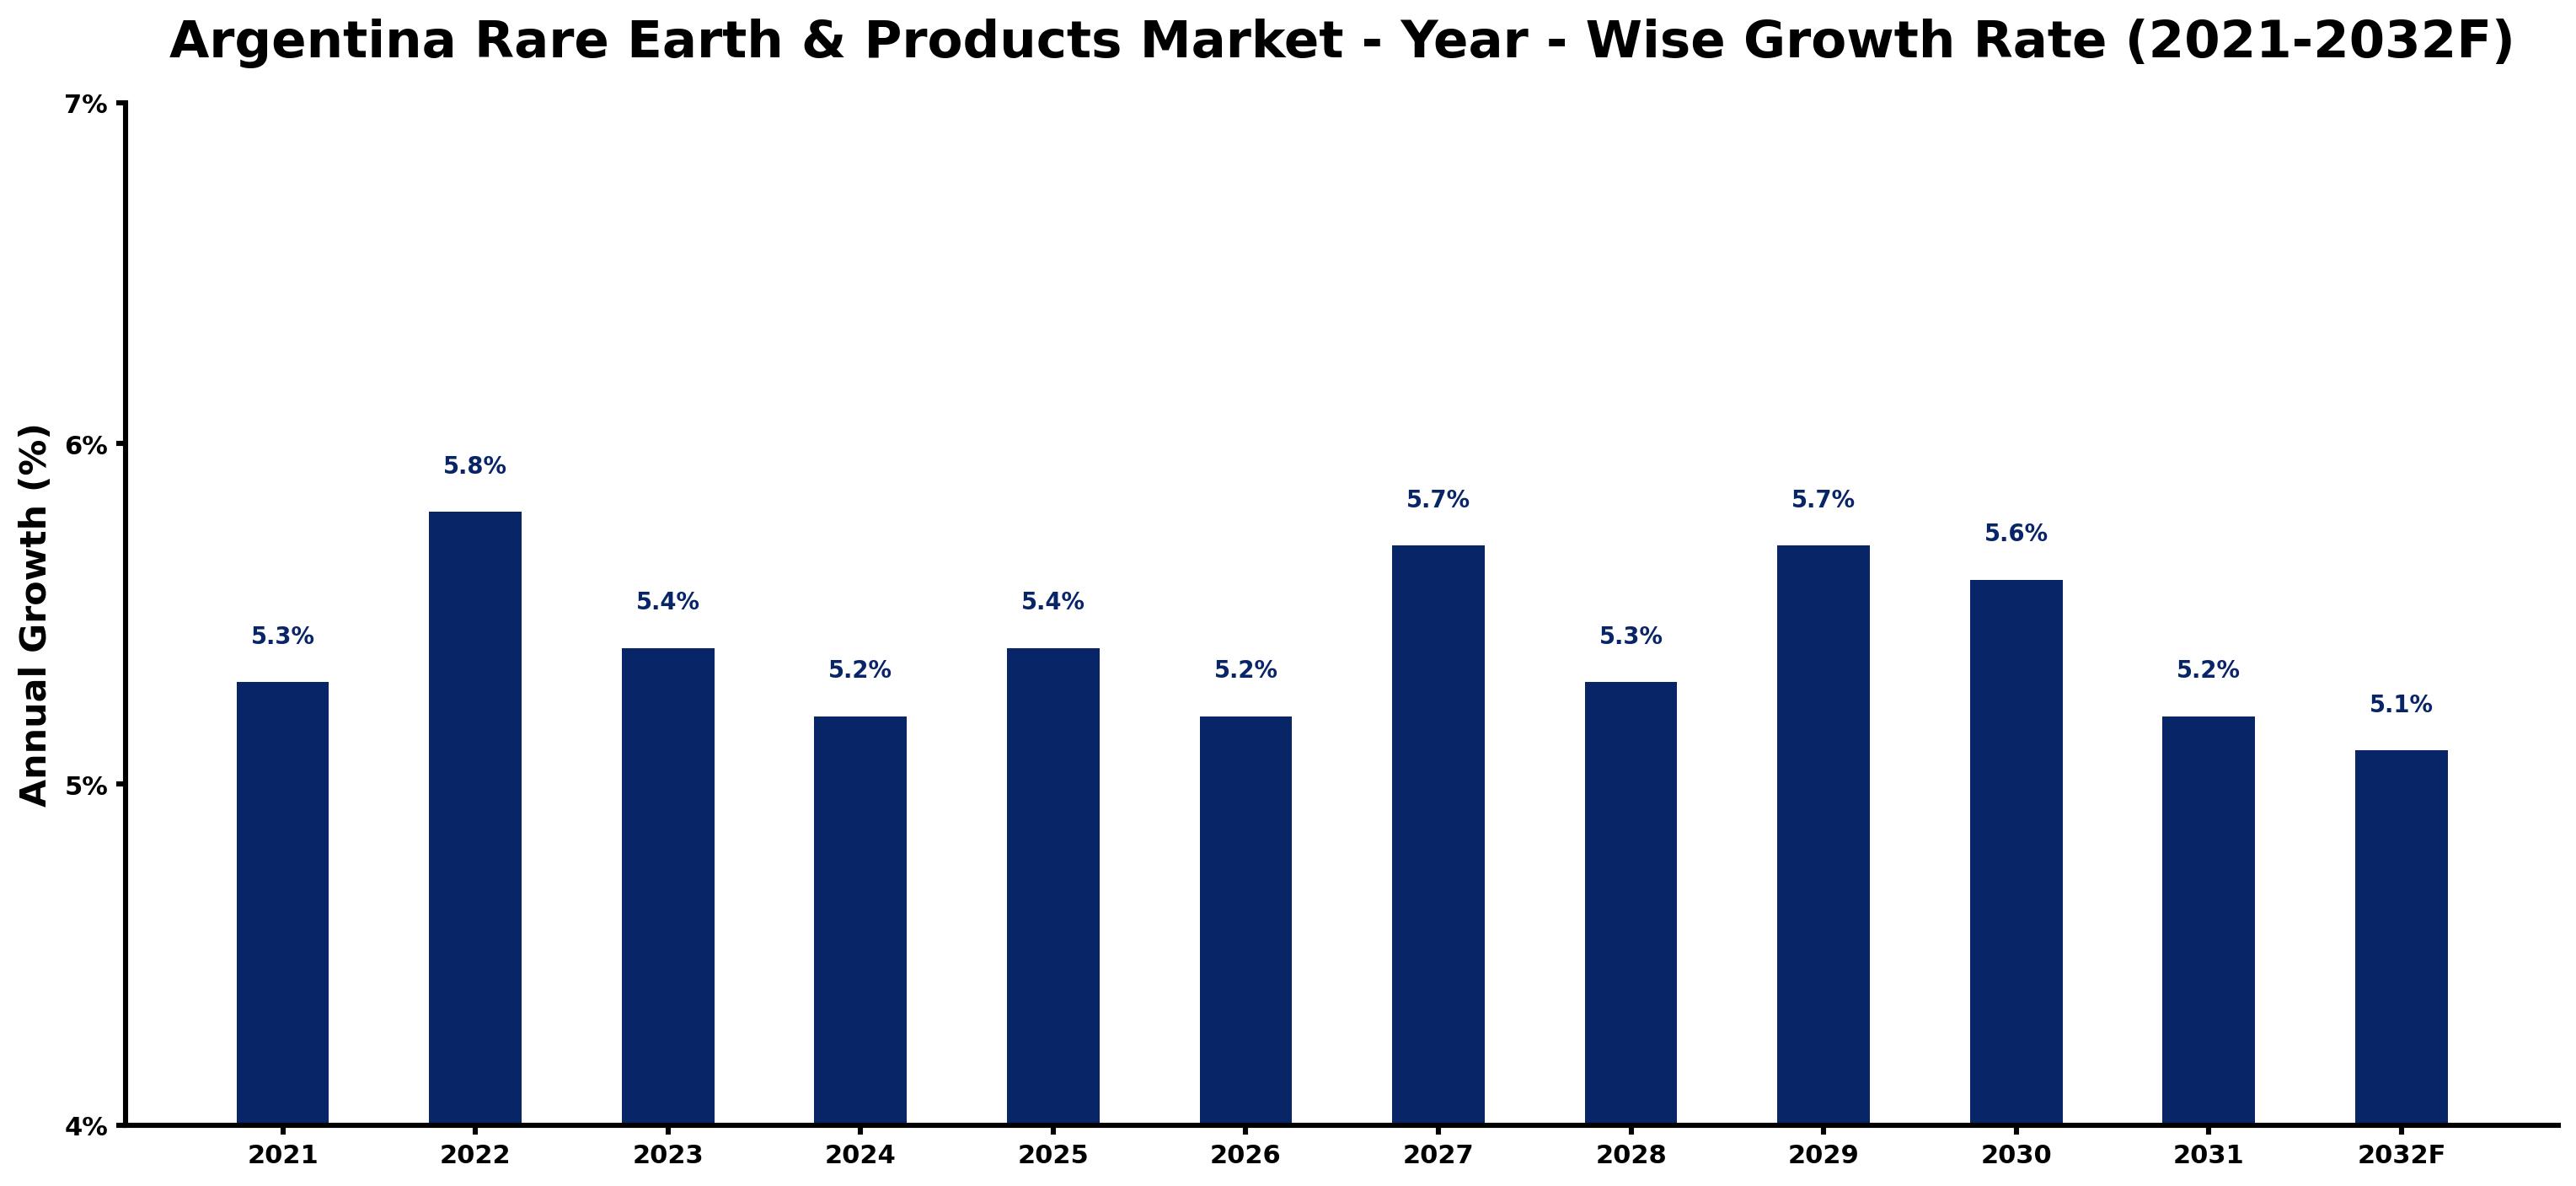
The table below presents the year wise growth rates along with the key drivers influencing the market
| Year | Growth Rate | Major Drivers |
| 2021 | 5.3% | Argentina's exploration of rare earth deposits begins attracting global attention and investors. |
| 2022 | 5.8% | Local partnerships emerge, encouraging the establishment of domestic rare earth processing facilities. |
| 2023 | 5.4% | Increased interest in electric vehicles boosts the market for rare earth materials significantly. |
| 2024 | 5.2% | Emerging technologies drive innovation in rare earth applications across various industries. |
| 2025 | 5.4% | Global supply chain challenges position Argentina as a key player in rare earth sourcing. |
| 2026 | 5.2% | Educational institutions launch programs focusing on rare earth elements and sustainable practices. |
| 2027 | 5.7% | Infrastructure improvements facilitate easier access to remote mining locations in Argentina. |
| 2028 | 5.3% | Changes in global trade dynamics create opportunities for Argentina's rare earth exports. |
| 2029 | 5.7% | Corporate investments in green technology enhance the demand for sustainable rare earth solutions. |
| 2030 | 5.6% | International collaborations lead to enhanced technology transfer in rare earth processing techniques. |
| 2031 | 5.2% | Local governments support initiatives to promote environmentally friendly mining practices. |
| 2032 | 5.1% | Argentina solidifies its position as a leading supplier of rare earth materials globally. |
Note - Market size estimations and growth projections presented in this report are based on 6Wresearch's advanced forecasting approach, validated with industry datasets as of June 2026.
Argentina Rare Earth & Products Market Synopsis
The Argentina Rare Earth Products Market is projected to reach 5.2% and witness significant growth during the forecast period (2026-2032). This growth is primarily driven by the rising demand for rare earth products across key industries such as automotive, consumer electronics, and energy storage systems. The increasing integration of rare earth elements in advanced technologies, coupled with supportive governmental policies aimed at enhancing national production capabilities, is expected to further bolster market expansion. Nevertheless, the market faces challenges, including uncertainties surrounding international trade policies and stringent environmental regulations which may impose limitations on growth.
Argentina Rare Earth & Products Market Growth Drivers
A multitude of factors is driving the growth of the Argentina Rare Earth & Products Market. Firstly, the automotive sector has emerged as a dominant force in the demand for rare earth products, particularly due to their application in electric vehicles (EVs). The necessary components of EVs, including magnets that incorporate cobalt and other rare earth materials, showcase the increasing reliance on these products. Secondly, the proliferation of consumer electronics, which increasingly utilize rare earth elements for enhanced performance, continues to push market demand. Additionally, the energy storage sector—critical for renewable energy applications—relies heavily on rare earth products to improve efficiency and capacity.
- Technological advancements in the manufacturing processes of rare earth products are creating more efficient production methodologies.
- Government incentives aimed at promoting local mining and processing capabilities are enhancing supply chains.
- Growing environmental consciousness is spurring investment in recycling and sustainable practices related to rare earth materials.
- The integration of rare earth elements into defense and aerospace applications is generating new avenues for market growth.
- Rising electric vehicle adoption rates globally, coupled with Argentina's strategic position in the supply chain, are creating favorable market conditions.
Argentina Rare Earth & Products Market Challenges and Restraints
Despite its promising growth trajectory, the Argentina Rare Earth & Products Market faces several challenges. One of the most significant hurdles is the uncertainty surrounding trade policies which can potentially impact the availability and pricing of rare earth materials. Additionally, the rigorous environmental regulations imposed by regulatory bodies present another barrier, as companies must navigate complex compliance requirements. This could lead to increased operational costs that may stifle innovation and competitiveness within the market.
- Trade tensions with countries that supply raw materials could disrupt supply chains, affecting production capacities.
- Environmental policies may necessitate costly investments in cleaner technologies, impacting profit margins.
- Global competition from established rare earth markets could suppress local growth opportunities.
- The challenge of securing skilled labor in the mining and processing sectors may hinder operational efficiency.
- Investor apprehension regarding volatility in the global rare earth market can restrict capital inflow.
Argentina Rare Earth & Products Market Regional Analysis
Regionally, Argentina holds a significant share in the global rare earth products market, primarily due to its substantial natural resources and a growing focus on research and development initiatives. The country is strategically positioned to become a leader in the supply of rare earth elements, supported by a favorable investment climate and an increasing number of local suppliers. Furthermore, the collaborative efforts between governmental bodies and private sectors are enhancing the overall market ecosystem, driving innovation in extraction and processing technologies.
- Argentina's geological diversity houses rich deposits of rare earth elements, establishing a basis for market leadership.
- Investment in R&D is fostering advancements in extraction techniques, improving yield rates and sustainability.
- The establishment of strategic partnerships with international firms can enhance technological transfer and operational capabilities.
- Local suppliers are increasingly adopting best practices to adhere to international standards, boosting the country's reputation.
- Ongoing infrastructure development is facilitating better logistics, thereby attracting greater investment in the sector.
Argentina Rare Earth & Products Market Government Investment and Initiatives
The Argentine government has recognized the strategic importance of the rare earth products market and has initiated several policies and programs aimed at fostering its development. These initiatives include financial incentives for companies that invest in mining and processing facilities, as well as grants for research aimed at enhancing efficiency and sustainability. Additionally, the government is actively promoting partnerships between public institutions and private entities to expedite technological advancements in the rare earth sector.
- Public funding has been earmarked for projects aimed at modernizing extraction techniques to reduce environmental impacts.
- Policies are being developed to streamline regulations, improving the ease of doing business in the rare earth market.
- Incentives for local production of rare earth products are encouraged, decreasing reliance on imports.
- Government agencies are collaborating with universities to enhance skills development in mining and processing sectors.
- Efforts are being made to improve public awareness regarding the economic benefits of rare earth production.
Argentina Rare Earth & Products Market Latest Developments (May 2025 - June 2026)
Recent trends in the Argentina Rare Earth & Products Market indicate a heightened focus on sustainability and innovation. Companies are increasingly investing in advanced technologies that enhance the extraction and processing of rare earth materials while minimizing environmental footprints. Additionally, there is a growing collaboration between industry stakeholders and governmental bodies aimed at addressing trade policy uncertainties and enhancing market access. The ongoing shift towards electric vehicles and renewable energy storage continues to serve as a key growth driver, positioning Argentina favorably in the global market landscape.
- The emergence of pilot projects focusing on environmentally friendly extraction methods is gaining traction.
- Strategic discussions are ongoing to solidify international partnerships for technology and knowledge transfer.
- Industry forums are being held to address pressing challenges within the sector, fostering a collaborative environment.
- New initiatives targeting workforce development in the rare earth sector are being launched to attract talent.
- Regulatory frameworks are being adjusted to support local production of rare earth products, enhancing competitive advantage.
Argentina Rare Earth & Products Market - Key Attractiveness of the Report
- 10 Years of Market Numbers
- Historical Data Starting from 2022 to 2025
- Base Year: 2025
- Forecast Data until 2032
- Key Performance Indicators Impacting the Market
- Major Upcoming Developments and Projects
Key Highlights of the Report:
- Argentina Rare Earth & Products Market Outlook
- Market Size of Argentina Rare Earth & Products Market, 2025
- Forecast of Argentina Rare Earth & Products Market, 2032F
- Historical Data and Forecast of Argentina Rare Earth & Products Revenues & Volume for the Period 2022-2032F
- Argentina Rare Earth & Products Market Trend Evolution
- Argentina Rare Earth & Products Market Drivers and Challenges
- Argentina Rare Earth & Products Price Trends
- Argentina Rare Earth & Products Porter's Five Forces
- Argentina Rare Earth & Products Industry Life Cycle
- Historical Data and Forecast of Argentina Rare Earth & Products Market Revenues & Volume By Product Types for the Period 2022-2032F
- Historical Data and Forecast of Argentina Rare Earth & Products Market Revenues & Volume By Cerium for the Period 2022-2032F
- Historical Data and Forecast of Argentina Rare Earth & Products Market Revenues & Volume By Dysprosium for the Period 2022-2032F
- Historical Data and Forecast of Argentina Rare Earth & Products Market Revenues & Volume By Erbium for the Period 2022-2032F
- Historical Data and Forecast of Argentina Rare Earth & Products Market Revenues & Volume By Europium for the Period 2022-2032F
- Historical Data and Forecast of Argentina Rare Earth & Products Market Revenues & Volume By Gadolinium for the Period 2022-2032F
- Historical Data and Forecast of Argentina Rare Earth & Products Market Revenues & Volume By Holmium for the Period 2022-2032F
- Historical Data and Forecast of Argentina Rare Earth & Products Market Revenues & Volume By Lanthanum for the Period 2022-2032F
- Historical Data and Forecast of Argentina Cerium Rare Earth & Products Market Revenues & Volume By Others for the Period 2022-2032F
- Historical Data and Forecast of Argentina Rare Earth & Products Market Revenues & Volume By Applications for the Period 2022-2032F
- Historical Data and Forecast of Argentina Rare Earth & Products Market Revenues & Volume By Magnets for the Period 2022-2032F
- Historical Data and Forecast of Argentina Rare Earth & Products Market Revenues & Volume By Catalysts for the Period 2022-2032F
- Historical Data and Forecast of Argentina Rare Earth & Products Market Revenues & Volume By Metallurgy for the Period 2022-2032F
- Historical Data and Forecast of Argentina Rare Earth & Products Market Revenues & Volume By Polishing for the Period 2022-2032F
- Historical Data and Forecast of Argentina Rare Earth & Products Market Revenues & Volume By Glass for the Period 2022-2032F
- Historical Data and Forecast of Argentina Rare Earth & Products Market Revenues & Volume By Phosphors for the Period 2022-2032F
- Historical Data and Forecast of Argentina Rare Earth & Products Market Revenues & Volume By Ceramics for the Period 2022-2032F
- Historical Data and Forecast of Argentina Rare Earth & Products Market Revenues & Volume By Others for the Period 2022-2032F
- Argentina Rare Earth & Products Import Export Trade Statistics
- Market Opportunity Assessment By Product Types
- Market Opportunity Assessment By Applications
- Argentina Rare Earth & Products Top Companies Market Share
- Argentina Rare Earth & Products Competitive Benchmarking By Technical and Operational Parameters
- Argentina Rare Earth & Products Company Profiles
- Argentina Rare Earth & Products Key Strategic Recommendations
Frequently Asked Questions About the Market Study (FAQs):
The Argentina Rare Earth & Products Market is projected to grow at a CAGR of 4.6% during the forecast period from 2026 to 2032.
Key industries driving demand include automotive, consumer electronics, and energy storage systems, all of which increasingly rely on rare earth products.
The market faces challenges such as trade policy uncertainty and stringent environmental regulations which could hinder growth.
The government is implementing policies that provide financial incentives, streamline regulations, and promote R&D initiatives aimed at enhancing local production capabilities.
6Wresearch actively monitors the Argentina Rare Earth & Products Market and publishes its comprehensive annual report, highlighting emerging trends, growth drivers, revenue analysis, and forecast outlook. Our insights help businesses to make data-backed strategic decisions with ongoing market dynamics. Our analysts track relevent industries related to the Argentina Rare Earth & Products Market, allowing our clients with actionable intelligence and reliable forecasts tailored to emerging regional needs.
Yes, we provide customisation as per your requirements. To learn more, feel free to contact us on sales@6wresearch.com
1 Executive Summary |
2 Introduction |
2.1 Key Highlights of the Report |
2.2 Report Description |
2.3 Market Scope & Segmentation |
2.4 Research Methodology |
2.5 Assumptions |
3 Argentina Rare Earth & Products Market Overview |
3.1 Argentina Country Macro Economic Indicators |
3.2 Argentina Rare Earth & Products Market Revenues & Volume, 2022 & 2032F |
3.3 Argentina Rare Earth & Products Market - Industry Life Cycle |
3.4 Argentina Rare Earth & Products Market - Porter's Five Forces |
3.5 Argentina Rare Earth & Products Market Revenues & Volume Share, By Product Types, 2022 & 2032F |
3.6 Argentina Rare Earth & Products Market Revenues & Volume Share, By Applications, 2022 & 2032F |
4 Argentina Rare Earth & Products Market Dynamics |
4.1 Impact Analysis |
4.2 Market Drivers |
4.3 Market Restraints |
5 Argentina Rare Earth & Products Market Trends |
6 Argentina Rare Earth & Products Market, By Types |
6.1 Argentina Rare Earth & Products Market, By Product Types |
6.1.1 Overview and Analysis |
6.1.2 Argentina Rare Earth & Products Market Revenues & Volume, By Product Types, 2022-2032F |
6.1.3 Argentina Rare Earth & Products Market Revenues & Volume, By Cerium, 2022-2032F |
6.1.4 Argentina Rare Earth & Products Market Revenues & Volume, By Dysprosium, 2022-2032F |
6.1.5 Argentina Rare Earth & Products Market Revenues & Volume, By Erbium, 2022-2032F |
6.1.6 Argentina Rare Earth & Products Market Revenues & Volume, By Europium, 2022-2032F |
6.1.7 Argentina Rare Earth & Products Market Revenues & Volume, By Gadolinium, 2022-2032F |
6.1.8 Argentina Rare Earth & Products Market Revenues & Volume, By Holmium, 2022-2032F |
6.1.9 Argentina Rare Earth & Products Market Revenues & Volume, By Others, 2022-2032F |
6.1.10 Argentina Rare Earth & Products Market Revenues & Volume, By Others, 2022-2032F |
6.2 Argentina Rare Earth & Products Market, By Applications |
6.2.1 Overview and Analysis |
6.2.2 Argentina Rare Earth & Products Market Revenues & Volume, By Magnets, 2022-2032F |
6.2.3 Argentina Rare Earth & Products Market Revenues & Volume, By Catalysts, 2022-2032F |
6.2.4 Argentina Rare Earth & Products Market Revenues & Volume, By Metallurgy, 2022-2032F |
6.2.5 Argentina Rare Earth & Products Market Revenues & Volume, By Polishing, 2022-2032F |
6.2.6 Argentina Rare Earth & Products Market Revenues & Volume, By Glass, 2022-2032F |
6.2.7 Argentina Rare Earth & Products Market Revenues & Volume, By Phosphors, 2022-2032F |
6.2.8 Argentina Rare Earth & Products Market Revenues & Volume, By Others, 2022-2032F |
6.2.9 Argentina Rare Earth & Products Market Revenues & Volume, By Others, 2022-2032F |
7 Argentina Rare Earth & Products Market Import-Export Trade Statistics |
7.1 Argentina Rare Earth & Products Market Export to Major Countries |
7.2 Argentina Rare Earth & Products Market Imports from Major Countries |
8 Argentina Rare Earth & Products Market Key Performance Indicators |
9 Argentina Rare Earth & Products Market - Opportunity Assessment |
9.1 Argentina Rare Earth & Products Market Opportunity Assessment, By Product Types, 2022 & 2032F |
9.2 Argentina Rare Earth & Products Market Opportunity Assessment, By Applications, 2022 & 2032F |
10 Argentina Rare Earth & Products Market - Competitive Landscape |
10.1 Argentina Rare Earth & Products Market Revenue Share, By Companies, 2025 |
10.2 Argentina Rare Earth & Products Market Competitive Benchmarking, By Operating and Technical Parameters |
11 Company Profiles |
12 Recommendations |
13 Disclaimer |
Global Go To Market Strategy - 2030
Export potential enables firms to identify high-growth global markets with greater confidence by combining advanced trade intelligence with a structured quantitative methodology. The framework analyzes emerging demand trends and country-level import patterns while integrating macroeconomic and trade datasets such as GDP and population forecasts, bilateral import–export flows, tariff structures, elasticity differentials between developed and developing economies, geographic distance, and import demand projections. Using weighted trade values from 2020–2024 as the base period to project country-to-country export potential for 2030, these inputs are operationalized through calculated drivers such as gravity model parameters, tariff impact factors, and projected GDP per-capita growth. Through an analysis of hidden potentials, demand hotspots, and market conditions that are most favorable to success, this method enables firms to focus on target countries, maximize returns, and global expansion with data, backed by accuracy.
By factoring in the projected importer demand gap that is currently unmet and could be potential opportunity, it identifies the potential for the Exporter (Country) among 190 countries, against the general trade analysis, which identifies the biggest importer or exporter.
To discover high-growth global markets and optimize your business strategy:
Click Here
Pricing
- Single User License$ 1,995
- Department License$ 2,400
- Site License$ 3,120
- Global License$ 3,795

Leadership Perspectives from Industry Events
Search
Thought Leadership and Analyst Meet


Our Clients
6WResearch In News
- India Air Conditioner Market Set for Strong Rebound in 2026 After Weather-Led Correction and GST-Driven Recovery: 6Wresearch
- ADAS in India: How Automatic Emergency Braking, Blind Spot Detection & Driver Monitoring are Transforming Road Safety
- Doha a strategic location for EV manufacturing hub: IPA Qatar
- Demand for luxury TVs surging in the GCC, says Samsung
- Empowering Growth: The Thriving Journey of Bangladesh’s Cable Industry
- Demand for luxury TVs surging in the GCC, says Samsung
Latest Reports
- Nicaragua RPG Gaming Market (2026-2032)
- New Zealand RPG Gaming Market (2026-2032)
- Netherlands RPG Gaming Market (2026-2032)
- Nauru RPG Gaming Market (2026-2032)
- Namibia RPG Gaming Market (2026-2032)
- Mozambique RPG Gaming Market (2026-2032)
- Montenegro RPG Gaming Market (2026-2032)
- Mongolia RPG Gaming Market (2026-2032)
- Monaco RPG Gaming Market (2026-2032)
- Micronesia RPG Gaming Market (2026-2032)
Industry Events and Analyst Meet

EV India Expo 2026

HIMTEX 2026

India Refining Summit 2026

India EV Show 2026

EV tech India Expo 2026
Whitepaper
- Middle East & Africa Commercial Security Market Click here to view more.
- Middle East & Africa Fire Safety Systems & Equipment Market Click here to view more.
- GCC Drone Market Click here to view more.
- Middle East Lighting Fixture Market Click here to view more.
- GCC Physical & Perimeter Security Market Click here to view more.