Argentina Transportation Composites Market (2026-2032) Outlook | Share, Companies, Value, Analysis, Size, Forecast, Industry, Revenue, Growth & Trends
Market Forecast By Resin (Thermoplastic , Thermoset), By Application (Interior, Exterior), By Transportation Type (Airways, Roadways, Railways, Waterways), By Manufacturing Process (Compression Molding, Injection Molding, Resin Transfer Molding, Others), By Fiber (Glass, Carbon, Natural, Others) And Competitive Landscape
| Product Code: ETC4499946 | Publication Date: Jul 2023 | Updated Date: Mar 2026 | Product Type: Report | |
| Publisher: 6Wresearch | Author: Dhaval Chaurasia | No. of Pages: 85 | No. of Figures: 45 | No. of Tables: 25 |
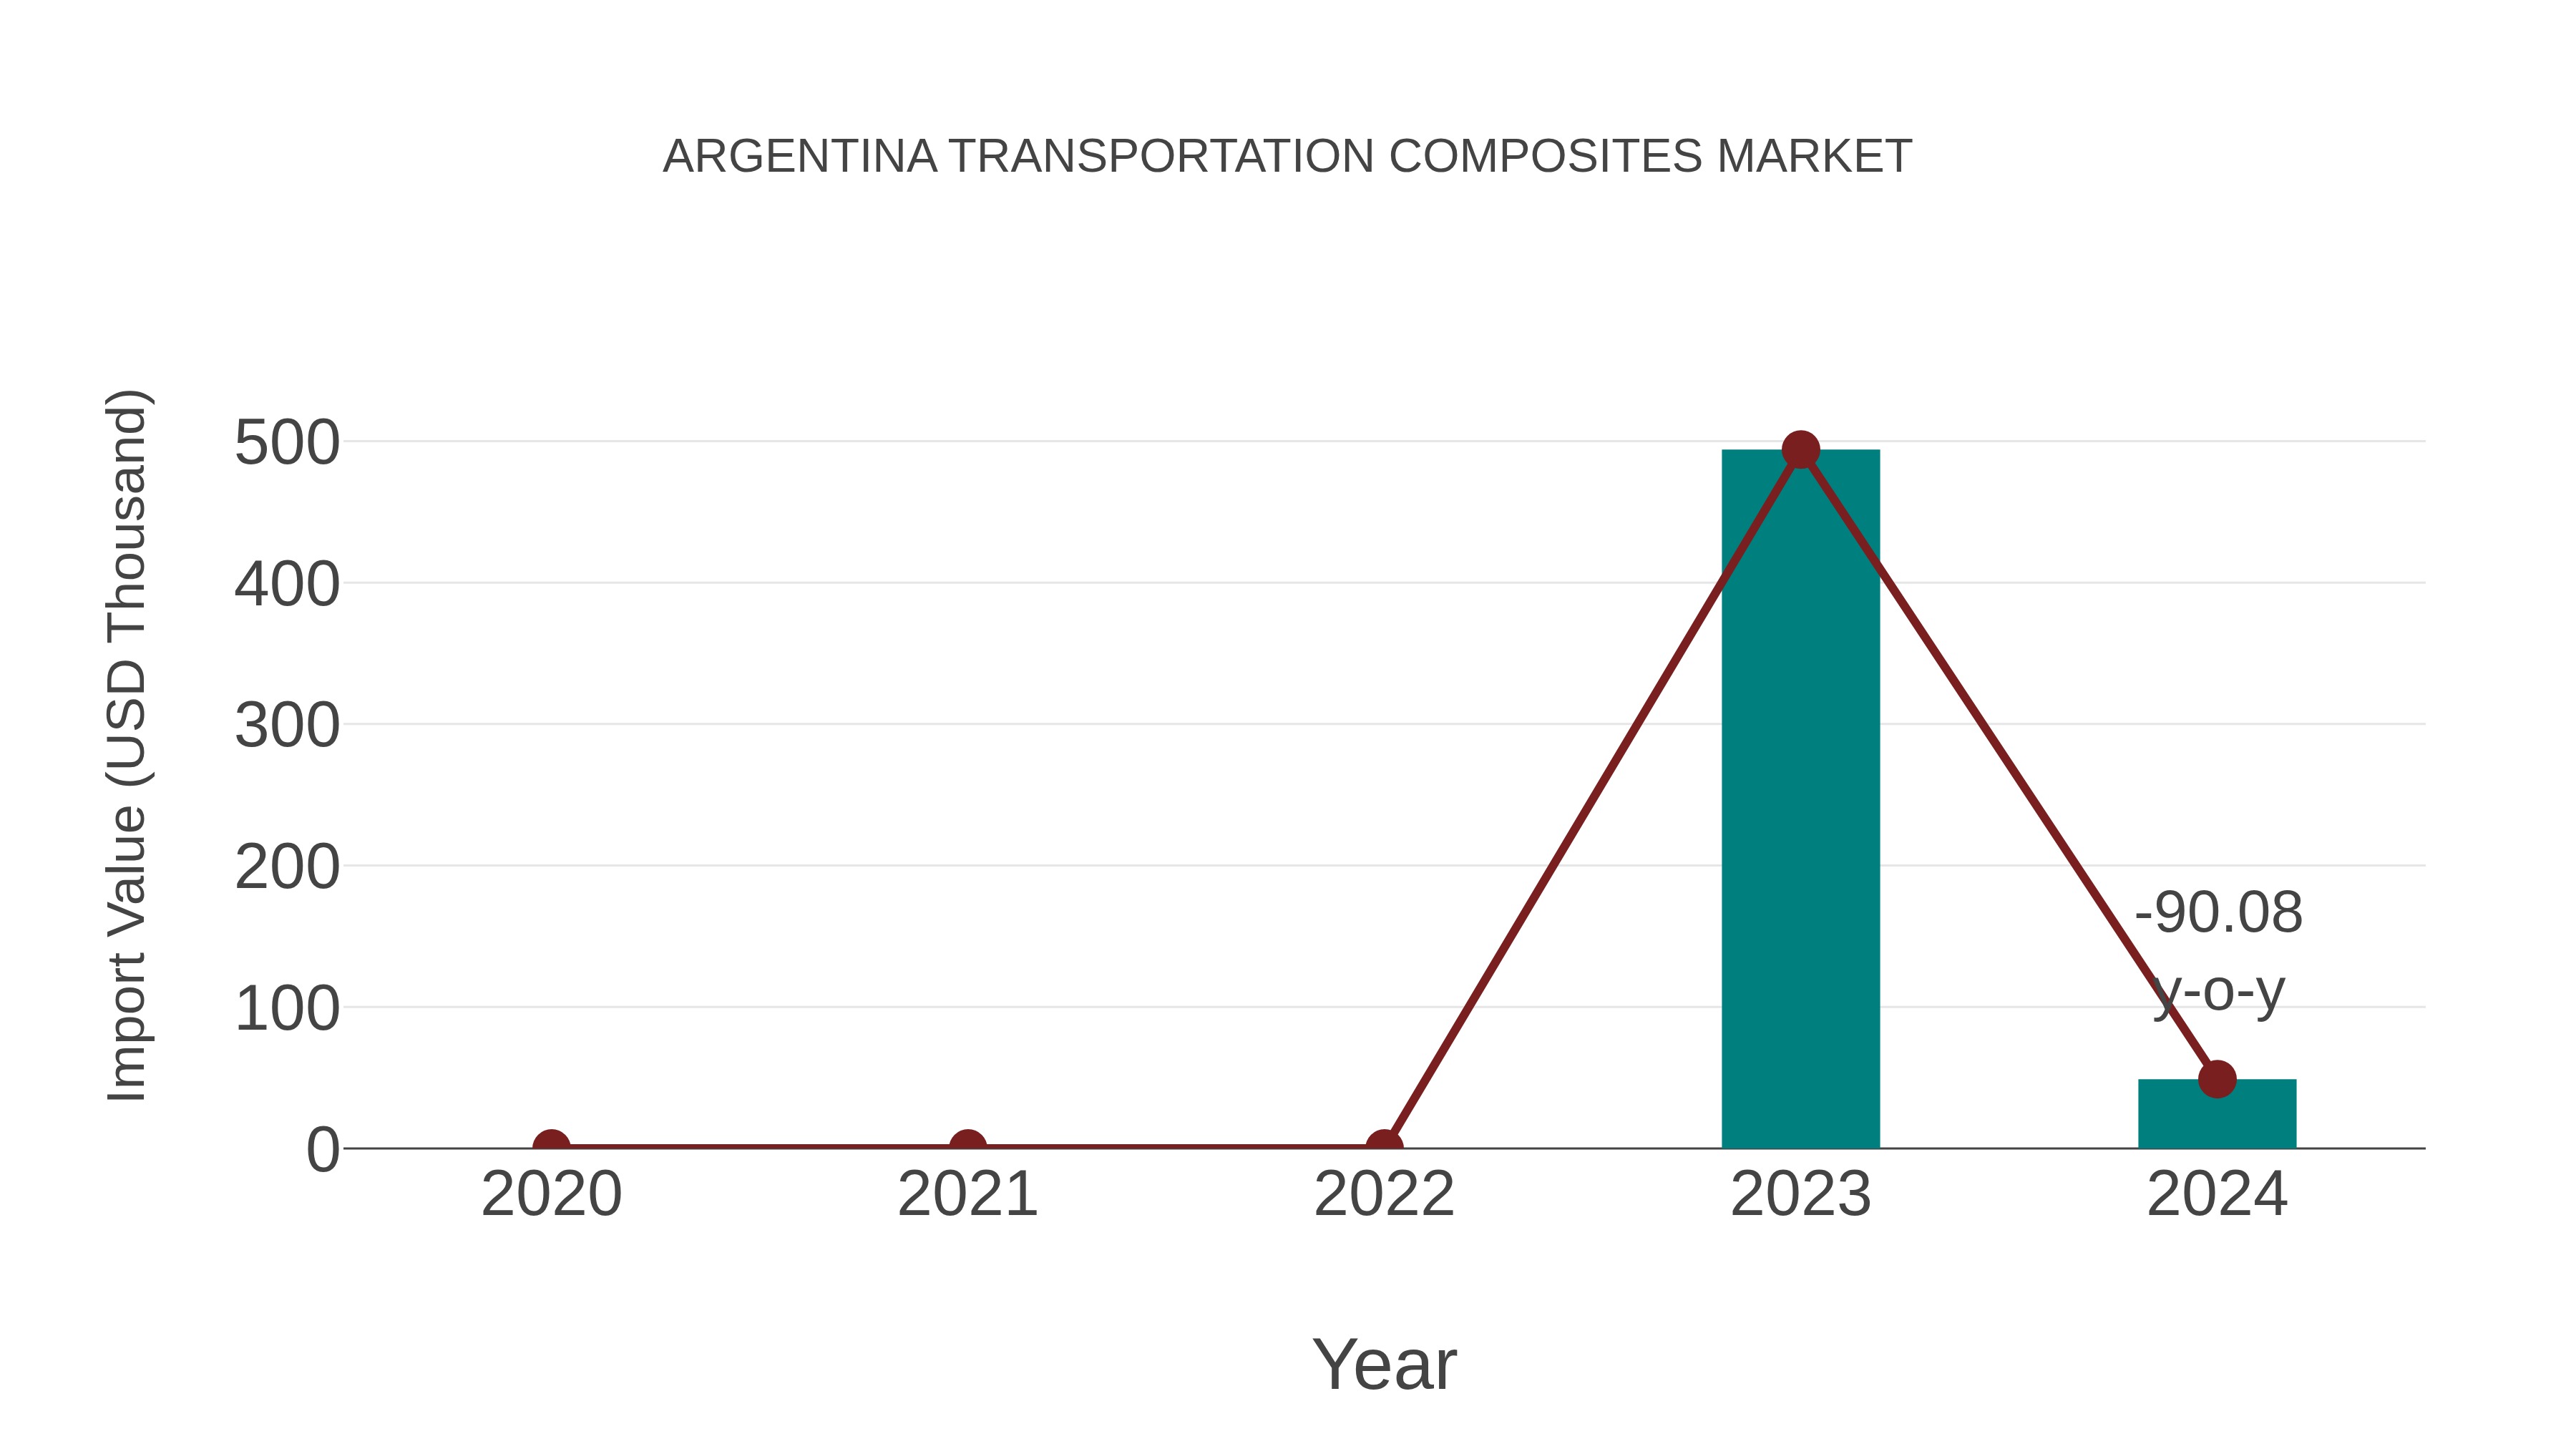
Argentina Transportation Composites Market: Import Trend Analysis
The Argentina transportation composites market witnessed a significant decline in imports from 2020 to 2024, with a Compound Annual Growth Rate (CAGR) of -90.08%. This decline was particularly notable in 2023-2024, where the year-on-year growth rate also stood at -90.08%. These figures indicate a consistent downward trend in imports of transportation composites during the specified period.
Argentina Transportation Composites Market Synopsis
The transportation composites market in Argentina provides composite materials for manufacturing lightweight and fuel-efficient vehicles, aircraft, and marine vessels. With the focus on sustainability and emissions reduction in transportation, the transportation composites market offers solutions for improving vehicle performance and environmental impact.
Drivers of the market
The transportation composites market in Argentina is propelled by factors such as lightweighting trends, fuel efficiency requirements, and emission reduction initiatives. Transportation composites, including carbon fiber-reinforced plastics (CFRP) and glass fiber-reinforced plastics (GFRP), offer strength-to-weight ratio advantages for automotive, aerospace, and marine applications. With Argentina automotive industry seeking lightweight materials for vehicle design and regulatory pressures for cleaner transportation solutions, the demand for transportation composites for lightweight and fuel-efficient vehicles is expected to rise.
Challenges of the market
Regulatory compliance and material innovation present challenges for the transportation composites market in Argentina. Additionally, addressing manufacturing scalability and cost competitiveness while meeting performance requirements pose hurdles for composite manufacturers in this segment.
Government Policy of the market
Government policies promoting lightweight materials, fuel efficiency, and environmental sustainability drive the transportation composites market in Argentina. Regulations concerning vehicle emissions, fuel economy standards, and automotive safety requirements influence the adoption of composite materials for weight reduction, structural reinforcement, and performance enhancement in automotive, aerospace, and marine applications.
Key Highlights of the Report:
- Argentina Transportation Composites Market Outlook
- Market Size of Argentina Transportation Composites Market, 2025
- Forecast of Argentina Transportation Composites Market, 2032
- Historical Data and Forecast of Argentina Transportation Composites Revenues & Volume for the Period 2022-2032F
- Argentina Transportation Composites Market Trend Evolution
- Argentina Transportation Composites Market Drivers and Challenges
- Argentina Transportation Composites Price Trends
- Argentina Transportation Composites Porter's Five Forces
- Argentina Transportation Composites Industry Life Cycle
- Historical Data and Forecast of Argentina Transportation Composites Market Revenues & Volume By Resin for the Period 2022-2032F
- Historical Data and Forecast of Argentina Transportation Composites Market Revenues & Volume By Thermoplastic for the Period 2022-2032F
- Historical Data and Forecast of Argentina Transportation Composites Market Revenues & Volume By Thermoset for the Period 2022-2032F
- Historical Data and Forecast of Argentina Transportation Composites Market Revenues & Volume By Application for the Period 2022-2032F
- Historical Data and Forecast of Argentina Transportation Composites Market Revenues & Volume By Interior for the Period 2022-2032F
- Historical Data and Forecast of Argentina Transportation Composites Market Revenues & Volume By Exterior for the Period 2022-2032F
- Historical Data and Forecast of Argentina Transportation Composites Market Revenues & Volume By Transportation Type for the Period 2022-2032F
- Historical Data and Forecast of Argentina Transportation Composites Market Revenues & Volume By Airways for the Period 2022-2032F
- Historical Data and Forecast of Argentina Transportation Composites Market Revenues & Volume By Roadways for the Period 2022-2032F
- Historical Data and Forecast of Argentina Transportation Composites Market Revenues & Volume By Railways for the Period 2022-2032F
- Historical Data and Forecast of Argentina Transportation Composites Market Revenues & Volume By Waterways for the Period 2022-2032F
- Historical Data and Forecast of Argentina Transportation Composites Market Revenues & Volume By Manufacturing Process for the Period 2022-2032F
- Historical Data and Forecast of Argentina Transportation Composites Market Revenues & Volume By Compression Molding for the Period 2022-2032F
- Historical Data and Forecast of Argentina Transportation Composites Market Revenues & Volume By Injection Molding for the Period 2022-2032F
- Historical Data and Forecast of Argentina Transportation Composites Market Revenues & Volume By Resin Transfer Molding for the Period 2022-2032F
- Historical Data and Forecast of Argentina Transportation Composites Market Revenues & Volume By Others for the Period 2022-2032F
- Historical Data and Forecast of Argentina Transportation Composites Market Revenues & Volume By Fiber for the Period 2022-2032F
- Historical Data and Forecast of Argentina Transportation Composites Market Revenues & Volume By Glass for the Period 2022-2032F
- Historical Data and Forecast of Argentina Transportation Composites Market Revenues & Volume By Carbon for the Period 2022-2032F
- Historical Data and Forecast of Argentina Transportation Composites Market Revenues & Volume By Natural for the Period 2022-2032F
- Historical Data and Forecast of Argentina Transportation Composites Market Revenues & Volume By Others for the Period 2022-2032F
- Argentina Transportation Composites Import Export Trade Statistics
- Market Opportunity Assessment By Resin
- Market Opportunity Assessment By Application
- Market Opportunity Assessment By Transportation Type
- Market Opportunity Assessment By Manufacturing Process
- Market Opportunity Assessment By Fiber
- Argentina Transportation Composites Top Companies Market Share
- Argentina Transportation Composites Competitive Benchmarking By Technical and Operational Parameters
- Argentina Transportation Composites Company Profiles
- Argentina Transportation Composites Key Strategic Recommendations
Argentina Transportation Composites Market (2026-2032): FAQs
6Wresearch actively monitors the Argentina Transportation Composites Market and publishes its comprehensive annual report, highlighting emerging trends, growth drivers, revenue analysis, and forecast outlook. Our insights help businesses to make data-backed strategic decisions with ongoing market dynamics. Our analysts track relevent industries related to the Argentina Transportation Composites Market, allowing our clients with actionable intelligence and reliable forecasts tailored to emerging regional needs.
Yes, we provide customisation as per your requirements. To learn more, feel free to contact us on sales@6wresearch.com
1 Executive Summary |
2 Introduction |
2.1 Key Highlights of the Report |
2.2 Report Description |
2.3 Market Scope & Segmentation |
2.4 Research Methodology |
2.5 Assumptions |
3 Argentina Transportation Composites Market Overview |
3.1 Argentina Country Macro Economic Indicators |
3.2 Argentina Transportation Composites Market Revenues & Volume, 2022 & 2032F |
3.3 Argentina Transportation Composites Market - Industry Life Cycle |
3.4 Argentina Transportation Composites Market - Porter's Five Forces |
3.5 Argentina Transportation Composites Market Revenues & Volume Share, By Resin, 2022 & 2032F |
3.6 Argentina Transportation Composites Market Revenues & Volume Share, By Application, 2022 & 2032F |
3.7 Argentina Transportation Composites Market Revenues & Volume Share, By Transportation Type, 2022 & 2032F |
3.8 Argentina Transportation Composites Market Revenues & Volume Share, By Manufacturing Process, 2022 & 2032F |
3.9 Argentina Transportation Composites Market Revenues & Volume Share, By Fiber, 2022 & 2032F |
4 Argentina Transportation Composites Market Dynamics |
4.1 Impact Analysis |
4.2 Market Drivers |
4.2.1 Growing demand for lightweight and fuel-efficient vehicles in Argentina |
4.2.2 Increasing focus on environmental sustainability and reducing carbon emissions in transportation sector |
4.2.3 Technological advancements in composite materials leading to improved performance and durability |
4.3 Market Restraints |
4.3.1 High initial investment costs associated with manufacturing and implementing transportation composites |
4.3.2 Limited awareness and understanding of the benefits of composites in the transportation sector |
4.3.3 Challenges in sourcing raw materials and skilled labor for composite production |
5 Argentina Transportation Composites Market Trends |
6 Argentina Transportation Composites Market, By Types |
6.1 Argentina Transportation Composites Market, By Resin |
6.1.1 Overview and Analysis |
6.1.2 Argentina Transportation Composites Market Revenues & Volume, By Resin, 2022-2032F |
6.1.3 Argentina Transportation Composites Market Revenues & Volume, By Thermoplastic , 2022-2032F |
6.1.4 Argentina Transportation Composites Market Revenues & Volume, By Thermoset, 2022-2032F |
6.2 Argentina Transportation Composites Market, By Application |
6.2.1 Overview and Analysis |
6.2.2 Argentina Transportation Composites Market Revenues & Volume, By Interior, 2022-2032F |
6.2.3 Argentina Transportation Composites Market Revenues & Volume, By Exterior, 2022-2032F |
6.3 Argentina Transportation Composites Market, By Transportation Type |
6.3.1 Overview and Analysis |
6.3.2 Argentina Transportation Composites Market Revenues & Volume, By Airways, 2022-2032F |
6.3.3 Argentina Transportation Composites Market Revenues & Volume, By Roadways, 2022-2032F |
6.3.4 Argentina Transportation Composites Market Revenues & Volume, By Railways, 2022-2032F |
6.3.5 Argentina Transportation Composites Market Revenues & Volume, By Waterways, 2022-2032F |
6.4 Argentina Transportation Composites Market, By Manufacturing Process |
6.4.1 Overview and Analysis |
6.4.2 Argentina Transportation Composites Market Revenues & Volume, By Compression Molding, 2022-2032F |
6.4.3 Argentina Transportation Composites Market Revenues & Volume, By Injection Molding, 2022-2032F |
6.4.4 Argentina Transportation Composites Market Revenues & Volume, By Resin Transfer Molding, 2022-2032F |
6.4.5 Argentina Transportation Composites Market Revenues & Volume, By Others, 2022-2032F |
6.5 Argentina Transportation Composites Market, By Fiber |
6.5.1 Overview and Analysis |
6.5.2 Argentina Transportation Composites Market Revenues & Volume, By Glass, 2022-2032F |
6.5.3 Argentina Transportation Composites Market Revenues & Volume, By Carbon, 2022-2032F |
6.5.4 Argentina Transportation Composites Market Revenues & Volume, By Natural, 2022-2032F |
6.5.5 Argentina Transportation Composites Market Revenues & Volume, By Others, 2022-2032F |
7 Argentina Transportation Composites Market Import-Export Trade Statistics |
7.1 Argentina Transportation Composites Market Export to Major Countries |
7.2 Argentina Transportation Composites Market Imports from Major Countries |
8 Argentina Transportation Composites Market Key Performance Indicators |
8.1 Adoption rate of composite materials in the transportation sector |
8.2 Number of research and development projects focused on enhancing transportation composites |
8.3 Percentage increase in the use of composites in new vehicle designs |
8.4 Average lifespan and maintenance cost comparison between vehicles using composites and traditional materials |
8.5 Environmental impact assessment of transportation composites compared to conventional materials |
9 Argentina Transportation Composites Market - Opportunity Assessment |
9.1 Argentina Transportation Composites Market Opportunity Assessment, By Resin, 2022 & 2032F |
9.2 Argentina Transportation Composites Market Opportunity Assessment, By Application, 2022 & 2032F |
9.3 Argentina Transportation Composites Market Opportunity Assessment, By Transportation Type, 2022 & 2032F |
9.4 Argentina Transportation Composites Market Opportunity Assessment, By Manufacturing Process, 2022 & 2032F |
9.5 Argentina Transportation Composites Market Opportunity Assessment, By Fiber, 2022 & 2032F |
10 Argentina Transportation Composites Market - Competitive Landscape |
10.1 Argentina Transportation Composites Market Revenue Share, By Companies, 2025 |
10.2 Argentina Transportation Composites Market Competitive Benchmarking, By Operating and Technical Parameters |
11 Company Profiles |
12 Recommendations |
13 Disclaimer |
Global Go To Market Strategy - 2030
Export potential enables firms to identify high-growth global markets with greater confidence by combining advanced trade intelligence with a structured quantitative methodology. The framework analyzes emerging demand trends and country-level import patterns while integrating macroeconomic and trade datasets such as GDP and population forecasts, bilateral import–export flows, tariff structures, elasticity differentials between developed and developing economies, geographic distance, and import demand projections. Using weighted trade values from 2020–2024 as the base period to project country-to-country export potential for 2030, these inputs are operationalized through calculated drivers such as gravity model parameters, tariff impact factors, and projected GDP per-capita growth. Through an analysis of hidden potentials, demand hotspots, and market conditions that are most favorable to success, this method enables firms to focus on target countries, maximize returns, and global expansion with data, backed by accuracy.
By factoring in the projected importer demand gap that is currently unmet and could be potential opportunity, it identifies the potential for the Exporter (Country) among 190 countries, against the general trade analysis, which identifies the biggest importer or exporter.
To discover high-growth global markets and optimize your business strategy:
Click Here
Pricing
- Single User License$ 1,995
- Department License$ 2,400
- Site License$ 3,120
- Global License$ 3,795

Leadership Perspectives from Industry Events
Search
Thought Leadership and Analyst Meet


Our Clients
6WResearch In News
- India Export Attractiveness Tracker 2026
- India Air Conditioner Market Set for Strong Rebound in 2026 After Weather-Led Correction and GST-Driven Recovery: 6Wresearch
- ADAS in India: How Automatic Emergency Braking, Blind Spot Detection & Driver Monitoring are Transforming Road Safety
- Doha a strategic location for EV manufacturing hub: IPA Qatar
- Demand for luxury TVs surging in the GCC, says Samsung
- Empowering Growth: The Thriving Journey of Bangladesh’s Cable Industry
Latest Reports
- Nicaragua RPG Gaming Market (2026-2032)
- New Zealand RPG Gaming Market (2026-2032)
- Netherlands RPG Gaming Market (2026-2032)
- Nauru RPG Gaming Market (2026-2032)
- Namibia RPG Gaming Market (2026-2032)
- Mozambique RPG Gaming Market (2026-2032)
- Montenegro RPG Gaming Market (2026-2032)
- Mongolia RPG Gaming Market (2026-2032)
- Monaco RPG Gaming Market (2026-2032)
- Micronesia RPG Gaming Market (2026-2032)
Industry Events and Analyst Meet

EV India Expo 2026

HIMTEX 2026

India Refining Summit 2026

India EV Show 2026

EV tech India Expo 2026
Whitepaper
- Middle East & Africa Commercial Security Market Click here to view more.
- Middle East & Africa Fire Safety Systems & Equipment Market Click here to view more.
- GCC Drone Market Click here to view more.
- Middle East Lighting Fixture Market Click here to view more.
- GCC Physical & Perimeter Security Market Click here to view more.