Australia Armored Vehicles Market (2026-2032) | Industry, Companies, Analysis, Trends, Value, COVID-19 IMPACT, Share, Growth, Forecast, Size & Revenue
Market Forecast By Platform (Combat Vehicles, Combat Support Vehicles, Unmanned Armored Ground Vehicles), By Mobility (Wheeled, Tracked), By System (Engine, Drive Systems, Ballistic Armor, C2 Systems, Mode of Operation) And Competitive Landscape
| Product Code: ETC173814 | Publication Date: Jan 2022 | Updated Date: Jun 2026 | Product Type: Market Research Report | |
| Publisher: 6Wresearch | Author: Ravi Bhandari | No. of Pages: 70 | No. of Figures: 35 | No. of Tables: 5 |
Australia Armored Vehicles Market Size, Share & Growth Rate
The Australia Armored Vehicles Market was estimated at USD 187 Million in 2025 and is projected to reach USD 220 Million by 2032, growing at a CAGR of 2.3% from 2026 to 2032. This growth trajectory is driven largely by increasing defense spending, as Australia continues to enhance its national security posture amidst evolving regional threats. Moreover, advancements in vehicle protection technologies and the demand for versatile, high-performance military vehicles are shaping the investment landscape within this sector.
Australia Armored Vehicles Market Year-wise Growth Rate and Key Drivers
This graph highlights how the Australia Armored Vehicles Market has steadily grown over the years, supported by major growth factors.
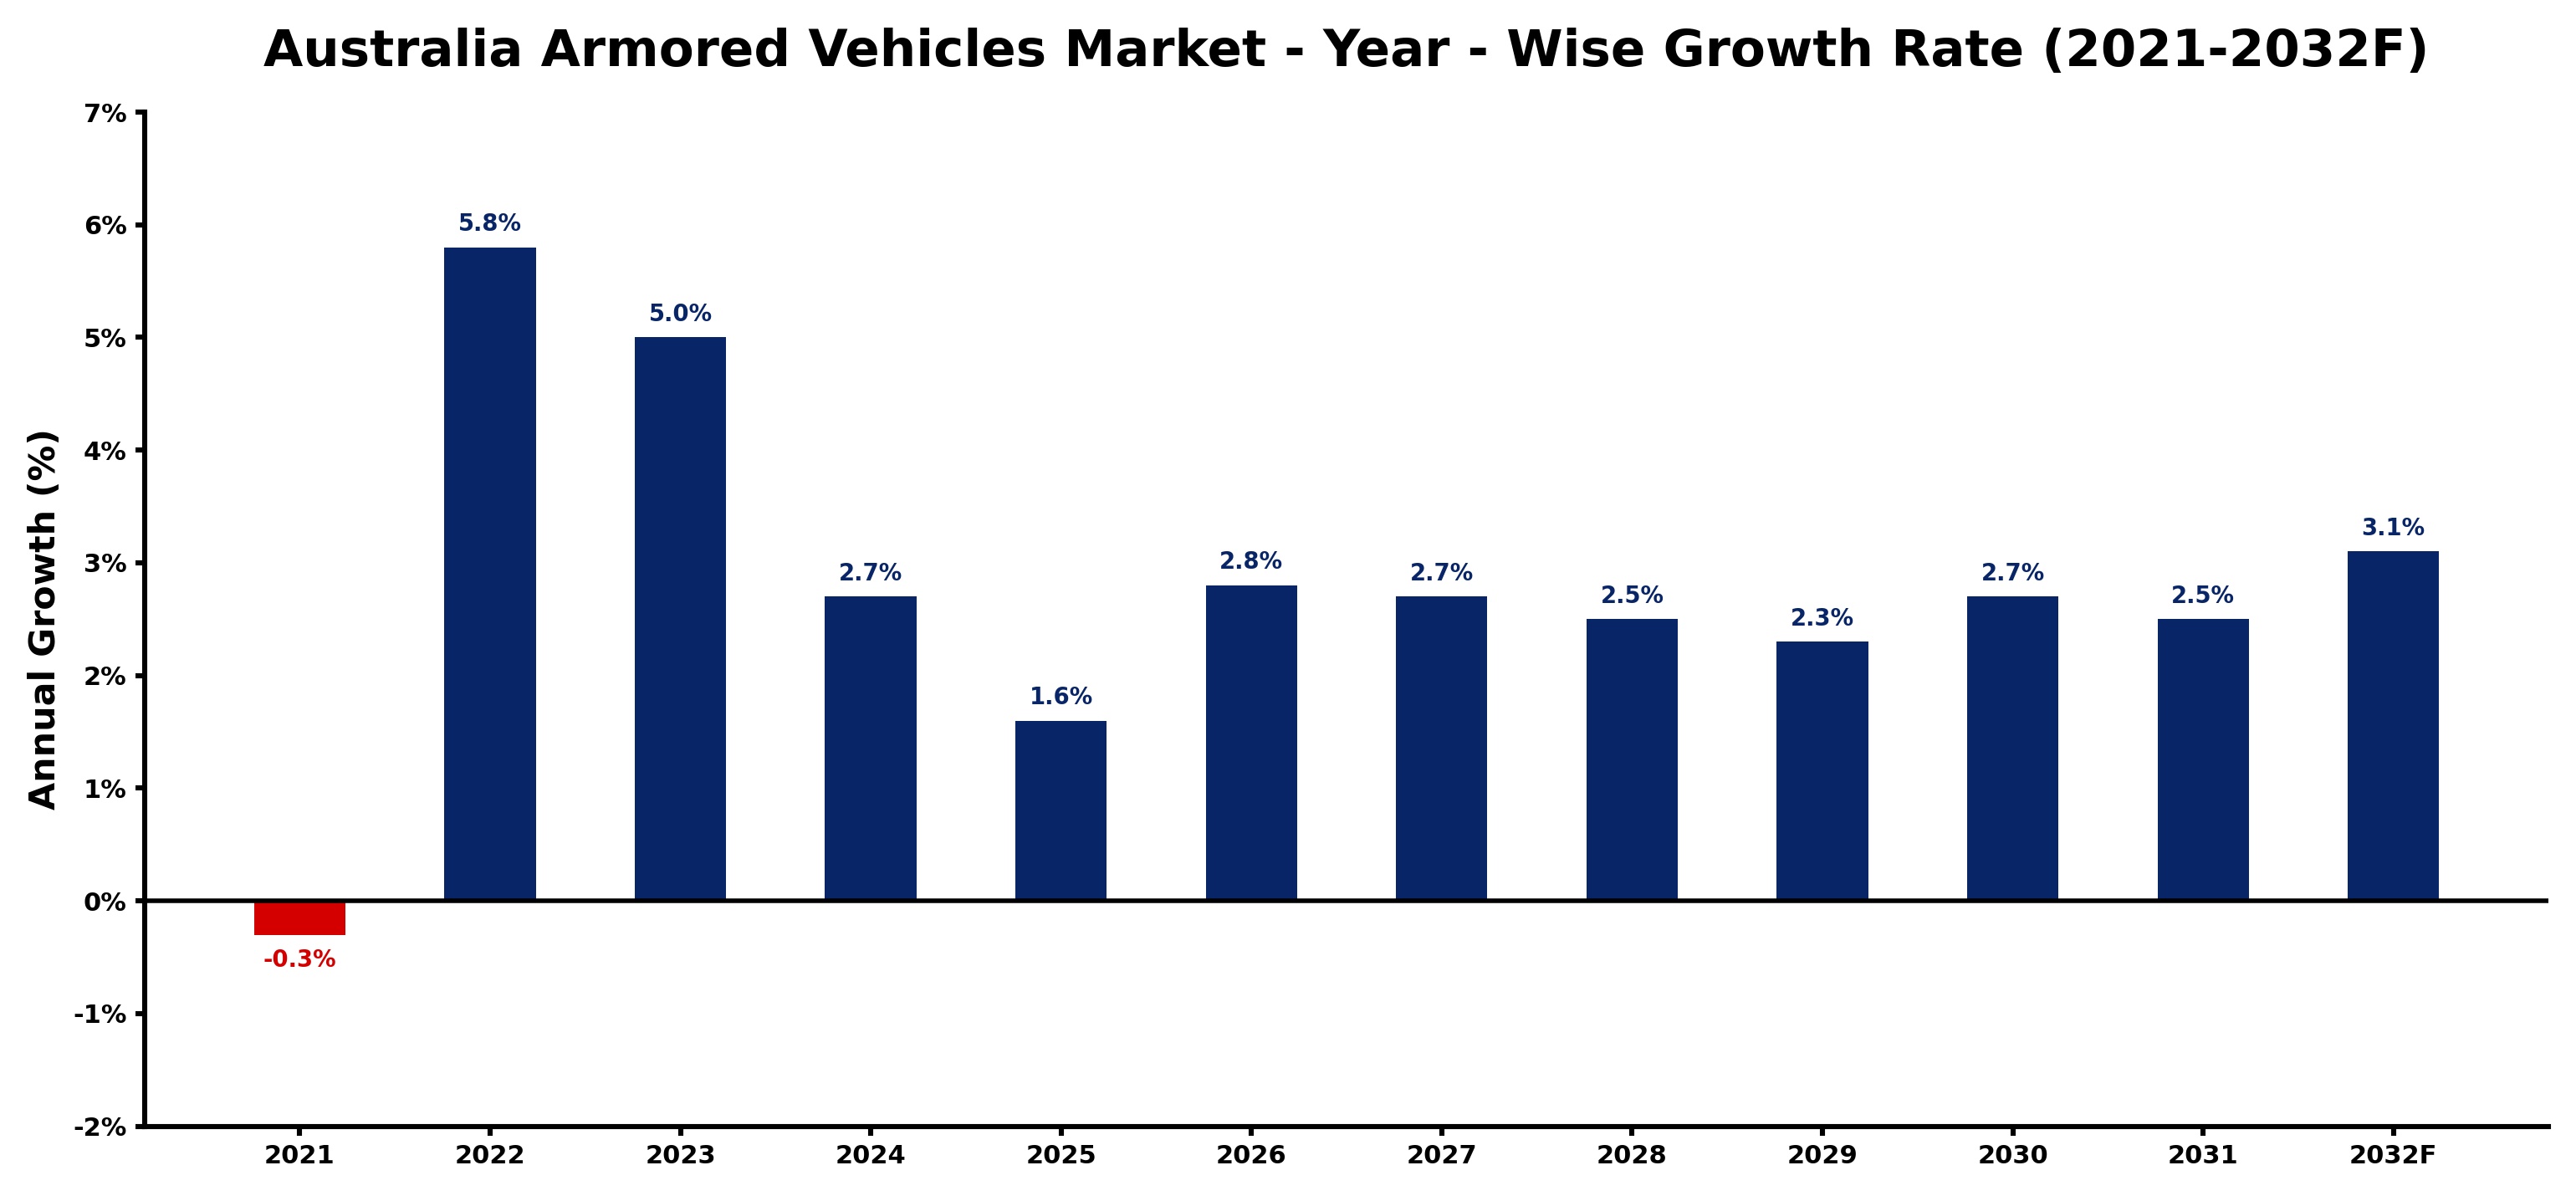
The table below presents the year‑wise growth rates along with the key drivers influencing the market
| Year | Growth Rate | Major Drivers |
| 2021 | -0.3% | Defense budget constraints limited procurement |
| 2022 | 5.8% | Increased defense spending stimulated growth |
| 2023 | 5.0% | Technological advancements enhanced capabilities |
| 2024 | 2.7% | Strategic partnerships expanded market reach |
| 2025 | 1.6% | Rising geopolitical tensions drove demand |
| 2026 | 2.8% | Industrial activity supported growth |
| 2027 | 2.7% | Military modernization programs increased orders |
| 2028 | 2.5% | Export opportunities boosted production capacity |
| 2029 | 2.3% | Enhanced training programs improved effectiveness |
| 2030 | 2.7% | Sustainability initiatives gained traction |
| 2031 | 2.5% | Urban warfare strategies influenced designs |
| 2032 | 3.1% | Collaborative defense projects fostered innovation |
Note - Market size estimations and growth projections presented in this report are based on 6Wresearch’s advanced forecasting approach, validated with industry datasets as of June 2026.
Australia Armored Vehicles Market Synopsis
In recent years, the Australia Armored Vehicles Market has witnessed significant changes due to an escalation in defense initiatives and evolving security dynamics. The government's commitment to enhancing military capabilities has spurred investments in advanced armored vehicle technologies, aiming to fortify both mobility and protection.
As the landscape of global security continues to shift, there is a marked emphasis on modernization and adaptability in armored vehicles. This is evident in the focus on integrating cutting-edge materials and systems that enhance resilience against emerging threats, illustrating a robust market response to the needs of contemporary warfare.
Australia Armored Vehicles Market Key Takeaways
- The market is propelled by heightened defense expenditures and strategic initiatives addressing regional security challenges.
- Technological innovations in armor materials and vehicle systems play a pivotal role in market growth.
- Government policies are increasingly supporting domestic production and R&D in armored vehicle technologies.
- Market dynamics are influenced by both global military trends and local procurement strategies.
- Investment in mobility and firepower remains essential to maintaining operational effectiveness for Australian defense forces.
Evaluation of Restraints in Australia Armored Vehicles Market
While the Australia Armored Vehicles Market shows promising growth, certain restraints are noteworthy. Budgetary constraints often impede the pace of procurement and modernization efforts. Shifting defense strategies, influenced by geopolitical developments, can also lead to uncertainty in long-term planning. Additionally, the intricate compliance requirements associated with safety and regulatory standards create further complexity in both manufacturing and acquisition processes, potentially stalling timely market responses.
Australia Armored Vehicles Market Trends
Current trends within the Australia Armored Vehicles Market highlight a strong emphasis on the development of next-generation vehicle protection systems. Innovations in lightweight armor materials are becoming increasingly critical, enhancing protection without compromising mobility. Furthermore, there is a growing demand for multi-role vehicles capable of undertaking diverse mission profiles, which reflects a shift towards flexible and adaptive military capabilities.
Technological advancements, including the integration of autonomous systems and smart technologies in vehicle design, are reshaping operational strategies. This trend not only maximizes effectiveness on the battlefield but also aligns with global defense modernization efforts, ensuring that Australia remains competitive in a rapidly evolving military landscape.
Australia Armored Vehicles Market Opportunities
The Australian market offers significant opportunities for growth, particularly in the realm of indigenous production capabilities. By fostering local manufacturing initiatives, the country can enhance its self-reliance while simultaneously stimulating economic activity. Collaborations with technology innovators and defense contractors can also yield advancements that meet specific operational requirements, creating a competitive edge.
Investments in research and development are pivotal, particularly in areas such as advanced materials science and robotics. As the demand for enhanced protection and operational versatility continues to rise, companies that position themselves at the forefront of these innovations will find ample opportunity for expansion and profitability.
Government Initiatives in the Australia Armored Vehicles Market
The Australian government remains committed to strengthening national defense capabilities through strategic investments and policy frameworks. Emphasis on domestic production of armored vehicles is reflected in initiatives aimed at enhancing the local defense industry. Public spending on research and development in advanced armor technologies demonstrates a proactive approach to addressing emerging security challenges while ensuring long-term sustainability.
Policies that prioritize local procurement and support for innovation contribute to a robust ecosystem for armored vehicle manufacturers. These initiatives not only fortify national security but also bolster the overall competitiveness of the Australian defense sector in the global market.
Future Insights of the Australia Armored Vehicles Market
Looking towards 2026-2032, the Australia Armored Vehicles Market is poised for a transformative phase driven by continued technological evolution and shifting defense strategies. The demand for multi-capability platforms that can adapt to various operational environments will drive investment. Additionally, the integration of sustainable practices in vehicle production and the adoption of advanced materials will reshape the manufacturing landscape.
Overall, the market is expected to remain resilient, underpinned by strategic defense initiatives and a commitment to operational excellence. As Australia navigates complex geopolitical landscapes, the emphasis on innovation, collaboration, and local capabilities will be key to ensuring sustained growth and enhanced military readiness.
Australia Armored Vehicles Market Latest Developments (May 2025 - June 2026)
In recent months, the Australia Armored Vehicles Market has seen a heightened focus on integrating smart technologies and autonomous systems within vehicle designs. Such developments are anticipated to improve situational awareness and operational efficiency. Furthermore, collaborations between defense manufacturers and technology firms have intensified, aiming to leverage innovative solutions to enhance vehicle performance.
Additionally, the government has announced new initiatives to support the expansion of local manufacturing capabilities, signaling a strong commitment to self-sufficiency in defense production. These movements reflect a strategic approach to meet evolving security challenges while bolstering the domestic economy.
Australia Armored Vehicles Market - Key Attractiveness of the Report
- 10 Years of Market Numbers
- Historical Data Starting from 2022 to 2025
- Base Year: 2025
- Forecast Data until 2032
- Key Performance Indicators Impacting the Market
- Major Upcoming Developments and Projects
Key Highlights of the Report:
- Australia Armored Vehicles Market Outlook
- Market Size of Australia Armored Vehicles Market, 2025
- Forecast of Australia Armored Vehicles Market, 2032
- Historical Data and Forecast of Australia Armored Vehicles Revenues & Volume for the Period 2022-2032F
- Australia Armored Vehicles Market Trend Evolution
- Australia Armored Vehicles Market Drivers and Challenges
- Australia Armored Vehicles Price Trends
- Australia Armored Vehicles Porter's Five Forces
- Australia Armored Vehicles Industry Life Cycle
- Historical Data and Forecast of Australia Armored Vehicles Market Revenues & Volume By Platform for the Period 2022-2032F
- Historical Data and Forecast of Australia Armored Vehicles Market Revenues & Volume By Combat Vehicles for the Period 2022-2032F
- Historical Data and Forecast of Australia Armored Vehicles Market Revenues & Volume By Combat Support Vehicles for the Period 2022-2032F
- Historical Data and Forecast of Australia Armored Vehicles Market Revenues & Volume By Unmanned Armored Ground Vehicles for the Period 2022-2032F
- Historical Data and Forecast of Australia Armored Vehicles Market Revenues & Volume By Mobility for the Period 2022-2032F
- Historical Data and Forecast of Australia Armored Vehicles Market Revenues & Volume By Wheeled for the Period 2022-2032F
- Historical Data and Forecast of Australia Armored Vehicles Market Revenues & Volume By Tracked for the Period 2022-2032F
- Historical Data and Forecast of Australia Armored Vehicles Market Revenues & Volume By System for the Period 2022-2032F
- Historical Data and Forecast of Australia Armored Vehicles Market Revenues & Volume By Engine for the Period 2022-2032F
- Historical Data and Forecast of Australia Armored Vehicles Market Revenues & Volume By Drive Systems for the Period 2022-2032F
- Historical Data and Forecast of Australia Armored Vehicles Market Revenues & Volume By Ballistic Armor for the Period 2022-2032F
- Historical Data and Forecast of Australia Armored Vehicles Market Revenues & Volume By C2 Systems for the Period 2022-2032F
- Historical Data and Forecast of Australia Armored Vehicles Market Revenues & Volume By Mode of Operation for the Period 2022-2032F
- Australia Armored Vehicles Import Export Trade Statistics
- Market Opportunity Assessment By Platform
- Market Opportunity Assessment By Mobility
- Market Opportunity Assessment By System
- Australia Armored Vehicles Top Companies Market Share
- Australia Armored Vehicles Competitive Benchmarking By Technical and Operational Parameters
- Australia Armored Vehicles Company Profiles
- Australia Armored Vehicles Key Strategic Recommendations
Australia Armored Vehicles Market - Frequently Asked Questions
The primary drivers include increased defense spending, a focus on counter-terrorism and peacekeeping operations, and advancements in vehicle protection technologies, all of which are crucial in modern warfare.
The market was estimated at USD 187 Million in 2025 and is projected to reach USD 220 Million by 2032, growing at a CAGR of 2.3% from 2026 to 2032.
Manufacturers contend with budgetary limitations, the need for compliance with stringent safety standards, and the rapid pace of technological advancements, making it essential to adapt quickly.
Innovations in lightweight armor materials and the integration of autonomous systems are revolutionizing the operational capabilities of armored vehicles, enhancing protection and versatility.
Government policies that prioritize national security and support for local manufacturing initiatives are pivotal in shaping the market landscape, fostering innovation, and boosting the defense industry’s competitiveness.
6Wresearch actively monitors the Australia Armored Vehicles Market and publishes its comprehensive annual report, highlighting emerging trends, growth drivers, revenue analysis, and forecast outlook. Our insights help businesses to make data-backed strategic decisions with ongoing market dynamics. Our analysts track relevent industries related to the Australia Armored Vehicles Market, allowing our clients with actionable intelligence and reliable forecasts tailored to emerging regional needs.
Yes, we provide customisation as per your requirements. To learn more, feel free to contact us on sales@6wresearch.com
1 Executive Summary |
2 Introduction |
2.1 Key Highlights of the Report |
2.2 Report Description |
2.3 Market Scope & Segmentation |
2.4 Research Methodology |
2.5 Assumptions |
3 Australia Armored Vehicles Market Overview |
3.1 Australia Country Macro Economic Indicators |
3.2 Australia Armored Vehicles Market Revenues & Volume, 2022 & 2032F |
3.3 Australia Armored Vehicles Market - Industry Life Cycle |
3.4 Australia Armored Vehicles Market - Porter's Five Forces |
3.5 Australia Armored Vehicles Market Revenues & Volume Share, By Platform, 2022 & 2032F |
3.6 Australia Armored Vehicles Market Revenues & Volume Share, By Mobility, 2022 & 2032F |
3.7 Australia Armored Vehicles Market Revenues & Volume Share, By System, 2022 & 2032F |
4 Australia Armored Vehicles Market Dynamics |
4.1 Impact Analysis |
4.2 Market Drivers |
4.2.1 Increase in defense spending by the Australian government |
4.2.2 Rising demand for advanced armored vehicles due to regional security concerns |
4.2.3 Growing investments in modernizing defense capabilities |
4.3 Market Restraints |
4.3.1 High costs associated with the development and procurement of armored vehicles |
4.3.2 Technological challenges in integrating advanced features in armored vehicles |
4.3.3 Stringent regulations and compliance requirements in the defense sector |
5 Australia Armored Vehicles Market Trends |
6 Australia Armored Vehicles Market, By Types |
6.1 Australia Armored Vehicles Market, By Platform |
6.1.1 Overview and Analysis |
6.1.2 Australia Armored Vehicles Market Revenues & Volume, By Platform, 2022-2032F |
6.1.3 Australia Armored Vehicles Market Revenues & Volume, By Combat Vehicles, 2022-2032F |
6.1.4 Australia Armored Vehicles Market Revenues & Volume, By Combat Support Vehicles, 2022-2032F |
6.1.5 Australia Armored Vehicles Market Revenues & Volume, By Unmanned Armored Ground Vehicles, 2022-2032F |
6.2 Australia Armored Vehicles Market, By Mobility |
6.2.1 Overview and Analysis |
6.2.2 Australia Armored Vehicles Market Revenues & Volume, By Wheeled, 2022-2032F |
6.2.3 Australia Armored Vehicles Market Revenues & Volume, By Tracked, 2022-2032F |
6.3 Australia Armored Vehicles Market, By System |
6.3.1 Overview and Analysis |
6.3.2 Australia Armored Vehicles Market Revenues & Volume, By Engine, 2022-2032F |
6.3.3 Australia Armored Vehicles Market Revenues & Volume, By Drive Systems, 2022-2032F |
6.3.4 Australia Armored Vehicles Market Revenues & Volume, By Ballistic Armor, 2022-2032F |
6.3.5 Australia Armored Vehicles Market Revenues & Volume, By C2 Systems, 2022-2032F |
6.3.6 Australia Armored Vehicles Market Revenues & Volume, By Mode of Operation, 2022-2032F |
7 Australia Armored Vehicles Market Import-Export Trade Statistics |
7.1 Australia Armored Vehicles Market Export to Major Countries |
7.2 Australia Armored Vehicles Market Imports from Major Countries |
8 Australia Armored Vehicles Market Key Performance Indicators |
8.1 Number of defense contracts awarded for armored vehicle procurement |
8.2 Investment in research and development for armored vehicle technologies |
8.3 Adoption rate of new armored vehicle models in the Australian defense forces |
9 Australia Armored Vehicles Market - Opportunity Assessment |
9.1 Australia Armored Vehicles Market Opportunity Assessment, By Platform, 2022 & 2032F |
9.2 Australia Armored Vehicles Market Opportunity Assessment, By Mobility, 2022 & 2032F |
9.3 Australia Armored Vehicles Market Opportunity Assessment, By System, 2022 & 2032F |
10 Australia Armored Vehicles Market - Competitive Landscape |
10.1 Australia Armored Vehicles Market Revenue Share, By Companies, 2025 |
10.2 Australia Armored Vehicles Market Competitive Benchmarking, By Operating and Technical Parameters |
11 Company Profiles |
12 Recommendations |
13 Disclaimer |
Global Go To Market Strategy - 2030
Export potential enables firms to identify high-growth global markets with greater confidence by combining advanced trade intelligence with a structured quantitative methodology. The framework analyzes emerging demand trends and country-level import patterns while integrating macroeconomic and trade datasets such as GDP and population forecasts, bilateral import–export flows, tariff structures, elasticity differentials between developed and developing economies, geographic distance, and import demand projections. Using weighted trade values from 2020–2024 as the base period to project country-to-country export potential for 2030, these inputs are operationalized through calculated drivers such as gravity model parameters, tariff impact factors, and projected GDP per-capita growth. Through an analysis of hidden potentials, demand hotspots, and market conditions that are most favorable to success, this method enables firms to focus on target countries, maximize returns, and global expansion with data, backed by accuracy.
By factoring in the projected importer demand gap that is currently unmet and could be potential opportunity, it identifies the potential for the Exporter (Country) among 190 countries, against the general trade analysis, which identifies the biggest importer or exporter.
To discover high-growth global markets and optimize your business strategy:
Click Here
Pricing
- Single User License$ 1,995
- Department License$ 2,400
- Site License$ 3,120
- Global License$ 3,795

Leadership Perspectives from Industry Events
Search
Thought Leadership and Analyst Meet


Our Clients
6WResearch In News
- India Export Attractiveness Tracker 2026
- India Air Conditioner Market Set for Strong Rebound in 2026 After Weather-Led Correction and GST-Driven Recovery: 6Wresearch
- ADAS in India: How Automatic Emergency Braking, Blind Spot Detection & Driver Monitoring are Transforming Road Safety
- Doha a strategic location for EV manufacturing hub: IPA Qatar
- Demand for luxury TVs surging in the GCC, says Samsung
- Empowering Growth: The Thriving Journey of Bangladesh’s Cable Industry
Latest Reports
- Nicaragua RPG Gaming Market (2026-2032)
- New Zealand RPG Gaming Market (2026-2032)
- Netherlands RPG Gaming Market (2026-2032)
- Nauru RPG Gaming Market (2026-2032)
- Namibia RPG Gaming Market (2026-2032)
- Mozambique RPG Gaming Market (2026-2032)
- Montenegro RPG Gaming Market (2026-2032)
- Mongolia RPG Gaming Market (2026-2032)
- Monaco RPG Gaming Market (2026-2032)
- Micronesia RPG Gaming Market (2026-2032)
Industry Events and Analyst Meet

EV India Expo 2026

HIMTEX 2026

India Refining Summit 2026

India EV Show 2026

EV tech India Expo 2026
Whitepaper
- Middle East & Africa Commercial Security Market Click here to view more.
- Middle East & Africa Fire Safety Systems & Equipment Market Click here to view more.
- GCC Drone Market Click here to view more.
- Middle East Lighting Fixture Market Click here to view more.
- GCC Physical & Perimeter Security Market Click here to view more.