Australia Automotive Polycarbonate Glazing Market (2026-2032) | Segmentation, Size & Revenue, Trends, Competitive Landscape, Value, Industry, Share, Growth, Outlook, Companies, Analysis, Forecast
Market Forecast By Technology (Sun Control Glazing, Hydrophobic Glazing, Switchable Glazing, Conventional), By Application (Front Windshield, Backlite, Sidelite, Quarter glass, Panoramic roof/ Roof modules), By Sales Channel (OEM, Aftermarket), By Vehicle Type (Passenger Vehicle, Commercial Vehicle) And Competitive Landscape
| Product Code: ETC6174998 | Publication Date: Sep 2024 | Updated Date: Feb 2026 | Product Type: Market Research Report | |
| Publisher: 6Wresearch | Author: Vasudha | No. of Pages: 75 | No. of Figures: 35 | No. of Tables: 20 |
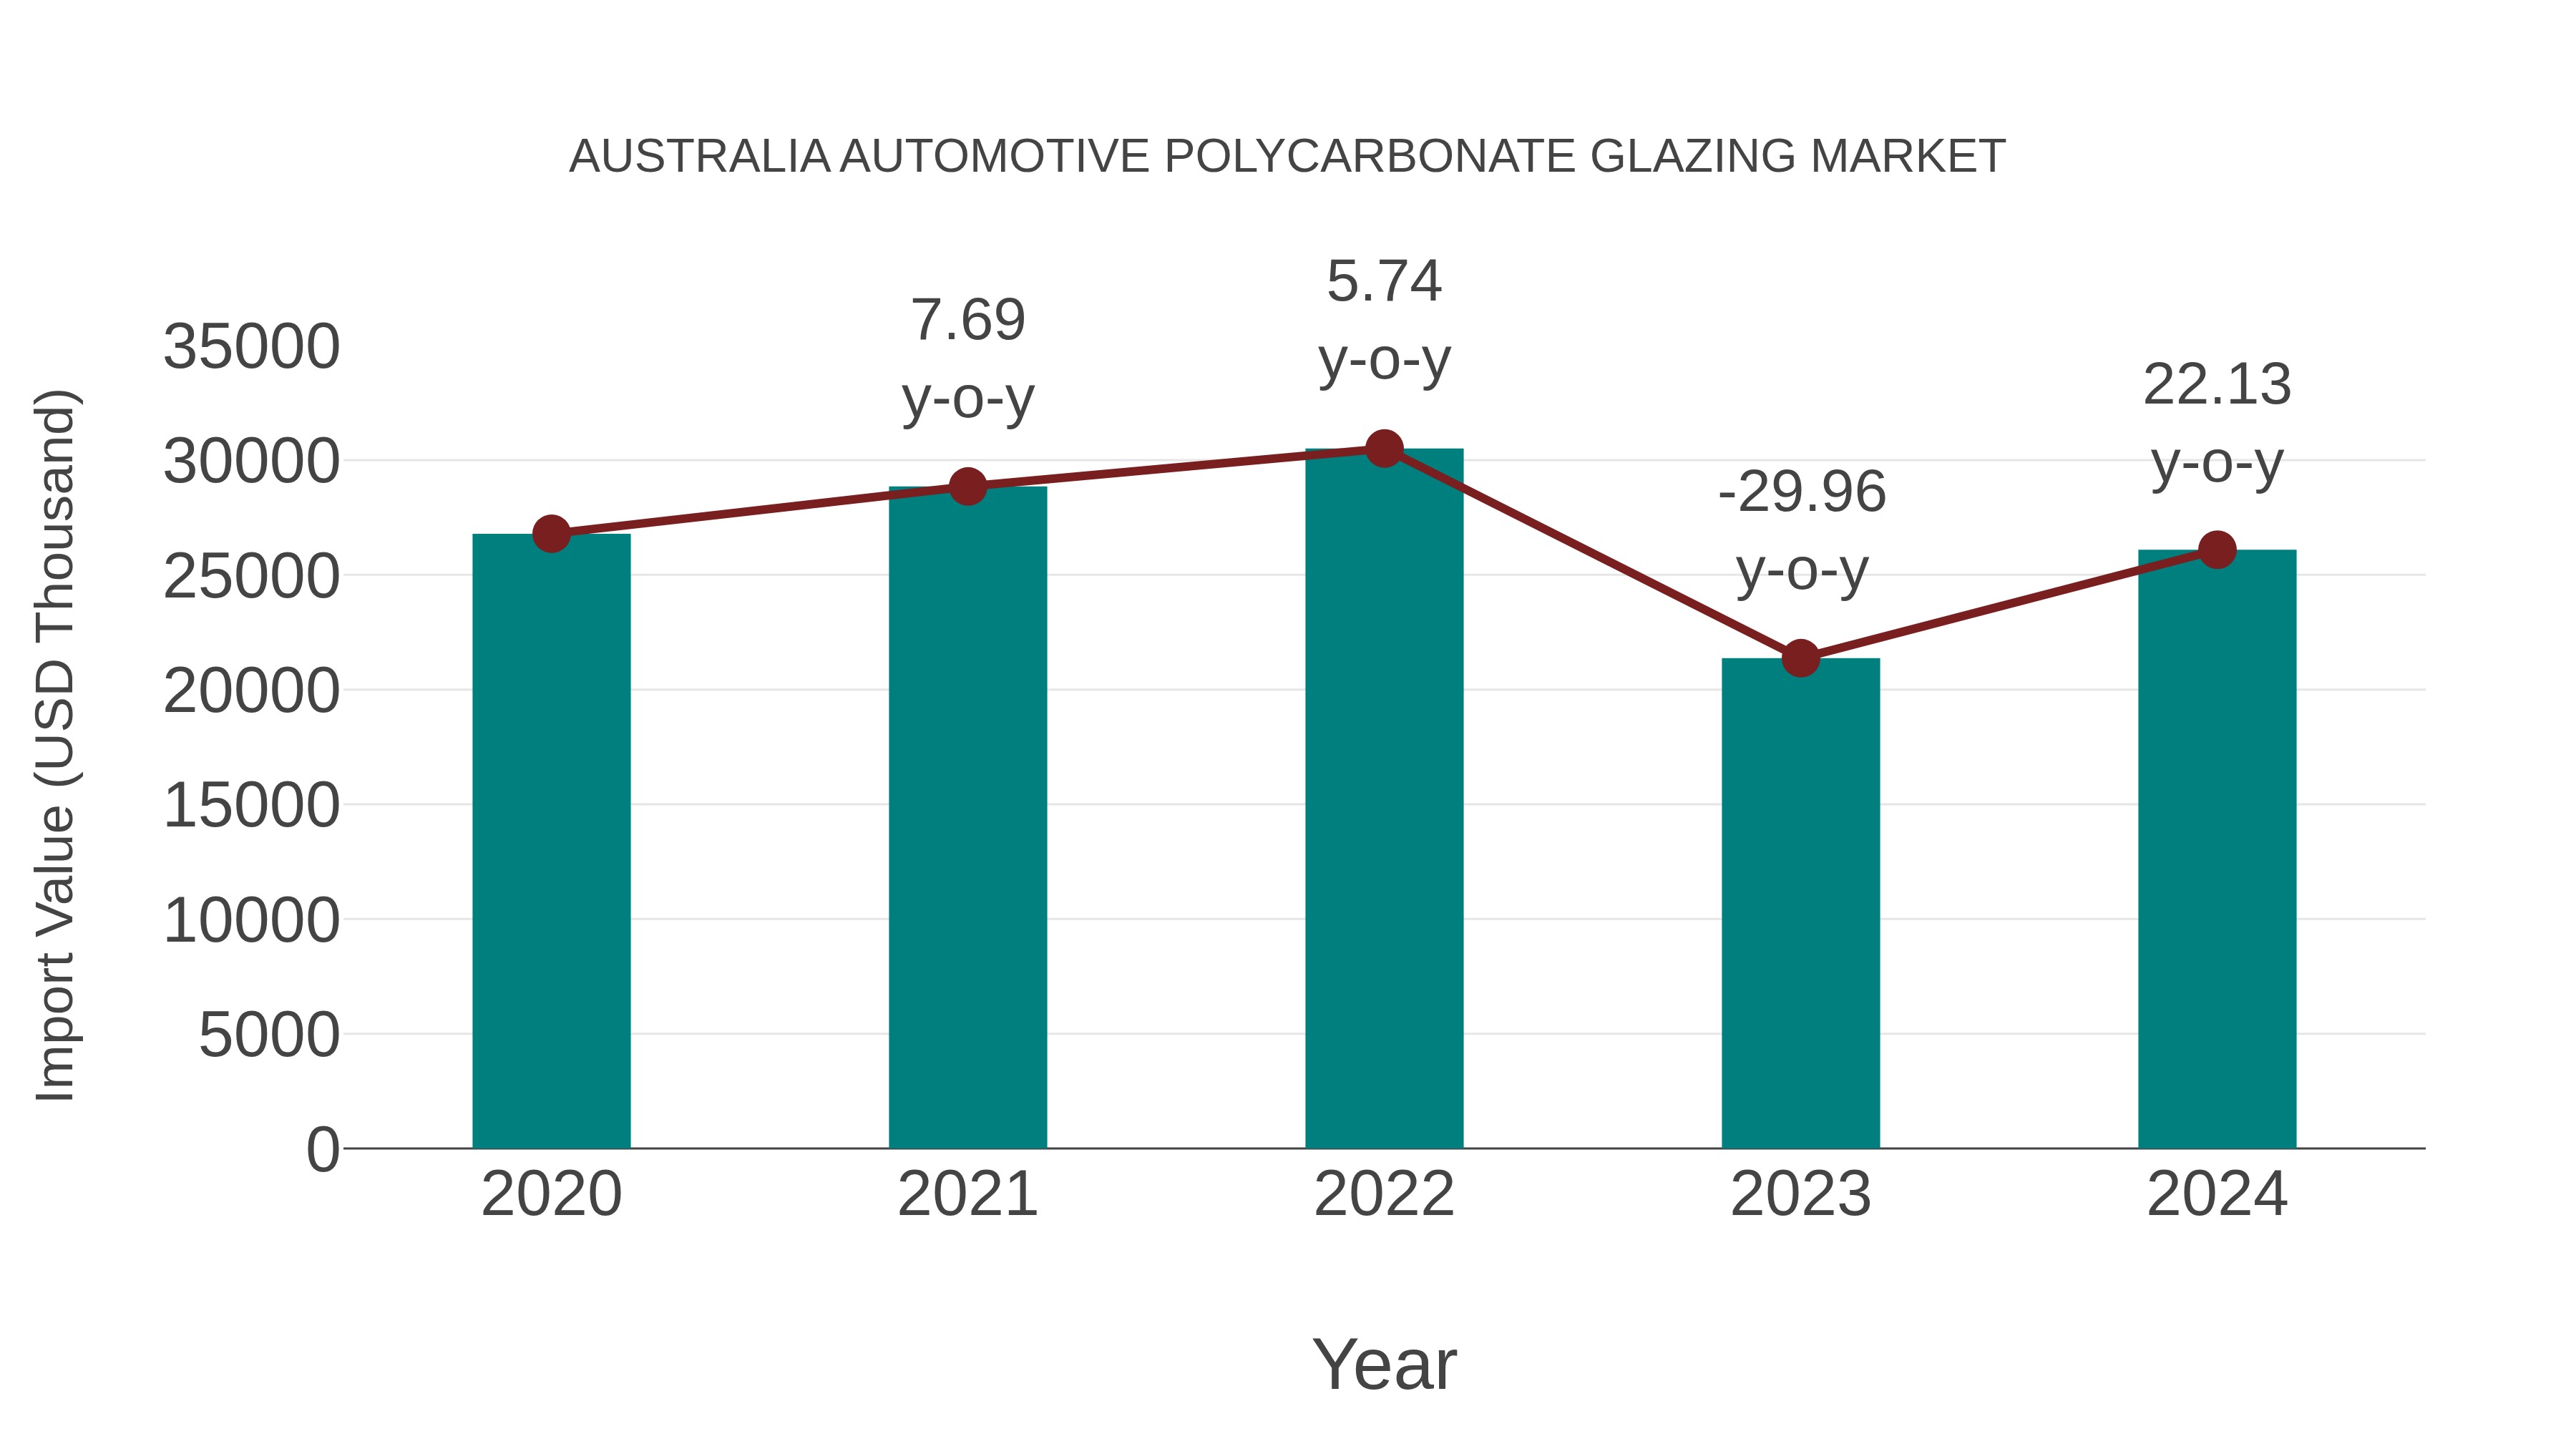
Australia Automotive Polycarbonate Glazing Market: Import Trend Analysis
Australia`s import trend for automotive polycarbonate glazing experienced a notable growth rate of 22.13% from 2023 to 2024, yet the compound annual growth rate (CAGR) for 2020-2024 stood at -0.66%. This fluctuation could be attributed to shifts in demand dynamics within the automotive sector, impacting market stability and import momentum during the period.
Key Highlights of the Report:
- Australia Automotive Polycarbonate Glazing Market Outlook
- Market Size of Australia Automotive Polycarbonate Glazing Market, 2025
- Forecast of Australia Automotive Polycarbonate Glazing Market, 2032
- Historical Data and Forecast of Australia Automotive Polycarbonate Glazing Revenues & Volume for the Period 2022-2032F
- Australia Automotive Polycarbonate Glazing Market Trend Evolution
- Australia Automotive Polycarbonate Glazing Market Drivers and Challenges
- Australia Automotive Polycarbonate Glazing Price Trends
- Australia Automotive Polycarbonate Glazing Porter's Five Forces
- Australia Automotive Polycarbonate Glazing Industry Life Cycle
- Historical Data and Forecast of Australia Automotive Polycarbonate Glazing Market Revenues & Volume By Technology for the Period 2022-2032F
- Historical Data and Forecast of Australia Automotive Polycarbonate Glazing Market Revenues & Volume By Sun Control Glazing for the Period 2022-2032F
- Historical Data and Forecast of Australia Automotive Polycarbonate Glazing Market Revenues & Volume By Hydrophobic Glazing for the Period 2022-2032F
- Historical Data and Forecast of Australia Automotive Polycarbonate Glazing Market Revenues & Volume By Switchable Glazing for the Period 2022-2032F
- Historical Data and Forecast of Australia Automotive Polycarbonate Glazing Market Revenues & Volume By Conventional for the Period 2022-2032F
- Historical Data and Forecast of Australia Automotive Polycarbonate Glazing Market Revenues & Volume By Application for the Period 2022-2032F
- Historical Data and Forecast of Australia Automotive Polycarbonate Glazing Market Revenues & Volume By Front Windshield for the Period 2022-2032F
- Historical Data and Forecast of Australia Automotive Polycarbonate Glazing Market Revenues & Volume By Backlite for the Period 2022-2032F
- Historical Data and Forecast of Australia Automotive Polycarbonate Glazing Market Revenues & Volume By Sidelite for the Period 2022-2032F
- Historical Data and Forecast of Australia Automotive Polycarbonate Glazing Market Revenues & Volume By Quarter glass for the Period 2022-2032F
- Historical Data and Forecast of Australia Automotive Polycarbonate Glazing Market Revenues & Volume By Panoramic roof/ Roof modules for the Period 2022-2032F
- Historical Data and Forecast of Australia Automotive Polycarbonate Glazing Market Revenues & Volume By Sales Channel for the Period 2022-2032F
- Historical Data and Forecast of Australia Automotive Polycarbonate Glazing Market Revenues & Volume By OEM for the Period 2022-2032F
- Historical Data and Forecast of Australia Automotive Polycarbonate Glazing Market Revenues & Volume By Aftermarket for the Period 2022-2032F
- Historical Data and Forecast of Australia Automotive Polycarbonate Glazing Market Revenues & Volume By Vehicle Type for the Period 2022-2032F
- Historical Data and Forecast of Australia Automotive Polycarbonate Glazing Market Revenues & Volume By Passenger Vehicle for the Period 2022-2032F
- Historical Data and Forecast of Australia Automotive Polycarbonate Glazing Market Revenues & Volume By Commercial Vehicle for the Period 2022-2032F
- Australia Automotive Polycarbonate Glazing Import Export Trade Statistics
- Market Opportunity Assessment By Technology
- Market Opportunity Assessment By Application
- Market Opportunity Assessment By Sales Channel
- Market Opportunity Assessment By Vehicle Type
- Australia Automotive Polycarbonate Glazing Top Companies Market Share
- Australia Automotive Polycarbonate Glazing Competitive Benchmarking By Technical and Operational Parameters
- Australia Automotive Polycarbonate Glazing Company Profiles
- Australia Automotive Polycarbonate Glazing Key Strategic Recommendations
Frequently Asked Questions About the Market Study (FAQs):
6Wresearch actively monitors the Australia Automotive Polycarbonate Glazing Market and publishes its comprehensive annual report, highlighting emerging trends, growth drivers, revenue analysis, and forecast outlook. Our insights help businesses to make data-backed strategic decisions with ongoing market dynamics. Our analysts track relevent industries related to the Australia Automotive Polycarbonate Glazing Market, allowing our clients with actionable intelligence and reliable forecasts tailored to emerging regional needs.
Yes, we provide customisation as per your requirements. To learn more, feel free to contact us on sales@6wresearch.com
1 Executive Summary |
2 Introduction |
2.1 Key Highlights of the Report |
2.2 Report Description |
2.3 Market Scope & Segmentation |
2.4 Research Methodology |
2.5 Assumptions |
3 Australia Automotive Polycarbonate Glazing Market Overview |
3.1 Australia Country Macro Economic Indicators |
3.2 Australia Automotive Polycarbonate Glazing Market Revenues & Volume, 2022 & 2032F |
3.3 Australia Automotive Polycarbonate Glazing Market - Industry Life Cycle |
3.4 Australia Automotive Polycarbonate Glazing Market - Porter's Five Forces |
3.5 Australia Automotive Polycarbonate Glazing Market Revenues & Volume Share, By Technology, 2022 & 2032F |
3.6 Australia Automotive Polycarbonate Glazing Market Revenues & Volume Share, By Application, 2022 & 2032F |
3.7 Australia Automotive Polycarbonate Glazing Market Revenues & Volume Share, By Sales Channel, 2022 & 2032F |
3.8 Australia Automotive Polycarbonate Glazing Market Revenues & Volume Share, By Vehicle Type, 2022 & 2032F |
4 Australia Automotive Polycarbonate Glazing Market Dynamics |
4.1 Impact Analysis |
4.2 Market Drivers |
4.2.1 Increasing focus on lightweight materials for fuel efficiency and emission reduction in the automotive industry |
4.2.2 Growing demand for enhanced safety features in vehicles driving the adoption of advanced glazing technologies |
4.2.3 Rising consumer preference for stylish and innovative automotive designs that incorporate polycarbonate glazing |
4.3 Market Restraints |
4.3.1 High initial costs associated with the adoption of polycarbonate glazing in automotive applications |
4.3.2 Concerns regarding the durability and scratch resistance of polycarbonate compared to traditional glass |
4.3.3 Regulatory challenges and standards compliance requirements in the automotive industry affecting the adoption of new materials like polycarbonate |
5 Australia Automotive Polycarbonate Glazing Market Trends |
6 Australia Automotive Polycarbonate Glazing Market, By Types |
6.1 Australia Automotive Polycarbonate Glazing Market, By Technology |
6.1.1 Overview and Analysis |
6.1.2 Australia Automotive Polycarbonate Glazing Market Revenues & Volume, By Technology, 2022-2032F |
6.1.3 Australia Automotive Polycarbonate Glazing Market Revenues & Volume, By Sun Control Glazing, 2022-2032F |
6.1.4 Australia Automotive Polycarbonate Glazing Market Revenues & Volume, By Hydrophobic Glazing, 2022-2032F |
6.1.5 Australia Automotive Polycarbonate Glazing Market Revenues & Volume, By Switchable Glazing, 2022-2032F |
6.1.6 Australia Automotive Polycarbonate Glazing Market Revenues & Volume, By Conventional, 2022-2032F |
6.2 Australia Automotive Polycarbonate Glazing Market, By Application |
6.2.1 Overview and Analysis |
6.2.2 Australia Automotive Polycarbonate Glazing Market Revenues & Volume, By Front Windshield, 2022-2032F |
6.2.3 Australia Automotive Polycarbonate Glazing Market Revenues & Volume, By Backlite, 2022-2032F |
6.2.4 Australia Automotive Polycarbonate Glazing Market Revenues & Volume, By Sidelite, 2022-2032F |
6.2.5 Australia Automotive Polycarbonate Glazing Market Revenues & Volume, By Quarter glass, 2022-2032F |
6.2.6 Australia Automotive Polycarbonate Glazing Market Revenues & Volume, By Panoramic roof/ Roof modules, 2022-2032F |
6.3 Australia Automotive Polycarbonate Glazing Market, By Sales Channel |
6.3.1 Overview and Analysis |
6.3.2 Australia Automotive Polycarbonate Glazing Market Revenues & Volume, By OEM, 2022-2032F |
6.3.3 Australia Automotive Polycarbonate Glazing Market Revenues & Volume, By Aftermarket, 2022-2032F |
6.4 Australia Automotive Polycarbonate Glazing Market, By Vehicle Type |
6.4.1 Overview and Analysis |
6.4.2 Australia Automotive Polycarbonate Glazing Market Revenues & Volume, By Passenger Vehicle, 2022-2032F |
6.4.3 Australia Automotive Polycarbonate Glazing Market Revenues & Volume, By Commercial Vehicle, 2022-2032F |
7 Australia Automotive Polycarbonate Glazing Market Import-Export Trade Statistics |
7.1 Australia Automotive Polycarbonate Glazing Market Export to Major Countries |
7.2 Australia Automotive Polycarbonate Glazing Market Imports from Major Countries |
8 Australia Automotive Polycarbonate Glazing Market Key Performance Indicators |
8.1 Weight reduction achieved through the use of polycarbonate glazing in vehicles |
8.2 Number of automotive manufacturers incorporating polycarbonate glazing in their product lines |
8.3 Rate of innovation and development in polycarbonate glazing technology |
8.4 Environmental impact assessment of polycarbonate glazing compared to traditional materials |
8.5 Level of customer satisfaction and acceptance of vehicles equipped with polycarbonate glazing |
9 Australia Automotive Polycarbonate Glazing Market - Opportunity Assessment |
9.1 Australia Automotive Polycarbonate Glazing Market Opportunity Assessment, By Technology, 2022 & 2032F |
9.2 Australia Automotive Polycarbonate Glazing Market Opportunity Assessment, By Application, 2022 & 2032F |
9.3 Australia Automotive Polycarbonate Glazing Market Opportunity Assessment, By Sales Channel, 2022 & 2032F |
9.4 Australia Automotive Polycarbonate Glazing Market Opportunity Assessment, By Vehicle Type, 2022 & 2032F |
10 Australia Automotive Polycarbonate Glazing Market - Competitive Landscape |
10.1 Australia Automotive Polycarbonate Glazing Market Revenue Share, By Companies, 2025 |
10.2 Australia Automotive Polycarbonate Glazing Market Competitive Benchmarking, By Operating and Technical Parameters |
11 Company Profiles |
12 Recommendations |
13 Disclaimer |
Export potential assessment - trade Analytics for 2030
Export potential enables firms to identify high-growth global markets with greater confidence by combining advanced trade intelligence with a structured quantitative methodology. The framework analyzes emerging demand trends and country-level import patterns while integrating macroeconomic and trade datasets such as GDP and population forecasts, bilateral import–export flows, tariff structures, elasticity differentials between developed and developing economies, geographic distance, and import demand projections. Using weighted trade values from 2020–2024 as the base period to project country-to-country export potential for 2030, these inputs are operationalized through calculated drivers such as gravity model parameters, tariff impact factors, and projected GDP per-capita growth. Through an analysis of hidden potentials, demand hotspots, and market conditions that are most favorable to success, this method enables firms to focus on target countries, maximize returns, and global expansion with data, backed by accuracy.
By factoring in the projected importer demand gap that is currently unmet and could be potential opportunity, it identifies the potential for the Exporter (Country) among 190 countries, against the general trade analysis, which identifies the biggest importer or exporter.
To discover high-growth global markets and optimize your business strategy:
Click Here
Pricing
- Single User License$ 1,995
- Department License$ 2,400
- Site License$ 3,120
- Global License$ 3,795

Search
Thought Leadership and Analyst Meet


Our Clients
Latest Reports
- United Kingdom (UK) Outdoor Cooking Equipment Market (2026-2032) | Investment Opportunities, Outlook, Growth, Competition, Trends, Pricing, Demand, Insights, Challenges, Drivers, Size, Restraints, segmentation, Value, Share, Forecast, Companies, Analysis, Revenue, Strategy
- United Arab Emirates (UAE) Outdoor Cooking Equipment Market (2026-2032) | Challenges, Value, Restraints, Growth, Competition, Revenue, Trends, Outlook, Analysis, Drivers, Share, Investment Opportunities, Strategy, Demand, Companies, Forecast, Pricing, segmentation, Size, Insights
- Vietnam Outdoor Cooking Equipment Market (2026-2032) | Demand, Investment Opportunities, Growth, Pricing, Trends, Restraints, Competition, Outlook, Drivers, Strategy, Challenges, Revenue, Analysis, segmentation, Value, Size, Share, Insights, Companies, Forecast
- Venezuela Outdoor Cooking Equipment Market (2026-2032) | Challenges, Revenue, Demand, Value, Pricing, Strategy, Competition, Analysis, Companies, Insights, Growth, Outlook, Forecast, Size, Restraints, segmentation, Drivers, Trends, Investment Opportunities, Share
- Uganda Outdoor Cooking Equipment Market (2026-2032) | Drivers, Pricing, Challenges, Value, Growth, Companies, segmentation, Strategy, Analysis, Demand, Outlook, Size, Competition, Restraints, Revenue, Forecast, Investment Opportunities, Insights, Trends, Share
- Turkey Outdoor Cooking Equipment Market (2026-2032) | Size, Competition, Outlook, Strategy, Forecast, Drivers, Trends, Companies, Revenue, Growth, Analysis, segmentation, Insights, Pricing, Restraints, Demand, Investment Opportunities, Value, Share, Challenges
- Tunisia Outdoor Cooking Equipment Market (2026-2032) | Analysis, Share, Pricing, Trends, Size, Outlook, Revenue, segmentation, Demand, Insights, Investment Opportunities, Restraints, Growth, Forecast, Competition, Drivers, Challenges, Companies, Strategy, Value
- Thailand Outdoor Cooking Equipment Market (2026-2032) | Growth, Revenue, Insights, Companies, Drivers, Strategy, Forecast, Size, Analysis, segmentation, Trends, Challenges, Competition, Share, Investment Opportunities, Demand, Pricing, Value, Restraints, Outlook
- Tanzania Outdoor Cooking Equipment Market (2026-2032) | Share, Drivers, Forecast, Revenue, Growth, Outlook, Analysis, Investment Opportunities, Restraints, segmentation, Demand, Pricing, Size, Insights, Challenges, Competition, Companies, Value, Trends, Strategy
- Tajikistan Outdoor Cooking Equipment Market (2026-2032) | Value, Pricing, Companies, Share, Strategy, Revenue, Investment Opportunities, Demand, Forecast, Size, Competition, Challenges, Growth, Insights, Restraints, segmentation, Analysis, Trends, Drivers, Outlook
Industry Events and Analyst Meet

HIMTEX 2026

India Refining Summit 2026

India EV Show 2026

EV tech India Expo 2026

Auto Tech Asia 2026
Whitepaper
- Middle East & Africa Commercial Security Market Click here to view more.
- Middle East & Africa Fire Safety Systems & Equipment Market Click here to view more.
- GCC Drone Market Click here to view more.
- Middle East Lighting Fixture Market Click here to view more.
- GCC Physical & Perimeter Security Market Click here to view more.
6WResearch In News
- Doha a strategic location for EV manufacturing hub: IPA Qatar
- Demand for luxury TVs surging in the GCC, says Samsung
- Empowering Growth: The Thriving Journey of Bangladesh’s Cable Industry
- Demand for luxury TVs surging in the GCC, says Samsung
- Video call with a traditional healer? Once unthinkable, it’s now common in South Africa
- Intelligent Buildings To Smooth GCC’s Path To Net Zero