Australia Fluidized Catalytic Cracking FCC Catalyst Market (2026-2032) | Trends, Growth, Share, Segmentation, Value, Industry, Outlook, Competitive Landscape, Size & Revenue, Forecast, Companies, Analysis
Market Forecast By Process (Gasoline Sulfur Reduction, Maximum Light Olefins, Maximum Middle Distillates, Maximum Bottoms Conversion, Low Coke Production, Others), By Application (Vacuum Gas Oil, Residue, Others) And Competitive Landscape
| Product Code: ETC6180960 | Publication Date: Sep 2024 | Updated Date: Mar 2026 | Product Type: Market Research Report | |
| Publisher: 6Wresearch | Author: Bhawna Singh | No. of Pages: 75 | No. of Figures: 35 | No. of Tables: 20 |
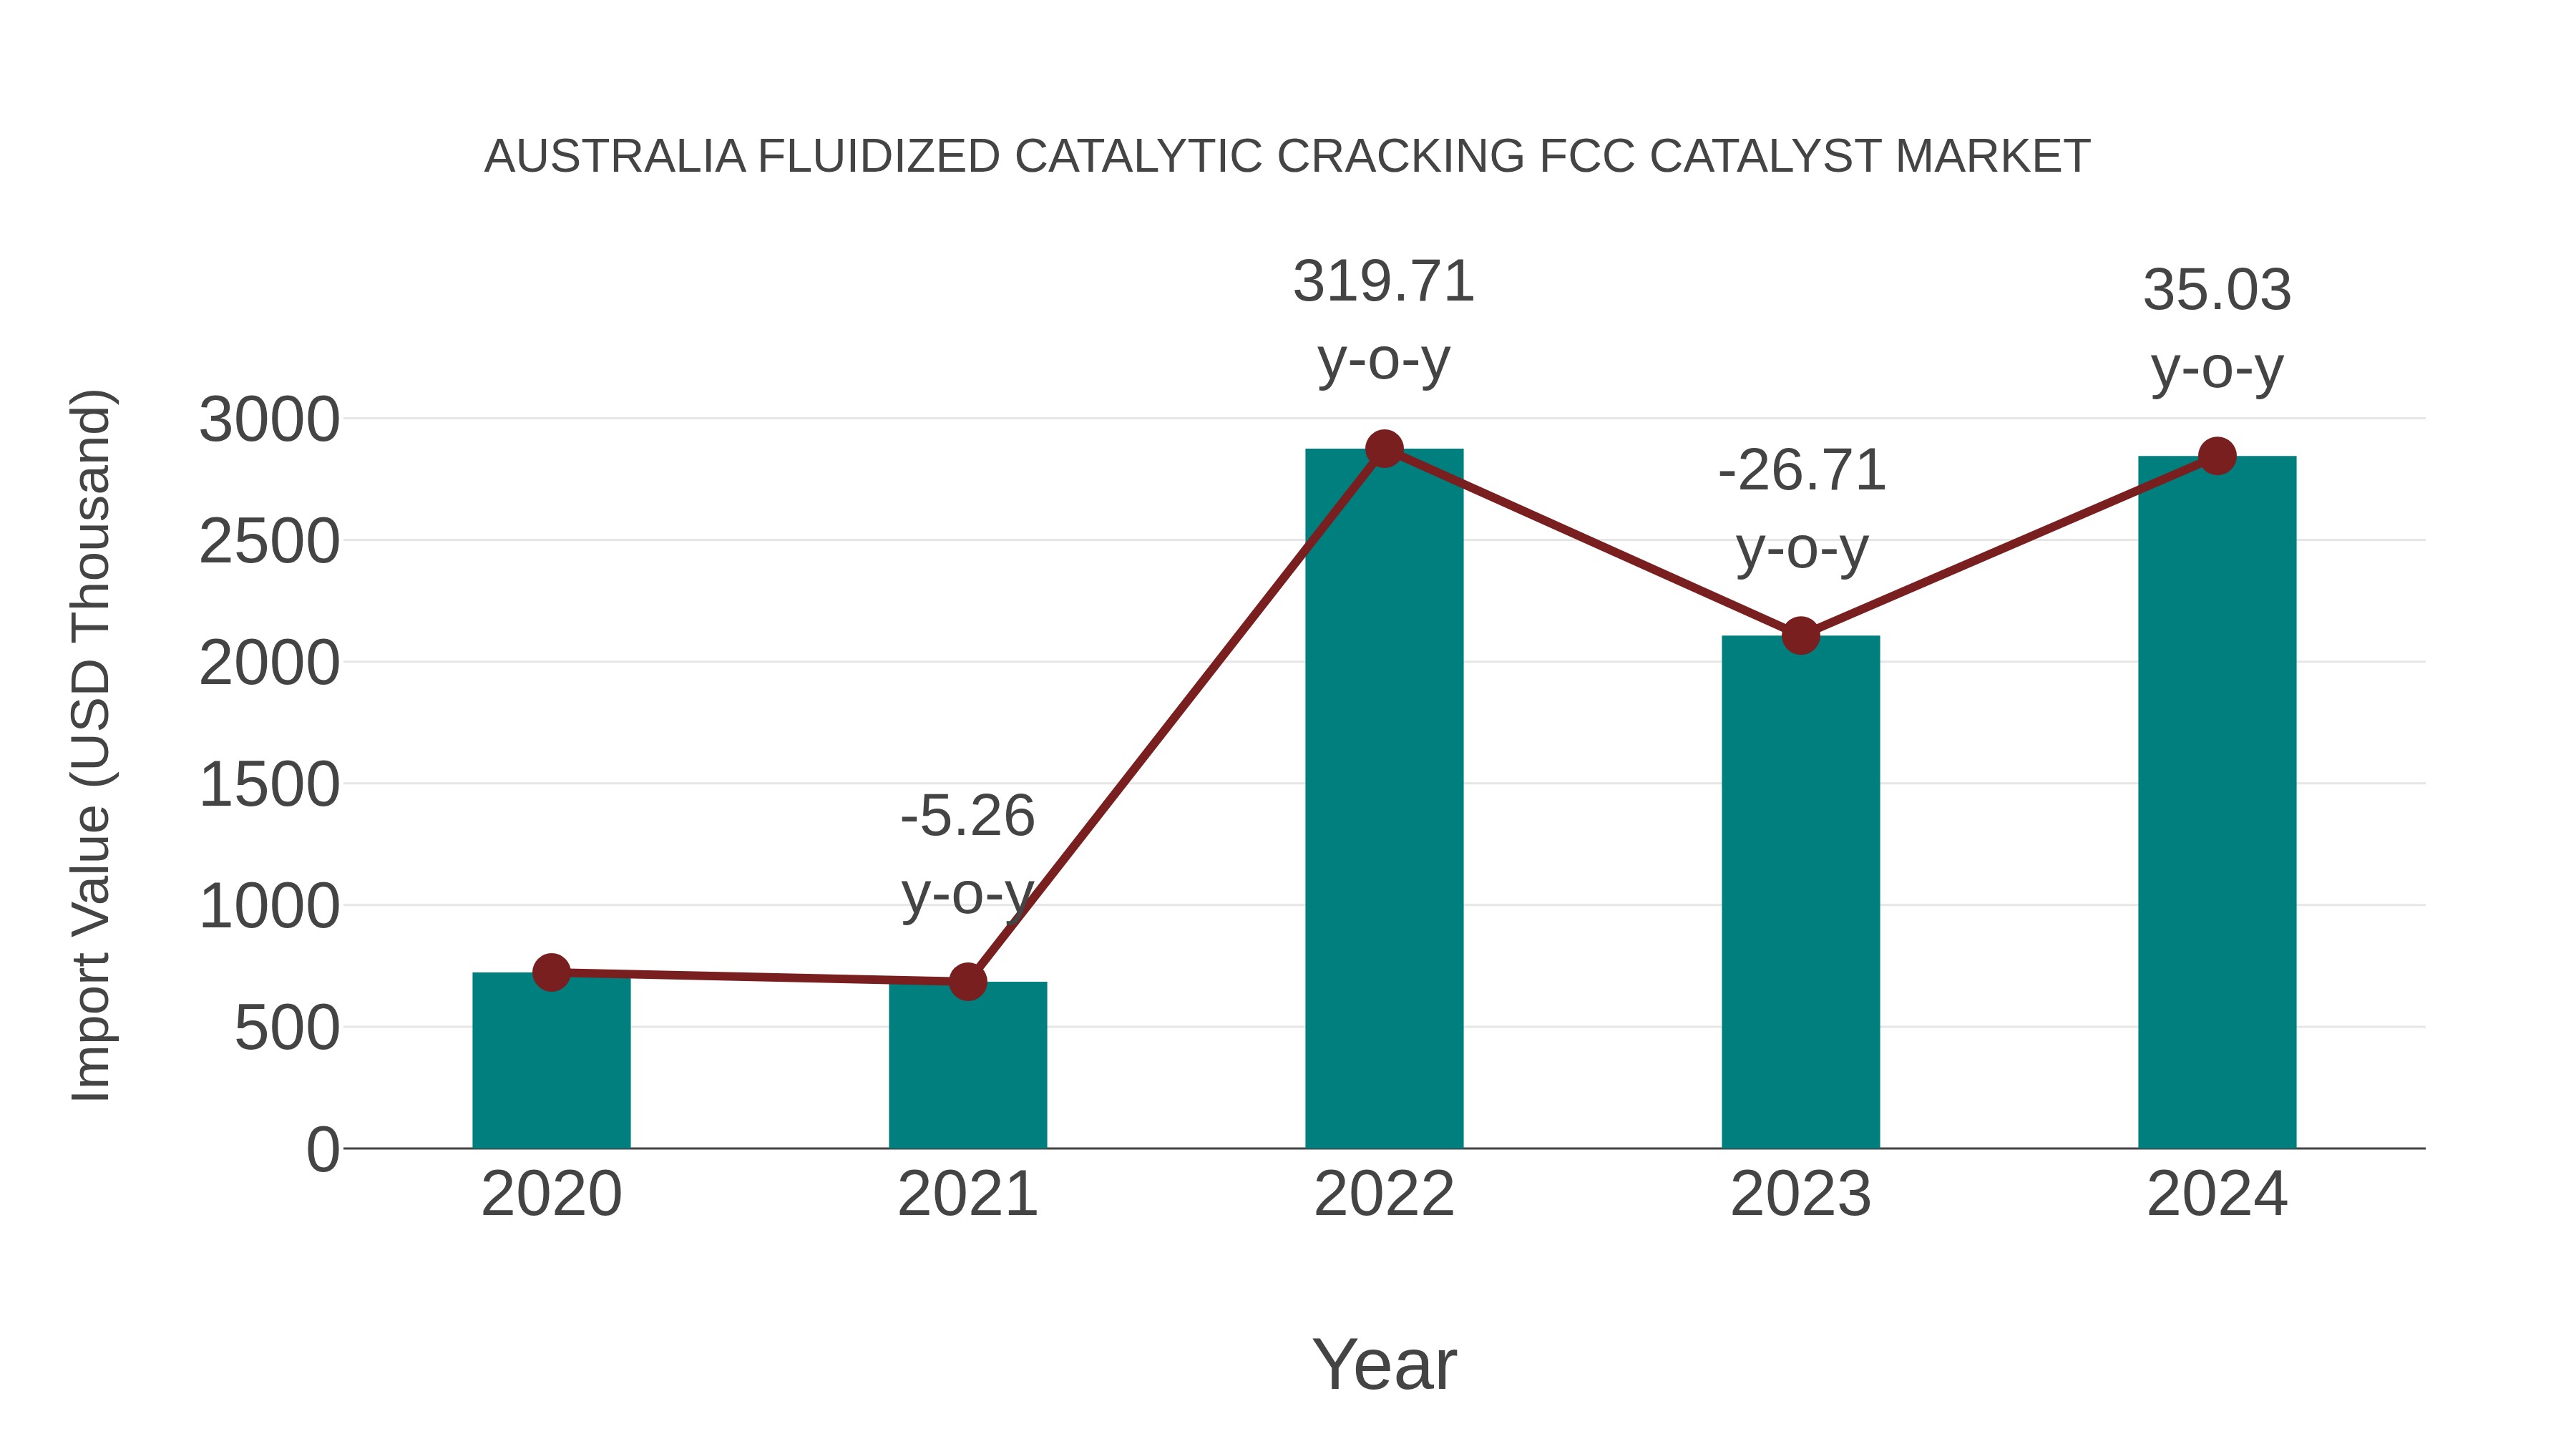
Australia Fluidized Catalytic Cracking Fcc Catalyst Market: Import Trend Analysis
Australia`s import trend for fluidized catalytic cracking (FCC) catalysts showed robust growth from 2023 to 2024, with a notable increase of 35.03%. The compound annual growth rate (CAGR) for the period 2020-2024 stood at an impressive 40.84%. This significant uptrend can be attributed to a surge in demand for FCC catalysts driven by a recovering market post-pandemic and increased industrial activities.
Australia Fluidized Catalytic Cracking Fcc Catalyst Market Overview
The FCC Catalyst Market in Australia supports the refining industry by providing catalysts used in the fluidized catalytic cracking process to convert heavy hydrocarbons into lighter, more valuable products such as gasoline and diesel. The market growth is influenced by the country`s refining capacity, fluctuating crude oil prices, and environmental regulations targeting emissions reduction. Innovations aimed at catalyst efficiency and longevity are critical to meet stringent fuel quality standards.
Trends of the market
The FCC catalyst market in Australia is shaped by ongoing efforts to improve refining efficiency and reduce environmental impact. New catalyst formulations are being developed to enhance conversion rates, reduce coke formation, and enable processing of heavier crude oils. There is also an emphasis on catalysts that can improve the yield of cleaner fuels and reduce sulfur content. Technological advancements in catalyst regeneration and durability are supporting more sustainable refining operations. The market is influenced by regulatory pressures targeting emission reductions and fuel quality standards.
Challenges of the market
The FCC catalyst market in Australia faces challenges related to the fluctuating demand for refined petroleum products and evolving regulations targeting emissions reduction. Catalyst manufacturers must continuously innovate to improve efficiency and reduce environmental impact, requiring significant R&D investment. Supply chain disruptions and raw material price volatility also affect market stability. Moreover, the increasing shift towards renewable energy sources and alternative fuels could limit the long-term growth potential of this market.
Investment opportunities in the Market
Investment opportunities in FCC catalysts arise from Australia`s efforts to modernize its petroleum refining sector and optimize fuel output. As refiners seek higher efficiency and compliance with environmental standards, demand is growing for advanced catalyst technologies. Investors can explore partnerships with local refineries or supply chain stakeholders to introduce next-gen catalysts.
Government Policy of the market
This market is influenced by environmental and industrial policies related to emissions control and refinery operations. The Department of Industry, Science and Resources enforces guidelines to limit pollutants from catalytic cracking processes. Furthermore, emissions trading schemes and carbon tax mechanisms affect operational costs and technological innovation in this sector, pushing for the adoption of more efficient catalysts.
Key Highlights of the Report:
- Australia Fluidized Catalytic Cracking FCC Catalyst Market Outlook
- Market Size of Australia Fluidized Catalytic Cracking FCC Catalyst Market, 2025
- Forecast of Australia Fluidized Catalytic Cracking FCC Catalyst Market, 2032
- Historical Data and Forecast of Australia Fluidized Catalytic Cracking FCC Catalyst Revenues & Volume for the Period 2022 - 2032F
- Australia Fluidized Catalytic Cracking FCC Catalyst Market Trend Evolution
- Australia Fluidized Catalytic Cracking FCC Catalyst Market Drivers and Challenges
- Australia Fluidized Catalytic Cracking FCC Catalyst Price Trends
- Australia Fluidized Catalytic Cracking FCC Catalyst Porter's Five Forces
- Australia Fluidized Catalytic Cracking FCC Catalyst Industry Life Cycle
- Historical Data and Forecast of Australia Fluidized Catalytic Cracking FCC Catalyst Market Revenues & Volume By Process for the Period 2022 - 2032F
- Historical Data and Forecast of Australia Fluidized Catalytic Cracking FCC Catalyst Market Revenues & Volume By Gasoline Sulfur Reduction for the Period 2022 - 2032F
- Historical Data and Forecast of Australia Fluidized Catalytic Cracking FCC Catalyst Market Revenues & Volume By Maximum Light Olefins for the Period 2022 - 2032F
- Historical Data and Forecast of Australia Fluidized Catalytic Cracking FCC Catalyst Market Revenues & Volume By Maximum Middle Distillates for the Period 2022 - 2032F
- Historical Data and Forecast of Australia Fluidized Catalytic Cracking FCC Catalyst Market Revenues & Volume By Maximum Bottoms Conversion for the Period 2022 - 2032F
- Historical Data and Forecast of Australia Fluidized Catalytic Cracking FCC Catalyst Market Revenues & Volume By Low Coke Production for the Period 2022 - 2032F
- Historical Data and Forecast of Australia Fluidized Catalytic Cracking FCC Catalyst Market Revenues & Volume By Others for the Period 2022 - 2032F
- Historical Data and Forecast of Australia Fluidized Catalytic Cracking FCC Catalyst Market Revenues & Volume By Application for the Period 2022 - 2032F
- Historical Data and Forecast of Australia Fluidized Catalytic Cracking FCC Catalyst Market Revenues & Volume By Vacuum Gas Oil for the Period 2022 - 2032F
- Historical Data and Forecast of Australia Fluidized Catalytic Cracking FCC Catalyst Market Revenues & Volume By Residue for the Period 2022 - 2032F
- Historical Data and Forecast of Australia Fluidized Catalytic Cracking FCC Catalyst Market Revenues & Volume By Others for the Period 2022 - 2032F
- Australia Fluidized Catalytic Cracking FCC Catalyst Import Export Trade Statistics
- Market Opportunity Assessment By Process
- Market Opportunity Assessment By Application
- Australia Fluidized Catalytic Cracking FCC Catalyst Top Companies Market Share
- Australia Fluidized Catalytic Cracking FCC Catalyst Competitive Benchmarking By Technical and Operational Parameters
- Australia Fluidized Catalytic Cracking FCC Catalyst Company Profiles
- Australia Fluidized Catalytic Cracking FCC Catalyst Key Strategic Recommendations
Australia Fluidized Catalytic Cracking FCC Catalyst Market (2026-2032): FAQs
6Wresearch actively monitors the Australia Fluidized Catalytic Cracking FCC Catalyst Market and publishes its comprehensive annual report, highlighting emerging trends, growth drivers, revenue analysis, and forecast outlook. Our insights help businesses to make data-backed strategic decisions with ongoing market dynamics. Our analysts track relevent industries related to the Australia Fluidized Catalytic Cracking FCC Catalyst Market, allowing our clients with actionable intelligence and reliable forecasts tailored to emerging regional needs.
Yes, we provide customisation as per your requirements. To learn more, feel free to contact us on sales@6wresearch.com
1 Executive Summary |
2 Introduction |
2.1 Key Highlights of the Report |
2.2 Report Description |
2.3 Market Scope & Segmentation |
2.4 Research Methodology |
2.5 Assumptions |
3 Australia Fluidized Catalytic Cracking FCC Catalyst Market Overview |
3.1 Australia Country Macro Economic Indicators |
3.2 Australia Fluidized Catalytic Cracking FCC Catalyst Market Revenues & Volume, 2022 & 2032F |
3.3 Australia Fluidized Catalytic Cracking FCC Catalyst Market - Industry Life Cycle |
3.4 Australia Fluidized Catalytic Cracking FCC Catalyst Market - Porter's Five Forces |
3.5 Australia Fluidized Catalytic Cracking FCC Catalyst Market Revenues & Volume Share, By Process, 2022 & 2032F |
3.6 Australia Fluidized Catalytic Cracking FCC Catalyst Market Revenues & Volume Share, By Application, 2022 & 2032F |
4 Australia Fluidized Catalytic Cracking FCC Catalyst Market Dynamics |
4.1 Impact Analysis |
4.2 Market Drivers |
4.2.1 Increasing demand for petroleum products in Australia |
4.2.2 Growing focus on reducing sulfur content in fuels |
4.2.3 Technological advancements in fluidized catalytic cracking (FCC) catalysts |
4.3 Market Restraints |
4.3.1 Volatility in crude oil prices |
4.3.2 Stringent environmental regulations |
4.3.3 Competition from alternative refining technologies |
5 Australia Fluidized Catalytic Cracking FCC Catalyst Market Trends |
6 Australia Fluidized Catalytic Cracking FCC Catalyst Market, By Types |
6.1 Australia Fluidized Catalytic Cracking FCC Catalyst Market, By Process |
6.1.1 Overview and Analysis |
6.1.2 Australia Fluidized Catalytic Cracking FCC Catalyst Market Revenues & Volume, By Process, 2022 - 2032F |
6.1.3 Australia Fluidized Catalytic Cracking FCC Catalyst Market Revenues & Volume, By Gasoline Sulfur Reduction, 2022 - 2032F |
6.1.4 Australia Fluidized Catalytic Cracking FCC Catalyst Market Revenues & Volume, By Maximum Light Olefins, 2022 - 2032F |
6.1.5 Australia Fluidized Catalytic Cracking FCC Catalyst Market Revenues & Volume, By Maximum Middle Distillates, 2022 - 2032F |
6.1.6 Australia Fluidized Catalytic Cracking FCC Catalyst Market Revenues & Volume, By Maximum Bottoms Conversion, 2022 - 2032F |
6.1.7 Australia Fluidized Catalytic Cracking FCC Catalyst Market Revenues & Volume, By Low Coke Production, 2022 - 2032F |
6.1.8 Australia Fluidized Catalytic Cracking FCC Catalyst Market Revenues & Volume, By Others, 2022 - 2032F |
6.2 Australia Fluidized Catalytic Cracking FCC Catalyst Market, By Application |
6.2.1 Overview and Analysis |
6.2.2 Australia Fluidized Catalytic Cracking FCC Catalyst Market Revenues & Volume, By Vacuum Gas Oil, 2022 - 2032F |
6.2.3 Australia Fluidized Catalytic Cracking FCC Catalyst Market Revenues & Volume, By Residue, 2022 - 2032F |
6.2.4 Australia Fluidized Catalytic Cracking FCC Catalyst Market Revenues & Volume, By Others, 2022 - 2032F |
7 Australia Fluidized Catalytic Cracking FCC Catalyst Market Import-Export Trade Statistics |
7.1 Australia Fluidized Catalytic Cracking FCC Catalyst Market Export to Major Countries |
7.2 Australia Fluidized Catalytic Cracking FCC Catalyst Market Imports from Major Countries |
8 Australia Fluidized Catalytic Cracking FCC Catalyst Market Key Performance Indicators |
8.1 Average catalyst activity improvement rate |
8.2 Reduction in catalyst consumption per barrel of feedstock |
8.3 Increase in FCC unit efficiency |
8.4 Adoption rate of innovative FCC catalyst technologies |
8.5 Growth in demand for high-performance FCC catalysts |
9 Australia Fluidized Catalytic Cracking FCC Catalyst Market - Opportunity Assessment |
9.1 Australia Fluidized Catalytic Cracking FCC Catalyst Market Opportunity Assessment, By Process, 2022 & 2032F |
9.2 Australia Fluidized Catalytic Cracking FCC Catalyst Market Opportunity Assessment, By Application, 2022 & 2032F |
10 Australia Fluidized Catalytic Cracking FCC Catalyst Market - Competitive Landscape |
10.1 Australia Fluidized Catalytic Cracking FCC Catalyst Market Revenue Share, By Companies, 2025 |
10.2 Australia Fluidized Catalytic Cracking FCC Catalyst Market Competitive Benchmarking, By Operating and Technical Parameters |
11 Company Profiles |
12 Recommendations |
13 Disclaimer |
Export potential assessment - trade Analytics for 2030
Export potential enables firms to identify high-growth global markets with greater confidence by combining advanced trade intelligence with a structured quantitative methodology. The framework analyzes emerging demand trends and country-level import patterns while integrating macroeconomic and trade datasets such as GDP and population forecasts, bilateral import–export flows, tariff structures, elasticity differentials between developed and developing economies, geographic distance, and import demand projections. Using weighted trade values from 2020–2024 as the base period to project country-to-country export potential for 2030, these inputs are operationalized through calculated drivers such as gravity model parameters, tariff impact factors, and projected GDP per-capita growth. Through an analysis of hidden potentials, demand hotspots, and market conditions that are most favorable to success, this method enables firms to focus on target countries, maximize returns, and global expansion with data, backed by accuracy.
By factoring in the projected importer demand gap that is currently unmet and could be potential opportunity, it identifies the potential for the Exporter (Country) among 190 countries, against the general trade analysis, which identifies the biggest importer or exporter.
To discover high-growth global markets and optimize your business strategy:
Click Here
Pricing
- Single User License$ 1,995
- Department License$ 2,400
- Site License$ 3,120
- Global License$ 3,795

Search
Thought Leadership and Analyst Meet


Our Clients
Latest Reports
- Canada Cloud CFD Market (2026-2032) | Size & Revenue, Industry, Growth, Competitive Landscape, Forecast, Segmentation, Value, Outlook, Trends, Share, Analysis, Companies
- Taiwan Food Delivery Platform Market (2026-2032) | Companies, Outlook, Analysis, Trends, Value, Revenue, Segmentation, Share, Forecast, Competitive Landscape, Growth, Size & Forecast
- United Kingdom (UK) Long-term Care Insurance Market (2026-2032) | Growth, Share, Consumer Insights, Drivers, Opportunities, Competition, Pricing Analysis, Segments, Restraints, Companies, Competitive, Value, Outlook, Size, Demand, Analysis, Challenges, Strategic Insights, Investment Trends, Revenue, Trends, Supply, Forecast
- United Kingdom (UK) Long Term Care Market (2026-2032) | Companies, Outlook, Analysis, Trends, Value, Revenue, Segmentation, Share, Forecast, Competitive Landscape, Growth, Size & Forecast
- Iraq Insulation and Waterproofing Market (2026-2032) | Outlook, Drivers, Growth, Size, Share, Industry, Revenue, Trends, Demand, Competitive, Strategic Insights, Opportunities, Segments, Companies, Challenges, Strategy, Consumer Insights, Analysis, Investment Trends, Value, Segmentation, Forecast, Restraints
- India Switchgear Market Outlook (2026-2032) | Size, Share, Trends, Growth, Revenue, Forecast, Analysis, Value, Outlook
- Pakistan Contraceptive Implants Market (2025-2031) | Demand, Growth, Size, Share, Industry, Pricing Analysis, Competitive, Strategic Insights, Strategy, Consumer Insights, Analysis, Investment Trends, Opportunities, Revenue, Segments, Value, Segmentation, Supply, Forecast, Restraints, Outlook, Competition, Drivers, Trends, Companies, Challenges
- Sri Lanka Packaging Market (2026-2032) | Outlook, Competition, Drivers, Trends, Demand, Pricing Analysis, Competitive, Strategic Insights, Companies, Challenges, Strategy, Consumer Insights, Analysis, Investment Trends, Opportunities, Growth, Size, Share, Industry, Revenue, Segments, Value, Segmentation, Supply, Forecast, Restraints
- India Kids Watches Market (2026-2032) | Strategy, Consumer Insights, Analysis, Investment Trends, Opportunities, Growth, Size, Share, Industry, Revenue, Segments, Value, Segmentation, Supply, Forecast, Restraints, Outlook, Competition, Drivers, Trends, Demand, Pricing Analysis, Competitive, Strategic Insights, Companies, Challenges
- Saudi Arabia Core Assurance Service Market (2025-2031) | Strategy, Consumer Insights, Analysis, Investment Trends, Opportunities, Growth, Size, Share, Industry, Revenue, Segments, Value, Segmentation, Supply, Forecast, Restraints, Outlook, Competition, Drivers, Trends, Demand, Pricing Analysis, Competitive, Strategic Insights, Companies, Challenges
Industry Events and Analyst Meet

India EV Show 2026

EV tech India Expo 2026

Auto Tech Asia 2026

Battery Tech India 2026

Smart Production Solutions Guangzhou 2026
Whitepaper
- Middle East & Africa Commercial Security Market Click here to view more.
- Middle East & Africa Fire Safety Systems & Equipment Market Click here to view more.
- GCC Drone Market Click here to view more.
- Middle East Lighting Fixture Market Click here to view more.
- GCC Physical & Perimeter Security Market Click here to view more.
6WResearch In News
- Doha a strategic location for EV manufacturing hub: IPA Qatar
- Demand for luxury TVs surging in the GCC, says Samsung
- Empowering Growth: The Thriving Journey of Bangladesh’s Cable Industry
- Demand for luxury TVs surging in the GCC, says Samsung
- Video call with a traditional healer? Once unthinkable, it’s now common in South Africa
- Intelligent Buildings To Smooth GCC’s Path To Net Zero