Australia Food 3D Printing Market (2026-2032) | Share, Forecast, Analysis, Trends, Industry, Competitive Landscape, Growth, Outlook, Size & Revenue, Segmentation, Value, Companies
Market Forecast By Type (Chocolates And Confectionery, Bakery, Meat And Seafood, Other), By End User (Government, Commercial, Residential) And Competitive Landscape
| Product Code: ETC6181048 | Publication Date: Sep 2024 | Updated Date: Mar 2026 | Product Type: Market Research Report | |
| Publisher: 6Wresearch | Author: Shubham Deep | No. of Pages: 75 | No. of Figures: 35 | No. of Tables: 20 |
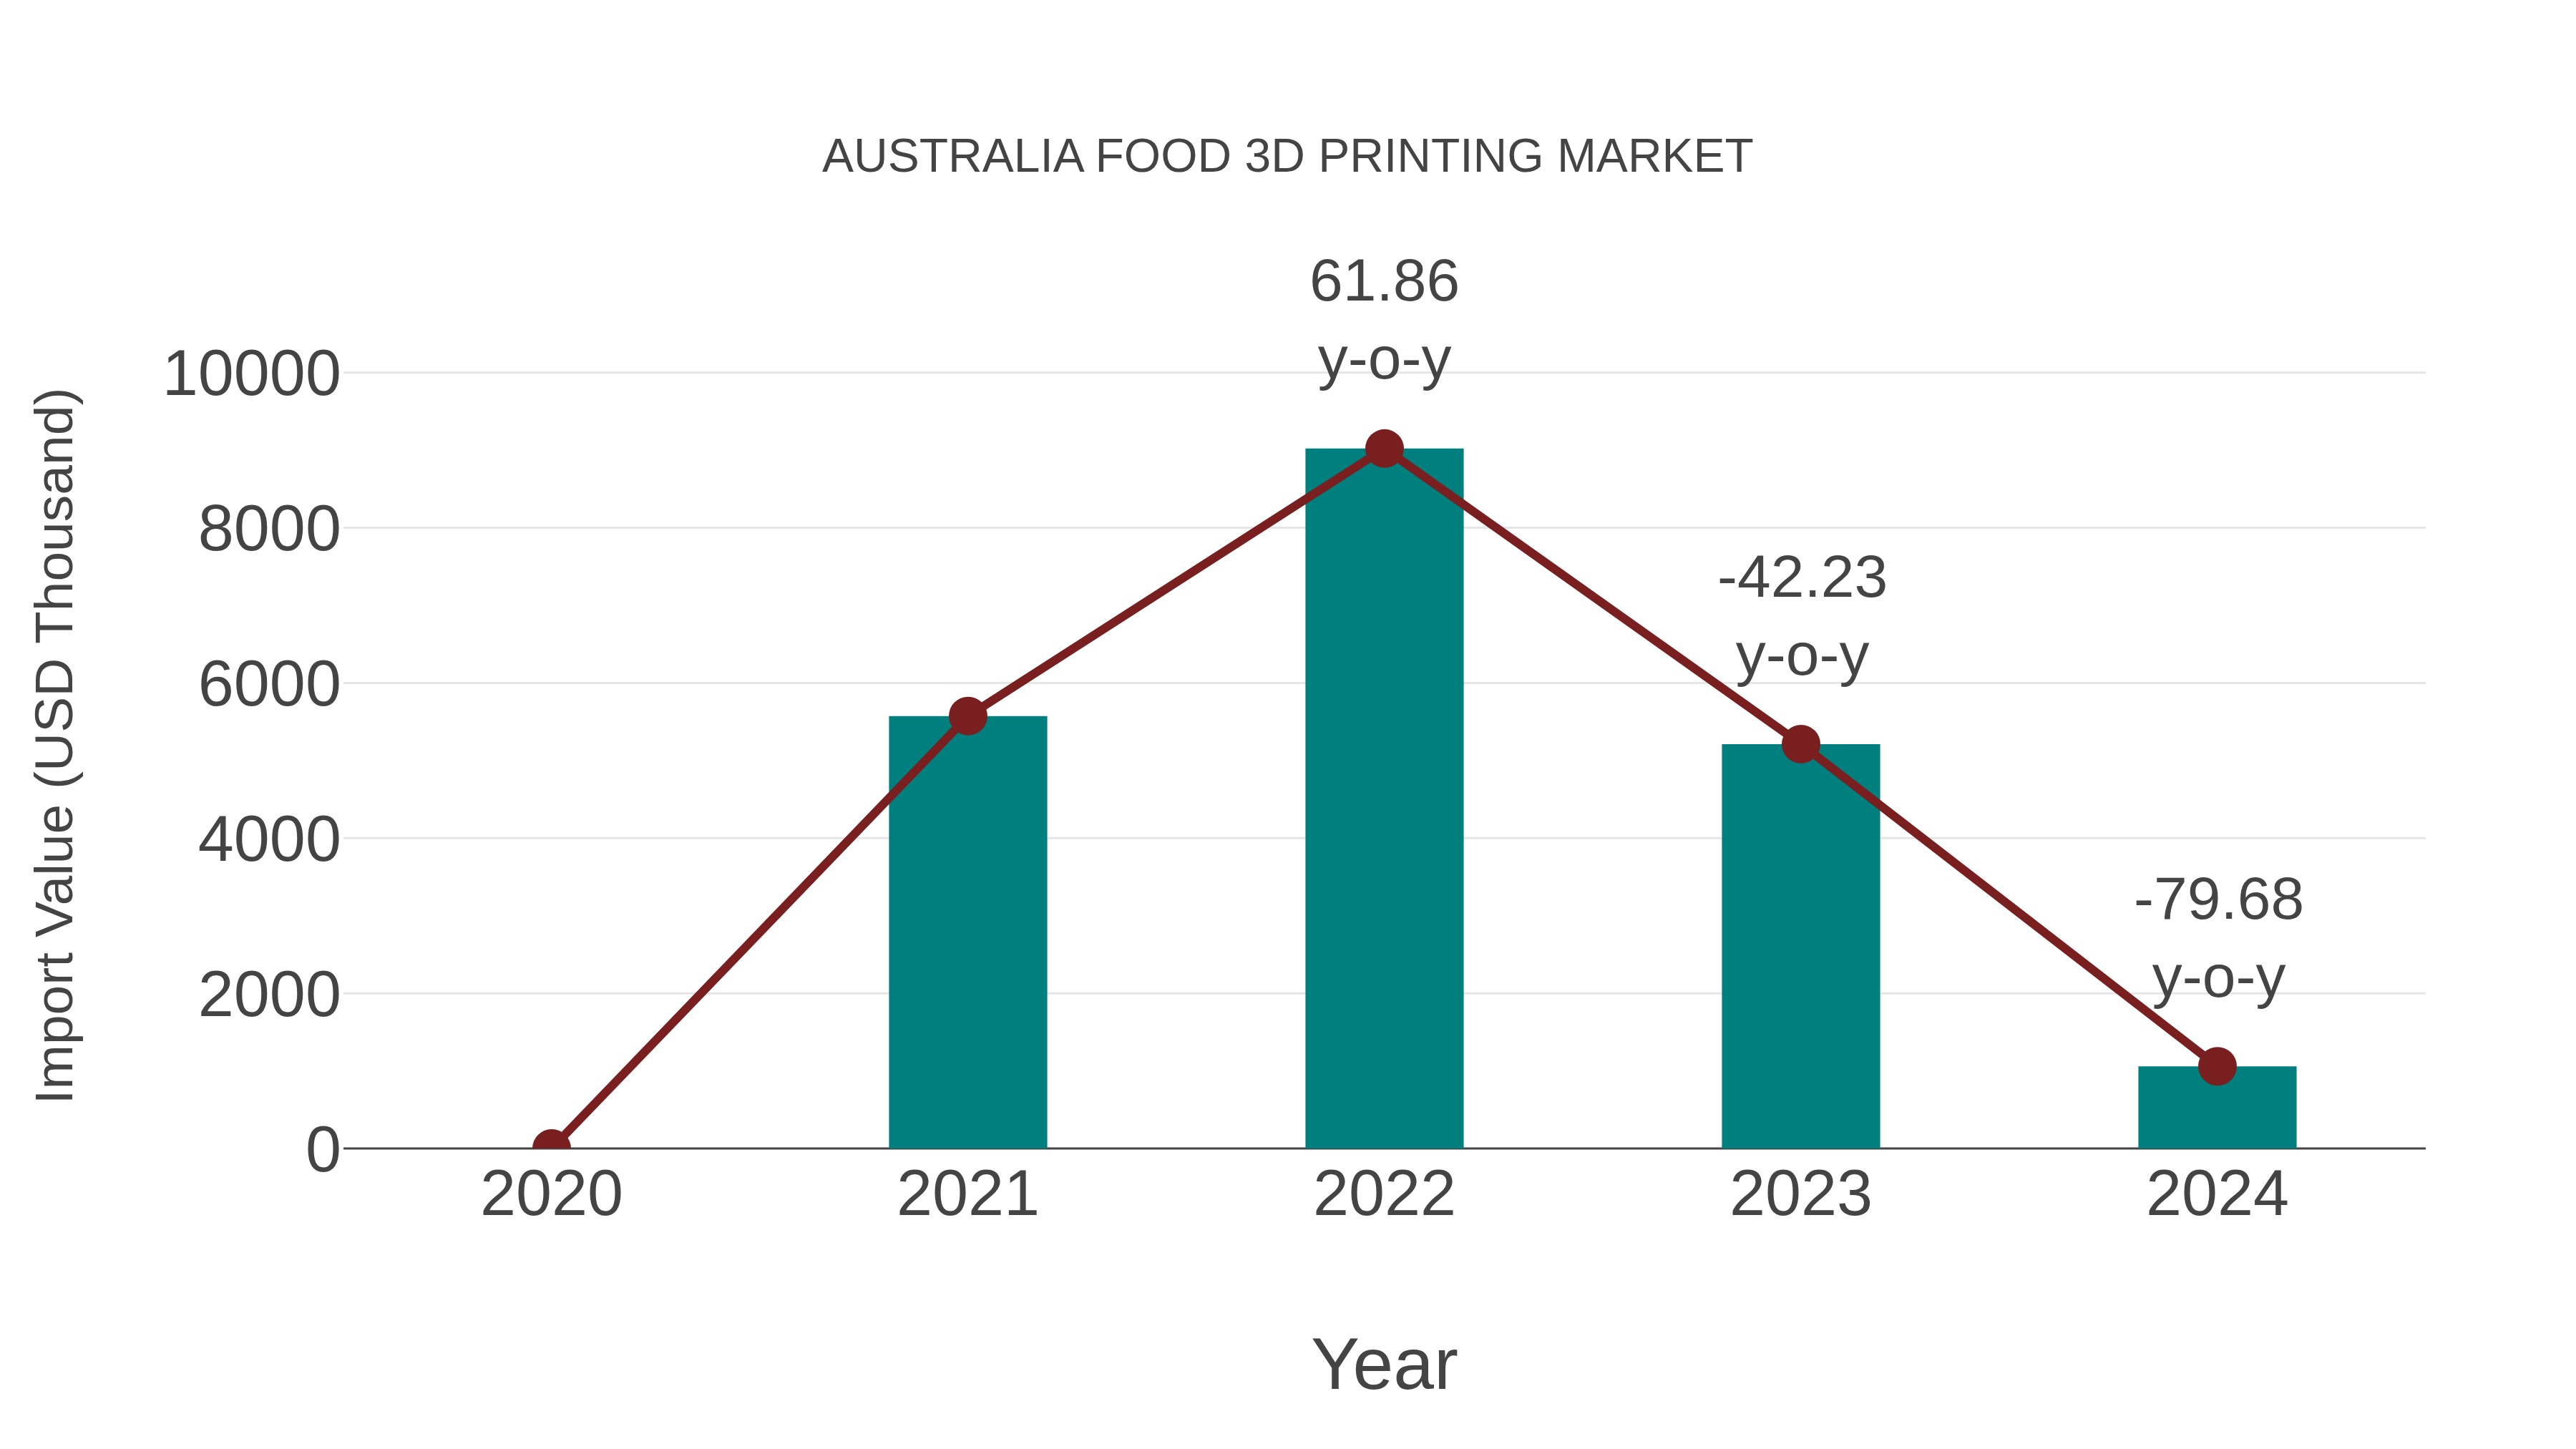
Australia Food 3d Printing Market: Import Trend Analysis
In the Australia food 3D printing market, the import trend experienced a significant decline from 2023 to 2024, with a growth rate of -79.68%. The compound annual growth rate (CAGR) for imports from 2020 to 2024 stood at -42.51%. This substantial downturn could be attributed to shifting consumer preferences, changes in trade policies, or market saturation impacting import momentum and demand dynamics.
Australia Food 3d Printing Market Overview
The food 3D printing market in Australia is in its early stages but shows promising potential, particularly in sectors such as personalized nutrition, aged care, and gourmet dining. Advancements in food-grade 3D printing technologies and increased experimentation by foodtech startups are helping this niche market gain attention and investment.
Trends of the market
Australias food 3D printing market is seeing growing interest from food tech startups and research institutions focusing on customized nutrition and sustainable food production. The trend is particularly noticeable in sectors like aged care, where personalized meal textures and nutrition are essential. Theres also experimentation with plant-based and alternative proteins in printable food formulations.
Challenges of the market
The 3D food printing market in Australia struggles with high equipment costs and slow production speeds, which limit scalability. Consumer acceptance is also a hurdle, as skepticism remains around the taste, safety, and nutritional value of 3D-printed food.
Investment opportunities in the Market
The food 3D printing market in Australia is an emerging and innovative space offering significant investment opportunities. With increasing interest in personalized nutrition, novel food designs, and sustainable production methods, investors can tap into technology-driven transformation in food manufacturing. Collaborations with research institutions and food tech startups, as well as development of specialized printers and edible materials, can accelerate market growth.
Government Policy of the market
The emerging food 3D printing market is influenced by government regulations concerning food safety, technology standards, and innovation funding. FSANZ monitors the safety of foods produced via additive manufacturing to ensure they meet established food safety standards. Innovation grants and research support programs by the Australian government encourage development and adoption of advanced food technologies, including 3D food printing. Policies on intellectual property and digital manufacturing also affect industry growth.
Key Highlights of the Report:
- Australia Food 3D Printing Market Outlook
- Market Size of Australia Food 3D Printing Market, 2025
- Forecast of Australia Food 3D Printing Market, 2032
- Historical Data and Forecast of Australia Food 3D Printing Revenues & Volume for the Period 2022 - 2032F
- Australia Food 3D Printing Market Trend Evolution
- Australia Food 3D Printing Market Drivers and Challenges
- Australia Food 3D Printing Price Trends
- Australia Food 3D Printing Porter's Five Forces
- Australia Food 3D Printing Industry Life Cycle
- Historical Data and Forecast of Australia Food 3D Printing Market Revenues & Volume By Type for the Period 2022 - 2032F
- Historical Data and Forecast of Australia Food 3D Printing Market Revenues & Volume By Chocolates And Confectionery for the Period 2022 - 2032F
- Historical Data and Forecast of Australia Food 3D Printing Market Revenues & Volume By Bakery for the Period 2022 - 2032F
- Historical Data and Forecast of Australia Food 3D Printing Market Revenues & Volume By Meat And Seafood for the Period 2022 - 2032F
- Historical Data and Forecast of Australia Food 3D Printing Market Revenues & Volume By Other for the Period 2022 - 2032F
- Historical Data and Forecast of Australia Food 3D Printing Market Revenues & Volume By End User for the Period 2022 - 2032F
- Historical Data and Forecast of Australia Food 3D Printing Market Revenues & Volume By Government for the Period 2022 - 2032F
- Historical Data and Forecast of Australia Food 3D Printing Market Revenues & Volume By Commercial for the Period 2022 - 2032F
- Historical Data and Forecast of Australia Food 3D Printing Market Revenues & Volume By Residential for the Period 2022 - 2032F
- Australia Food 3D Printing Import Export Trade Statistics
- Market Opportunity Assessment By Type
- Market Opportunity Assessment By End User
- Australia Food 3D Printing Top Companies Market Share
- Australia Food 3D Printing Competitive Benchmarking By Technical and Operational Parameters
- Australia Food 3D Printing Company Profiles
- Australia Food 3D Printing Key Strategic Recommendations
Australia Food 3D Printing Market (2026-2032): FAQs
6Wresearch actively monitors the Australia Food 3D Printing Market and publishes its comprehensive annual report, highlighting emerging trends, growth drivers, revenue analysis, and forecast outlook. Our insights help businesses to make data-backed strategic decisions with ongoing market dynamics. Our analysts track relevent industries related to the Australia Food 3D Printing Market, allowing our clients with actionable intelligence and reliable forecasts tailored to emerging regional needs.
Yes, we provide customisation as per your requirements. To learn more, feel free to contact us on sales@6wresearch.com
1 Executive Summary |
2 Introduction |
2.1 Key Highlights of the Report |
2.2 Report Description |
2.3 Market Scope & Segmentation |
2.4 Research Methodology |
2.5 Assumptions |
3 Australia Food 3D Printing Market Overview |
3.1 Australia Country Macro Economic Indicators |
3.2 Australia Food 3D Printing Market Revenues & Volume, 2022 & 2032F |
3.3 Australia Food 3D Printing Market - Industry Life Cycle |
3.4 Australia Food 3D Printing Market - Porter's Five Forces |
3.5 Australia Food 3D Printing Market Revenues & Volume Share, By Type, 2022 & 2032F |
3.6 Australia Food 3D Printing Market Revenues & Volume Share, By End User, 2022 & 2032F |
4 Australia Food 3D Printing Market Dynamics |
4.1 Impact Analysis |
4.2 Market Drivers |
4.2.1 Increasing demand for customized and personalized food products |
4.2.2 Technological advancements in 3D printing technology |
4.2.3 Growing focus on sustainable and innovative food production methods |
4.3 Market Restraints |
4.3.1 High initial investment costs for setting up 3D printing infrastructure |
4.3.2 Limited awareness and adoption of 3D printed food products |
4.3.3 Regulatory challenges and concerns related to food safety and compliance |
5 Australia Food 3D Printing Market Trends |
6 Australia Food 3D Printing Market, By Types |
6.1 Australia Food 3D Printing Market, By Type |
6.1.1 Overview and Analysis |
6.1.2 Australia Food 3D Printing Market Revenues & Volume, By Type, 2022 - 2032F |
6.1.3 Australia Food 3D Printing Market Revenues & Volume, By Chocolates And Confectionery, 2022 - 2032F |
6.1.4 Australia Food 3D Printing Market Revenues & Volume, By Bakery, 2022 - 2032F |
6.1.5 Australia Food 3D Printing Market Revenues & Volume, By Meat And Seafood, 2022 - 2032F |
6.1.6 Australia Food 3D Printing Market Revenues & Volume, By Other, 2022 - 2032F |
6.2 Australia Food 3D Printing Market, By End User |
6.2.1 Overview and Analysis |
6.2.2 Australia Food 3D Printing Market Revenues & Volume, By Government, 2022 - 2032F |
6.2.3 Australia Food 3D Printing Market Revenues & Volume, By Commercial, 2022 - 2032F |
6.2.4 Australia Food 3D Printing Market Revenues & Volume, By Residential, 2022 - 2032F |
7 Australia Food 3D Printing Market Import-Export Trade Statistics |
7.1 Australia Food 3D Printing Market Export to Major Countries |
7.2 Australia Food 3D Printing Market Imports from Major Countries |
8 Australia Food 3D Printing Market Key Performance Indicators |
8.1 Percentage increase in the number of food companies adopting 3D printing technology |
8.2 Rate of growth in the development of new 3D printing materials for food applications |
8.3 Number of partnerships and collaborations between food companies and 3D printing technology providers |
9 Australia Food 3D Printing Market - Opportunity Assessment |
9.1 Australia Food 3D Printing Market Opportunity Assessment, By Type, 2022 & 2032F |
9.2 Australia Food 3D Printing Market Opportunity Assessment, By End User, 2022 & 2032F |
10 Australia Food 3D Printing Market - Competitive Landscape |
10.1 Australia Food 3D Printing Market Revenue Share, By Companies, 2025 |
10.2 Australia Food 3D Printing Market Competitive Benchmarking, By Operating and Technical Parameters |
11 Company Profiles |
12 Recommendations |
13 Disclaimer |
Global Go To Market Strategy - 2030
Export potential enables firms to identify high-growth global markets with greater confidence by combining advanced trade intelligence with a structured quantitative methodology. The framework analyzes emerging demand trends and country-level import patterns while integrating macroeconomic and trade datasets such as GDP and population forecasts, bilateral import–export flows, tariff structures, elasticity differentials between developed and developing economies, geographic distance, and import demand projections. Using weighted trade values from 2020–2024 as the base period to project country-to-country export potential for 2030, these inputs are operationalized through calculated drivers such as gravity model parameters, tariff impact factors, and projected GDP per-capita growth. Through an analysis of hidden potentials, demand hotspots, and market conditions that are most favorable to success, this method enables firms to focus on target countries, maximize returns, and global expansion with data, backed by accuracy.
By factoring in the projected importer demand gap that is currently unmet and could be potential opportunity, it identifies the potential for the Exporter (Country) among 190 countries, against the general trade analysis, which identifies the biggest importer or exporter.
To discover high-growth global markets and optimize your business strategy:
Click Here
Pricing
- Single User License$ 1,995
- Department License$ 2,400
- Site License$ 3,120
- Global License$ 3,795

Leadership Perspectives from Industry Events
Search
Thought Leadership and Analyst Meet


Our Clients
6WResearch In News
- India Export Attractiveness Tracker 2026
- India Air Conditioner Market Set for Strong Rebound in 2026 After Weather-Led Correction and GST-Driven Recovery: 6Wresearch
- ADAS in India: How Automatic Emergency Braking, Blind Spot Detection & Driver Monitoring are Transforming Road Safety
- Doha a strategic location for EV manufacturing hub: IPA Qatar
- Demand for luxury TVs surging in the GCC, says Samsung
- Empowering Growth: The Thriving Journey of Bangladesh’s Cable Industry
Latest Reports
- Nicaragua RPG Gaming Market (2026-2032)
- New Zealand RPG Gaming Market (2026-2032)
- Netherlands RPG Gaming Market (2026-2032)
- Nauru RPG Gaming Market (2026-2032)
- Namibia RPG Gaming Market (2026-2032)
- Mozambique RPG Gaming Market (2026-2032)
- Montenegro RPG Gaming Market (2026-2032)
- Mongolia RPG Gaming Market (2026-2032)
- Monaco RPG Gaming Market (2026-2032)
- Micronesia RPG Gaming Market (2026-2032)
Industry Events and Analyst Meet

EV India Expo 2026

HIMTEX 2026

India Refining Summit 2026

India EV Show 2026

EV tech India Expo 2026
Whitepaper
- Middle East & Africa Commercial Security Market Click here to view more.
- Middle East & Africa Fire Safety Systems & Equipment Market Click here to view more.
- GCC Drone Market Click here to view more.
- Middle East Lighting Fixture Market Click here to view more.
- GCC Physical & Perimeter Security Market Click here to view more.