Australia Food Colors Market (2026-2032) | Trends, Share, Outlook, Revenue, Growth, Value, Analysis, Industry, Forecast, Size & Companies
Market Forecast By Type (Natural, Synthetic, Nature Identical), By Application (Food Products, Beverages), By Form (Liquid, Powder, Gel), By Solubility (Dyes, Lakes) And Competitive Landscape
| Product Code: ETC325715 | Publication Date: Aug 2022 | Updated Date: Mar 2026 | Product Type: Market Research Report | |
| Publisher: 6Wresearch | Author: Shubham Padhi | No. of Pages: 70 | No. of Figures: 35 | No. of Tables: 5 |
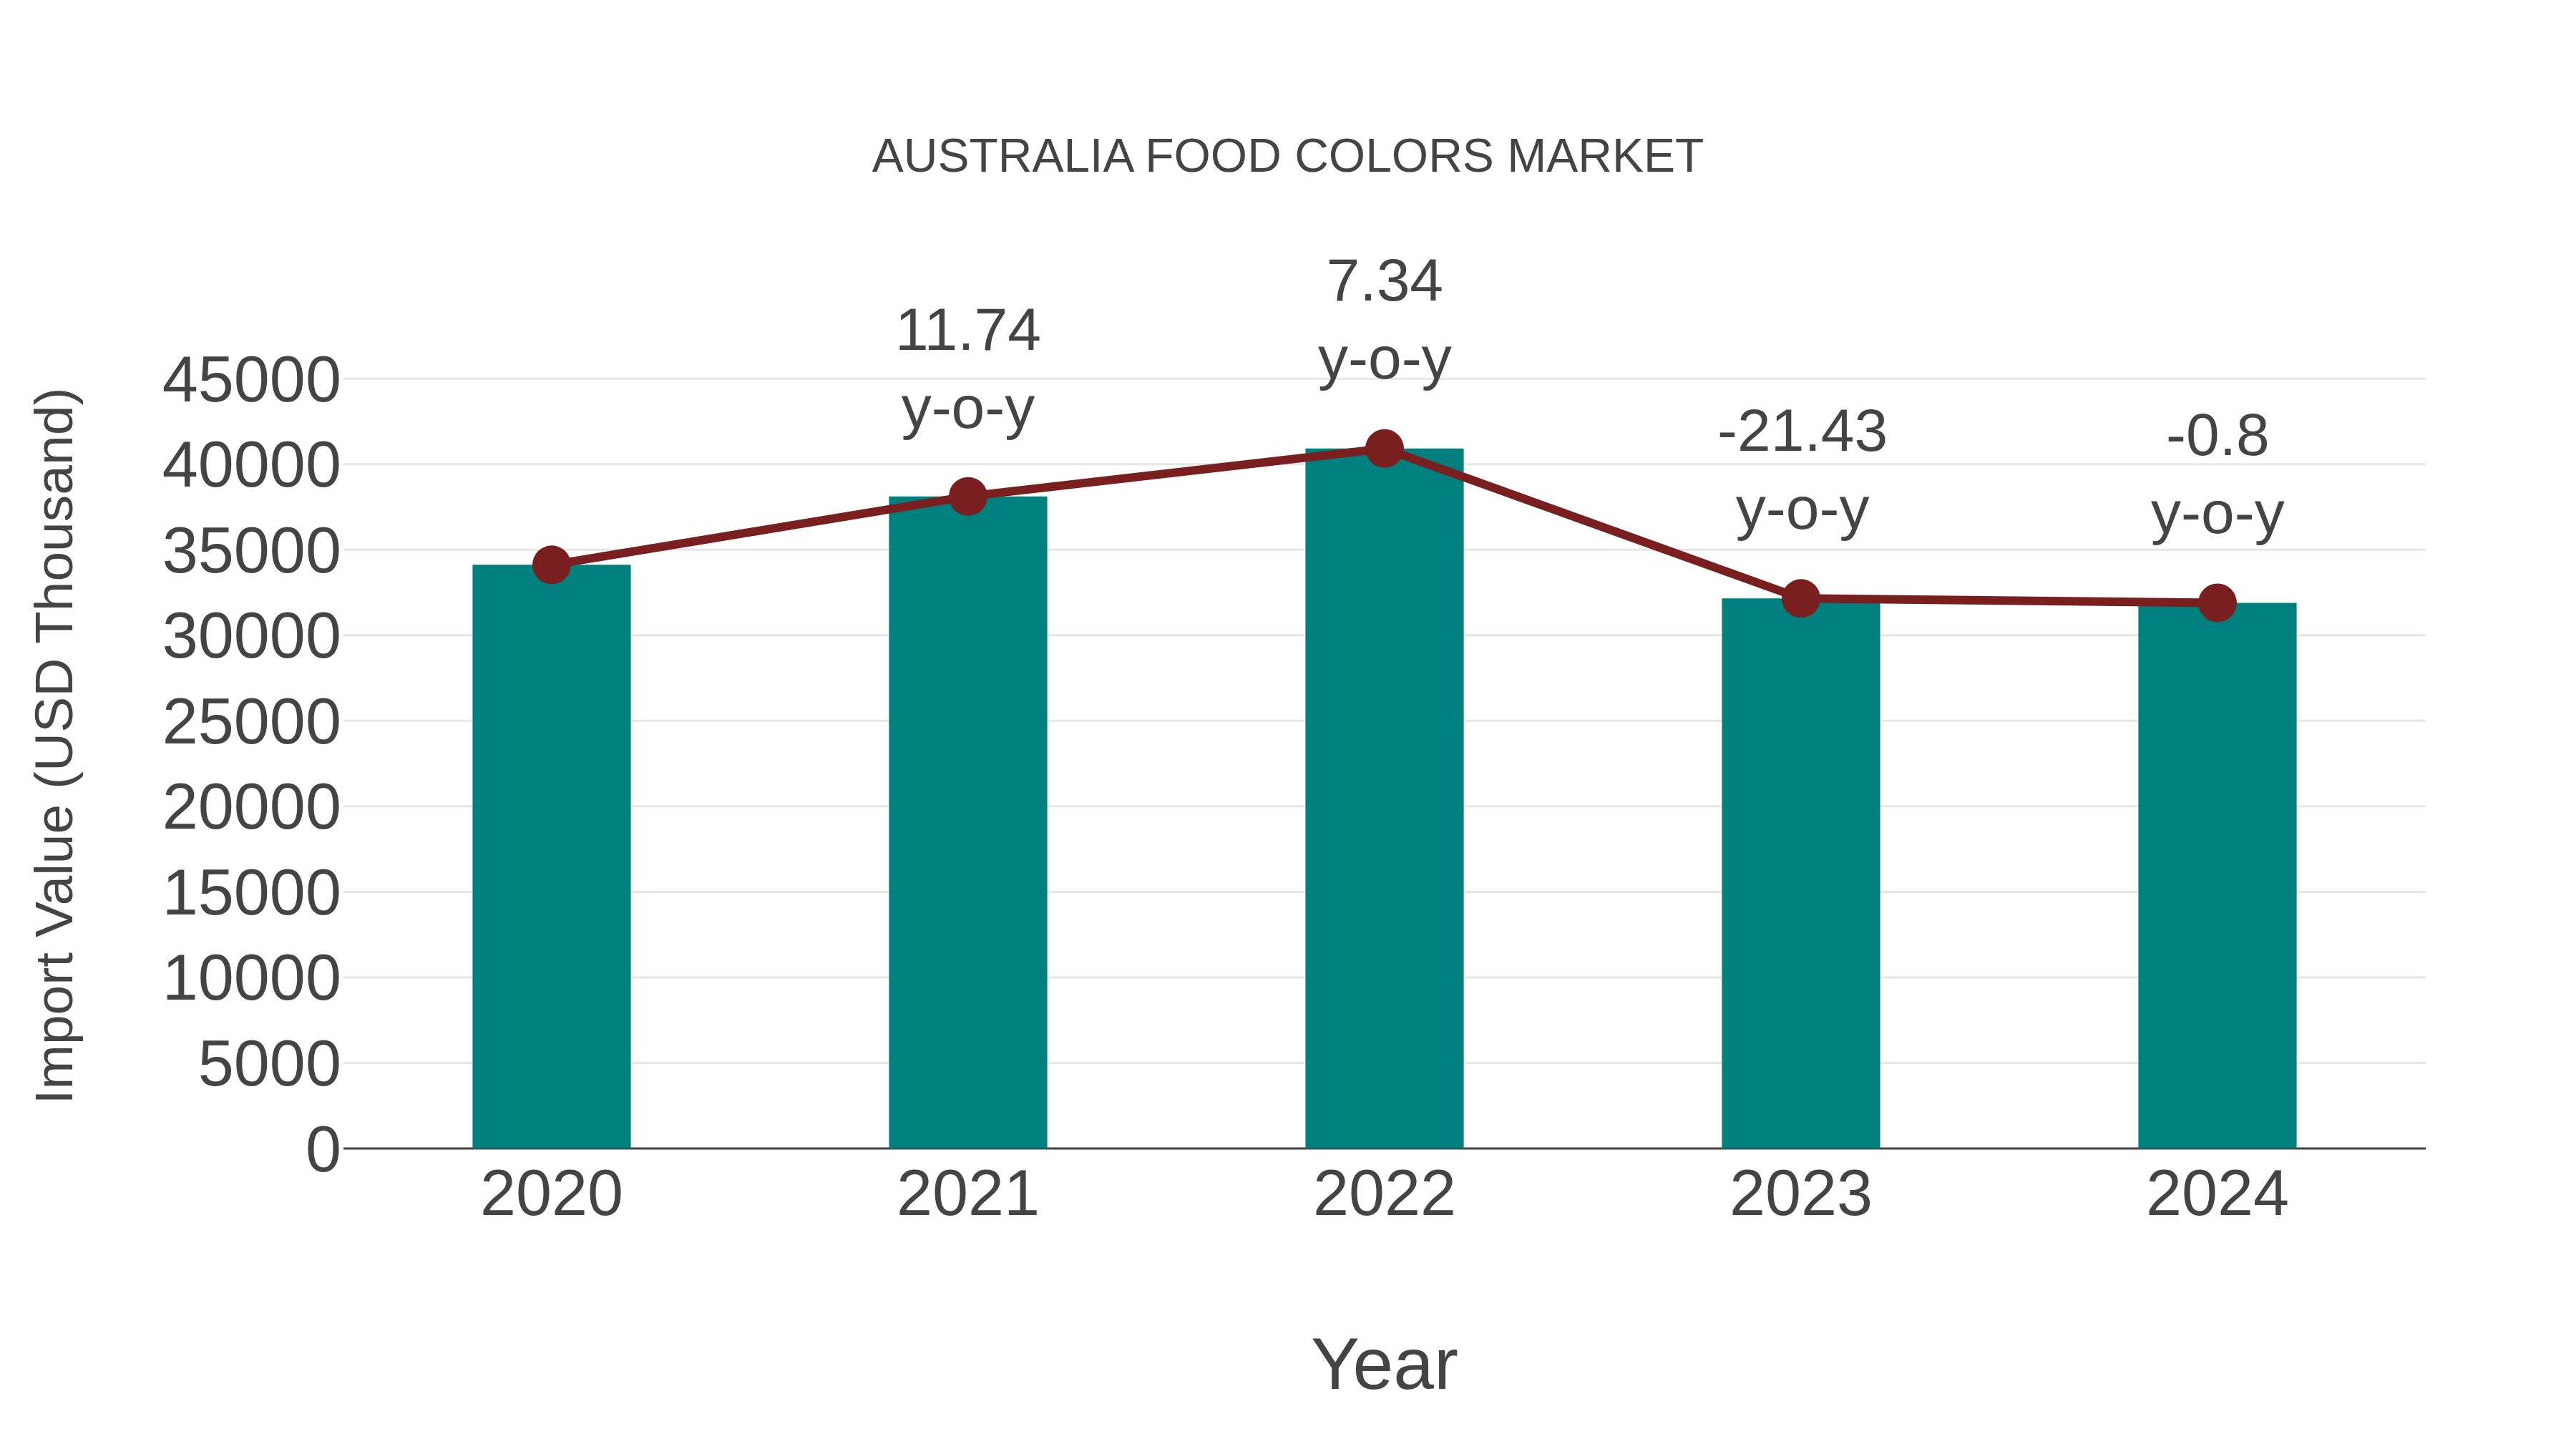
Australia Food Colors Market: Import Trend Analysis
Australia`s import trend for food colors in 2024 saw a decline, with a growth rate of -0.8% compared to the previous year. The compound annual growth rate (CAGR) from 2020 to 2024 was -1.67%. This negative import momentum could be attributed to shifts in consumer preferences or changes in domestic production capacity impacting market stability.
Australia Food Colors Market Highlights
| Report Name | Australia Food Colors Market |
| Forecast period | 2025-2031 |
| CAGR | 4% |
| Growing Sector | Food |
Topics Covered in the Australia Food Colors Market Report
Australia Food Colors Market report thoroughly covers the market by type, application, form and solubility. The market outlook report provides an unbiased and detailed analysis of the ongoing market trends, opportunities/high growth areas, and market drivers which would help the stakeholders to devise and align their market strategies according to the current and future market dynamics.
Australia Food Colors Market Synopsis
Australia Food Colors Market is undergoing a significant transformation, driven by evolving consumer preferences towards healthier and more natural products. This shift has encouraged both international and Australian companies to innovate and expand their portfolios with colors derived from natural and sustainable sources. The market is characterized by a growing demand for clean label products, pushing manufacturers to adopt practices that are not only safe but also environmentally friendly. Regulatory bodies such as FSANZ and NHMRC play crucial roles in overseeing the market, ensuring that the food colors used comply with the highest safety standards. With the support of the Clean Label movement and ongoing research and development, the Australian food colors industry is poised for continued growth, focusing on natural, organic, and innovative color solutions that meet consumer expectations.
According to 6Wresearch, the Australia Food Colors Market size is projected to grow at the CAGR of 4% during the forecast period of 2025-2031. The main driver of the food colors market in Australia is the growing demand for processed and packaged food products. With a busy lifestyle, consumers are increasingly opting for convenient and ready-to-eat meals, which often contain added food colors to make them more visually appealing. Moreover, the rise in health consciousness among consumers has led to a shift towards natural and organic ingredients, including natural food colors. This has opened up opportunities for manufacturers to offer healthier alternatives to synthetic food colors. Despite the growth of the market, there are some challenges faced by the food colors industry in Australia. One of the biggest challenges is strict regulations and labeling requirements set by the Australian government. Manufacturers must ensure that their products comply with these regulations, which can be a time-consuming and costly process. Another challenge is the negative perception associated with artificial food colors and their potential health risks. This has led to a growing demand for natural food colors, putting pressure on manufacturers to reformulate their products.
Government policies and schemes introduced in the Australia Food Colors Market
The Australian government has implemented several policies and schemes aimed at ensuring the safety and quality of food colors used in the market. Regulatory bodies, like Food Standards Australia New Zealand (FSANZ), oversee the approval and use of food additives, including colors, to ensure they meet stringent safety standards before they are allowed in food products. The National Health and Medical Research Council (NHMRC) also plays a vital role in providing guidelines for the consumption of additives, promoting the use of natural and safer alternatives whenever possible. Additionally, the Clean Label movement, supported by the government, encourages manufacturers to reduce the use of artificial colors in favor of natural ones, fostering a transparent and healthy food industry.
Leading players in the Australia Food Colors Market
The Australia food colors industry features a mix of global giants and local players who are key contributors to the industry's growth. Major companies such as Chr. Hansen Holding A/S, Sensient Technologies Corporation, and the Döhler Group, are recognized for their innovative approaches in producing natural and organic colors, aligning with consumer demands for clean and sustainable products. Local Australian companies, including Botanical Innovations and Queen Fine Foods, have also made significant strides, specializing in natural color solutions derived from local sources. These companies are at the forefront of research and development, leveraging Australia's rich biodiversity to create unique colorants that set them apart in the competitive market.
Future Insight of the Australia Food Colors Market
The food colors market in Australia is expected to continue its growth trajectory in the coming years. The increasing demand for natural and organic food products, coupled with government initiatives to promote clean-label ingredients, will drive the market growth.Moreover, advancements in technology have enabled manufacturers to develop new and innovative ways of producing natural food colors. This is expected to further boost the market growth as consumers increasingly seek out healthier alternatives to artificial food colors.
Market analysis by Type
The natural segment is expected to grow in the Australia food colors market due to increasing consumer demand for clean and natural products. With the government's support of the Clean Label movement and stricter regulations on artificial additives, manufacturers are shifting towards using natural colors in their products. This trend is further fueled by growing health concerns and a preference for sustainable and ethical sourcing and these factors have led to Australia Food Colors Market Growth.
Market analysis By Applications
According to Dhaval, Research Manager, 6Wresearch, the food products segment is expected to have the highest growth rate in the Australia food colors market, driven by the increasing demand for natural and clean label ingredients in various food categories. This is further supported by the rising awareness among consumers about the potential health risks associated with synthetic food colors
Key attractiveness of the report
- 10 Years Market Numbers.
- Historical Data Starting from 2021 to 2024.
- Base Year: 2024.
- Forecast Data until 2031.
- Key Performance Indicators Impacting the Market.
- Major Upcoming Developments and Projects.
Key Highlights of the Report:
- Australia Food Colors Market Outlook
- Market Size of Australia Food Colors Market, 2025
- Forecast of Australia Food Colors Market, 2032
- Historical Data and Forecast of Australia Food Colors Revenues & Volume for the Period 2022-2032F
- Australia Food Colors Market Trend Evolution
- Australia Food Colors Market Drivers and Challenges
- Australia Food Colors Price Trends
- Australia Food Colors Porter's Five Forces
- Australia Food Colors Industry Life Cycle
- Historical Data and Forecast of Australia Food Colors Market Revenues & Volume By Type for the Period 2022-2032F
- Historical Data and Forecast of Australia Food Colors Market Revenues & Volume By Natural for the Period 2022-2032F
- Historical Data and Forecast of Australia Food Colors Market Revenues & Volume By Synthetic for the Period 2022-2032F
- Historical Data and Forecast of Australia Food Colors Market Revenues & Volume By Nature Identical for the Period 2022-2032F
- Historical Data and Forecast of Australia Food Colors Market Revenues & Volume By Application for the Period 2022-2032F
- Historical Data and Forecast of Australia Food Colors Market Revenues & Volume By Food Products for the Period 2022-2032F
- Historical Data and Forecast of Australia Food Colors Market Revenues & Volume By Beverages for the Period 2022-2032F
- Historical Data and Forecast of Australia Food Colors Market Revenues & Volume By Form for the Period 2022-2032F
- Historical Data and Forecast of Australia Food Colors Market Revenues & Volume By Liquid for the Period 2022-2032F
- Historical Data and Forecast of Australia Food Colors Market Revenues & Volume By Powder for the Period 2022-2032F
- Historical Data and Forecast of Australia Food Colors Market Revenues & Volume By Gel for the Period 2022-2032F
- Historical Data and Forecast of Australia Food Colors Market Revenues & Volume By Solubility for the Period 2022-2032F
- Historical Data and Forecast of Australia Food Colors Market Revenues & Volume By Dyes for the Period 2022-2032F
- Historical Data and Forecast of Australia Food Colors Market Revenues & Volume By Lakes for the Period 2022-2032F
- Australia Food Colors Import Export Trade Statistics
- Market Opportunity Assessment By Type
- Market Opportunity Assessment By Application
- Market Opportunity Assessment By Form
- Market Opportunity Assessment By Solubility
- Australia Food Colors Top Companies Market Share
- Australia Food Colors Competitive Benchmarking By Technical and Operational Parameters
- Australia Food Colors Company Profiles
- Australia Food Colors Key Strategic Recommendations
Market Covered
The report offers a comprehensive study of the subsequent market segments:
By Type
- Natural
- Synthetic
- Nature Identical
By Application
- Food Products
- Beverages
By Form
- Liquid
- Powder
- Gel
By Solubility
- Dyes
- Lakes
Australia Food Colors Market (2026-2032): FAQs
Natural food colors are derived from natural sources such as fruits, vegetables, plants, and minerals. They are used to add or restore color in food and beverages.
The shift towards natural food colors is driven by increased consumer awareness of health and wellness, growing concerns over artificial additives, and a rising preference for clean label products that are free from synthetic ingredients.
Major companies such as Chr. Hansen Holding A/S, Sensient Technologies Corporation, and the Döhler Group are operating in the Australia Food Colors Market.
One of the biggest challenges is strict regulations and labeling requirements set by the Australian government.
6Wresearch actively monitors the Australia Food Colors Market and publishes its comprehensive annual report, highlighting emerging trends, growth drivers, revenue analysis, and forecast outlook. Our insights help businesses to make data-backed strategic decisions with ongoing market dynamics. Our analysts track relevent industries related to the Australia Food Colors Market, allowing our clients with actionable intelligence and reliable forecasts tailored to emerging regional needs.
Yes, we provide customisation as per your requirements. To learn more, feel free to contact us on sales@6wresearch.com
| 1 Executive Summary |
| 2 Introduction |
| 2.1 Key Highlights of the Report |
| 2.2 Report Description |
| 2.3 Market Scope & Segmentation |
| 2.4 Research Methodology |
| 2.5 Assumptions |
| 3 Australia Food Colors Market Overview |
| 3.1 Australia Country Macro Economic Indicators |
| 3.2 Australia Food Colors Market Revenues & Volume, 2022 & 2032F |
| 3.3 Australia Food Colors Market - Industry Life Cycle |
| 3.4 Australia Food Colors Market - Porter's Five Forces |
| 3.5 Australia Food Colors Market Revenues & Volume Share, By Type, 2022 & 2032F |
| 3.6 Australia Food Colors Market Revenues & Volume Share, By Application, 2022 & 2032F |
| 3.7 Australia Food Colors Market Revenues & Volume Share, By Form, 2022 & 2032F |
| 3.8 Australia Food Colors Market Revenues & Volume Share, By Solubility, 2022 & 2032F |
| 4 Australia Food Colors Market Dynamics |
| 4.1 Impact Analysis |
| 4.2 Market Drivers |
| 4.2.1 Increasing consumer awareness about the health benefits of natural food colors |
| 4.2.2 Growing demand for clean label and organic food products |
| 4.2.3 Expansion of food and beverage industry in Australia |
| 4.3 Market Restraints |
| 4.3.1 Stringent regulations regarding the use of food colors in products |
| 4.3.2 Fluctuating prices of raw materials |
| 4.3.3 Limited availability of certain natural food color sources |
| 5 Australia Food Colors Market Trends |
| 6 Australia Food Colors Market, By Types |
| 6.1 Australia Food Colors Market, By Type |
| 6.1.1 Overview and Analysis |
| 6.1.2 Australia Food Colors Market Revenues & Volume, By Type, 2022-2032F |
| 6.1.3 Australia Food Colors Market Revenues & Volume, By Natural, 2022-2032F |
| 6.1.4 Australia Food Colors Market Revenues & Volume, By Synthetic, 2022-2032F |
| 6.1.5 Australia Food Colors Market Revenues & Volume, By Nature Identical, 2022-2032F |
| 6.2 Australia Food Colors Market, By Application |
| 6.2.1 Overview and Analysis |
| 6.2.2 Australia Food Colors Market Revenues & Volume, By Food Products, 2022-2032F |
| 6.2.3 Australia Food Colors Market Revenues & Volume, By Beverages, 2022-2032F |
| 6.3 Australia Food Colors Market, By Form |
| 6.3.1 Overview and Analysis |
| 6.3.2 Australia Food Colors Market Revenues & Volume, By Liquid, 2022-2032F |
| 6.3.3 Australia Food Colors Market Revenues & Volume, By Powder, 2022-2032F |
| 6.3.4 Australia Food Colors Market Revenues & Volume, By Gel, 2022-2032F |
| 6.4 Australia Food Colors Market, By Solubility |
| 6.4.1 Overview and Analysis |
| 6.4.2 Australia Food Colors Market Revenues & Volume, By Dyes, 2022-2032F |
| 6.4.3 Australia Food Colors Market Revenues & Volume, By Lakes, 2022-2032F |
| 7 Australia Food Colors Market Import-Export Trade Statistics |
| 7.1 Australia Food Colors Market Export to Major Countries |
| 7.2 Australia Food Colors Market Imports from Major Countries |
| 8 Australia Food Colors Market Key Performance Indicators |
| 8.1 Consumer preferences towards natural food colors |
| 8.2 Adoption rate of clean label food products in the market |
| 8.3 Innovation and development of new food color technologies |
| 9 Australia Food Colors Market - Opportunity Assessment |
| 9.1 Australia Food Colors Market Opportunity Assessment, By Type, 2022 & 2032F |
| 9.2 Australia Food Colors Market Opportunity Assessment, By Application, 2022 & 2032F |
| 9.3 Australia Food Colors Market Opportunity Assessment, By Form, 2022 & 2032F |
| 9.4 Australia Food Colors Market Opportunity Assessment, By Solubility, 2022 & 2032F |
| 10 Australia Food Colors Market - Competitive Landscape |
| 10.1 Australia Food Colors Market Revenue Share, By Companies, 2025 |
| 10.2 Australia Food Colors Market Competitive Benchmarking, By Operating and Technical Parameters |
| 11 Company Profiles |
| 12 Recommendations |
| 13 Disclaimer |
Global Go To Market Strategy - 2030
Export potential enables firms to identify high-growth global markets with greater confidence by combining advanced trade intelligence with a structured quantitative methodology. The framework analyzes emerging demand trends and country-level import patterns while integrating macroeconomic and trade datasets such as GDP and population forecasts, bilateral import–export flows, tariff structures, elasticity differentials between developed and developing economies, geographic distance, and import demand projections. Using weighted trade values from 2020–2024 as the base period to project country-to-country export potential for 2030, these inputs are operationalized through calculated drivers such as gravity model parameters, tariff impact factors, and projected GDP per-capita growth. Through an analysis of hidden potentials, demand hotspots, and market conditions that are most favorable to success, this method enables firms to focus on target countries, maximize returns, and global expansion with data, backed by accuracy.
By factoring in the projected importer demand gap that is currently unmet and could be potential opportunity, it identifies the potential for the Exporter (Country) among 190 countries, against the general trade analysis, which identifies the biggest importer or exporter.
To discover high-growth global markets and optimize your business strategy:
Click Here
Pricing
- Single User License$ 1,995
- Department License$ 2,400
- Site License$ 3,120
- Global License$ 3,795

Leadership Perspectives from Industry Events
Search
Thought Leadership and Analyst Meet


Our Clients
6WResearch In News
- India Air Conditioner Market Set for Strong Rebound in 2026 After Weather-Led Correction and GST-Driven Recovery: 6Wresearch
- ADAS in India: How Automatic Emergency Braking, Blind Spot Detection & Driver Monitoring are Transforming Road Safety
- Doha a strategic location for EV manufacturing hub: IPA Qatar
- Demand for luxury TVs surging in the GCC, says Samsung
- Empowering Growth: The Thriving Journey of Bangladesh’s Cable Industry
- Demand for luxury TVs surging in the GCC, says Samsung
Latest Reports
- Nicaragua RPG Gaming Market (2026-2032)
- New Zealand RPG Gaming Market (2026-2032)
- Netherlands RPG Gaming Market (2026-2032)
- Nauru RPG Gaming Market (2026-2032)
- Namibia RPG Gaming Market (2026-2032)
- Mozambique RPG Gaming Market (2026-2032)
- Montenegro RPG Gaming Market (2026-2032)
- Mongolia RPG Gaming Market (2026-2032)
- Monaco RPG Gaming Market (2026-2032)
- Micronesia RPG Gaming Market (2026-2032)
Industry Events and Analyst Meet

EV India Expo 2026

HIMTEX 2026

India Refining Summit 2026

India EV Show 2026

EV tech India Expo 2026
Whitepaper
- Middle East & Africa Commercial Security Market Click here to view more.
- Middle East & Africa Fire Safety Systems & Equipment Market Click here to view more.
- GCC Drone Market Click here to view more.
- Middle East Lighting Fixture Market Click here to view more.
- GCC Physical & Perimeter Security Market Click here to view more.