Australia Graphing Calculator Market (2026-2032) Outlook | Trends, Forecast, Size, Industry, Analysis, Share, Revenue, Companies, Value & Growth
Market Forecast By Display (Colored, Black & White), By Application (Education, Gaming, Others) And Competitive Landscape
| Product Code: ETC364655 | Publication Date: Aug 2022 | Updated Date: Jul 2026 | Product Type: Market Research Report | |
| Publisher: 6Wresearch | Author: Shubham Padhi | No. of Pages: 75 | No. of Figures: 35 | No. of Tables: 20 |
Australia Graphing Calculator Market Size, Share & Growth Rate
The Australia Graphing Calculator Market was estimated at USD 128 Million in 2025 and is projected to reach USD 151 Million by 2032, growing at a CAGR of 2.4% from 2026 to 2032. This growth is largely driven by the increasing integration of graphing calculators into educational curricula, emphasizing STEM education across Australian institutions. Furthermore, the demand for advanced features, such as real-time data analysis and enhanced graphing capabilities, is shaping a favorable market trajectory, as students and professionals alike seek tools that can facilitate complex mathematical computations.
Australia Graphing Calculator Market Year-wise Growth Rate and Key Drivers
This graph highlights how the Australia Graphing Calculator Market has steadily grown over the years, supported by major growth factors.
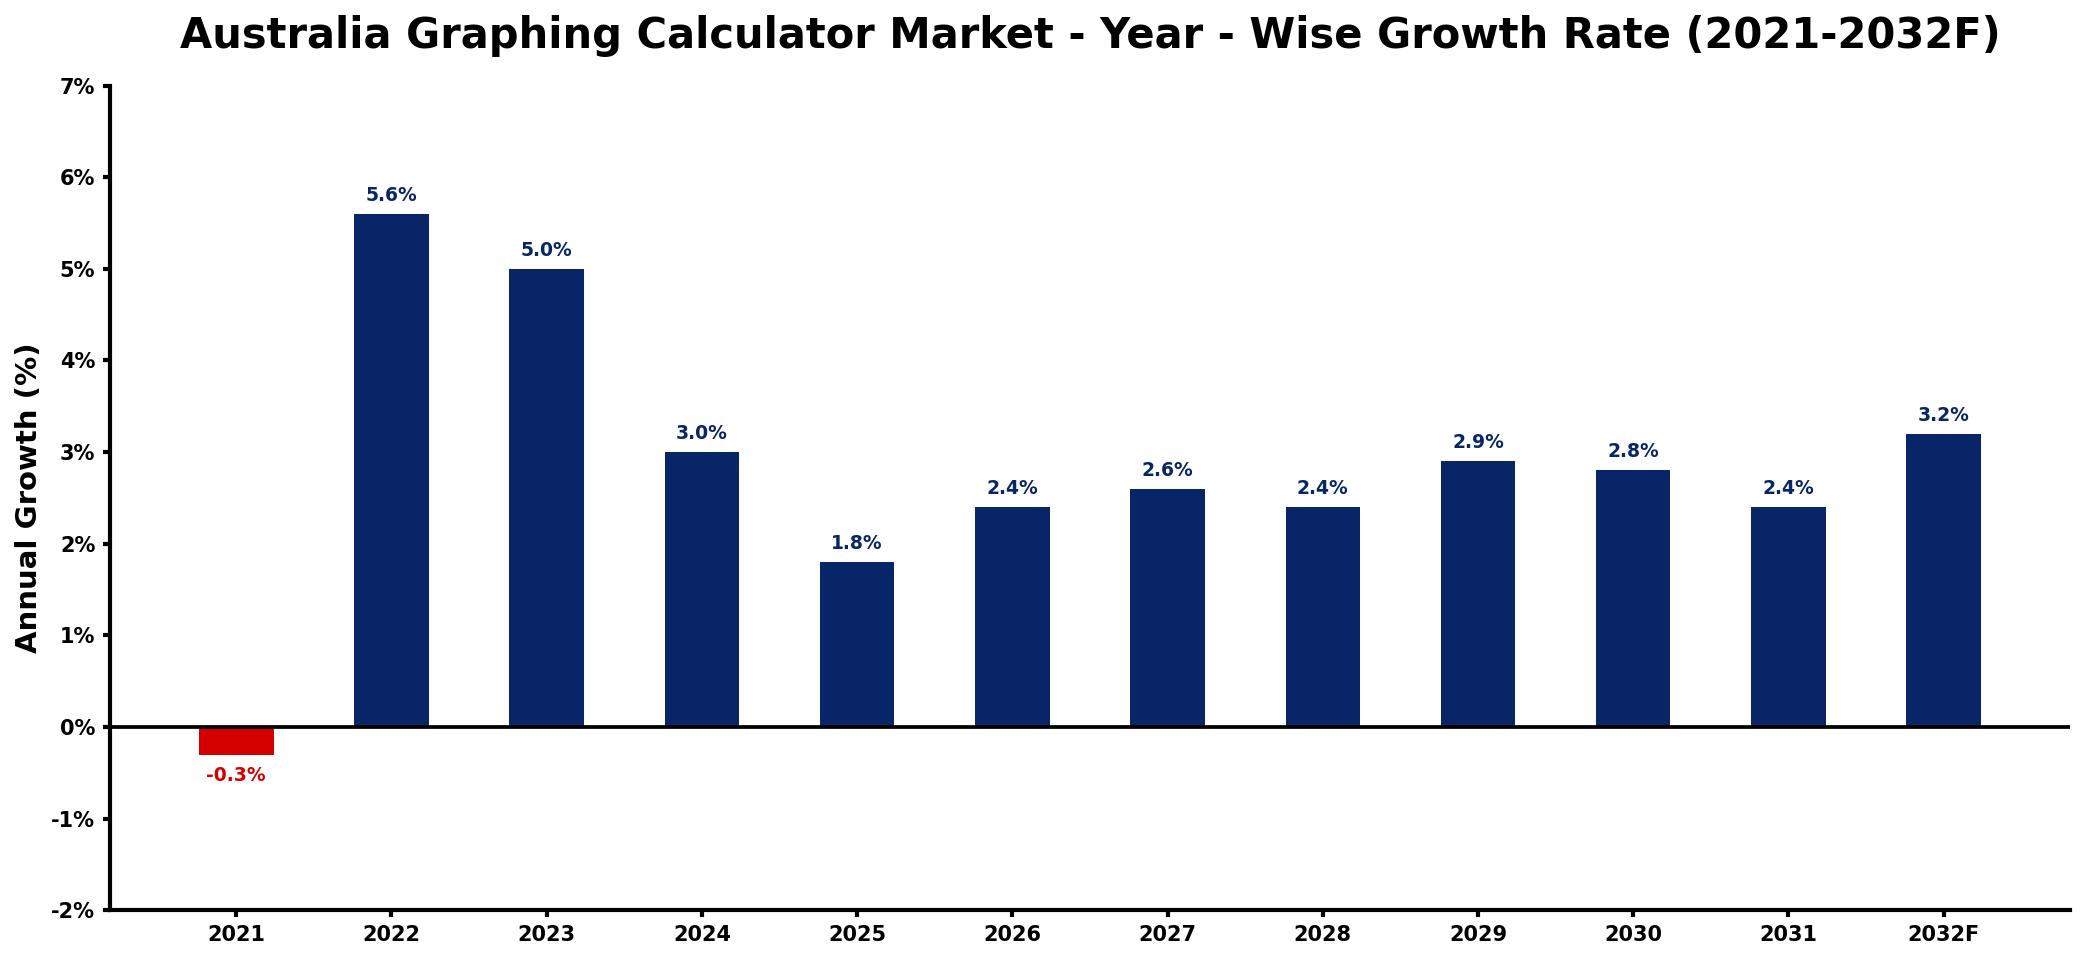
The table below presents the year‑wise growth rates along with the key drivers influencing the market
| Year | Growth Rate | Major Drivers |
| 2021 | -0.3% | decreased educational funding allocations |
| 2022 | 5.6% | increased STEM program investments |
| 2023 | 5.0% | growing online learning platforms |
| 2024 | 3.0% | rising demand for digital tools |
| 2025 | 1.8% | expansion of remote education initiatives |
| 2026 | 2.4% | enhanced focus on technology integration |
| 2027 | 2.6% | growing adoption of hybrid learning |
| 2028 | 2.4% | increased focus on interactive learning |
| 2029 | 2.9% | enhanced product quality standards |
| 2030 | 2.8% | growing interest in skill development |
| 2031 | 2.4% | increased pharmaceutical industry usage |
| 2032 | 3.2% | increased collaboration with tech companies |
Note: Market size estimations and growth projections presented in this report are based on 6Wresearch's proprietary forecasting methodology, utilizing the latest available industry data, government publications, and primary research inputs.
Australia Graphing Calculator Market Synopsis
In Australia, graphing calculators have become indispensable in both academic and professional settings, aiding in the visualization of mathematical concepts. With a focus on digital literacy and innovative teaching methods, schools are increasingly adopting these tools as part of their core resources.
As educational systems in Australia evolve, graphing calculators are playing an essential role in enhancing students' analytical and problem-solving skills. The rising trend of incorporating these calculators into standardized testing further fuels their relevance in the marketplace.
Australia Graphing Calculator Market Key Takeaways
- The Australian educational sector is a primary driver for the adoption of graphing calculators.
- Technological advancements in these devices are meeting the evolving needs of both students and professionals.
- There is a significant push towards integrating graphing calculators in standardized assessments.
- Price sensitivity among consumers is shaping purchasing decisions, impacting market dynamics.
- Government policies promoting STEM education will continue to influence market growth positively.
Evaluation of Restraints in Australia Graphing Calculator Market
Despite its growth, the Australia Graphing Calculator Market faces several restraints. Technological obsolescence remains a pressing concern as mobile applications and software solutions increasingly offer alternative methods for complex computations, challenging the traditional calculator model. Additionally, pricing pressures due to competitive market dynamics create difficulties for manufacturers in establishing attractive price points. This challenge is compounded by the need for ongoing innovation to stay relevant in a landscape that values adaptability and cost-effectiveness.
Australia Graphing Calculator Market Trends
Current trends indicate a rising preference for calculators that offer enhanced connectivity features, such as Bluetooth capabilities and app integration, allowing for greater data exchange and collaboration among users. Furthermore, there's an increasing demand for devices that support real-time data analysis, critical for students involved in more complex problem-solving scenarios. The push towards sustainability is also influencing the market, with more environmentally friendly materials being favored in the manufacturing of these educational tools.
Australia Graphing Calculator Market Opportunities
The market presents genuine growth opportunities through the expansion of product lines that cater to specific educational needs, particularly in remote learning environments. As schools increasingly adopt hybrid learning models, there is a burgeoning market for graphing calculators that can seamlessly integrate with digital platforms and learning management systems. Additionally, targeting the professional sector, especially in engineering and data analysis fields, can lead to significant market growth.
Government Initiatives in the Australia Graphing Calculator Market
Government initiatives aimed at promoting educational technology and STEM curriculum implementation are critical to the growth of the graphing calculator market. Policies supporting educational equity, digital literacy, and funding for innovative learning tools bolster the demand for graphing calculators in schools. Continuous public investment in educational resources also ensures a supportive environment for manufacturers and suppliers in this market.
Future Insights of the Australia Graphing Calculator Market
Looking ahead to 2026-2032, the Australia Graphing Calculator Market is expected to evolve significantly as educational methodologies continue to embrace technology. Increasing collaboration between educational institutions and technology providers will likely spur innovation in graphing calculator features. The market is set to benefit from a consistent emphasis on STEM education, which will sustain demand and encourage further enhancements in calculator capabilities.
Australia Graphing Calculator Market Latest Developments (2025 - 2026)
Recent industry developments indicate a strong trend toward the introduction of multi-functional graphing calculators that cater to a variety of educational needs. Companies are also exploring partnerships with educational institutions to pilot new technologies in classroom settings, aiming to gather feedback and refine product offerings. Additionally, there is a noticeable shift towards enhancing user experience through design improvements and more intuitive interfaces.
Australia Graphing Calculator Market - Key Attractiveness of the Report
- 10 Years of Market Numbers
- Historical Data Starting from 2022 to 2025
- Base Year: 2025
- Forecast Data until 2032
- Key Performance Indicators Impacting the Market
- Major Upcoming Developments and Projects
Key Highlights of the Report:
- Australia Graphing Calculator Market Outlook
- Market Size of Australia Graphing Calculator Market, 2025
- Forecast of Australia Graphing Calculator Market, 2032
- Historical Data and Forecast of Australia Graphing Calculator Revenues & Volume for the Period 2022-2032F
- Australia Graphing Calculator Market Trend Evolution
- Australia Graphing Calculator Market Drivers and Challenges
- Australia Graphing Calculator Price Trends
- Australia Graphing Calculator Porter's Five Forces
- Australia Graphing Calculator Industry Life Cycle
- Historical Data and Forecast of Australia Graphing Calculator Market Revenues & Volume By Display for the Period 2022-2032F
- Historical Data and Forecast of Australia Graphing Calculator Market Revenues & Volume By Colored for the Period 2022-2032F
- Historical Data and Forecast of Australia Graphing Calculator Market Revenues & Volume By Black & White for the Period 2022-2032F
- Historical Data and Forecast of Australia Graphing Calculator Market Revenues & Volume By Application for the Period 2022-2032F
- Historical Data and Forecast of Australia Graphing Calculator Market Revenues & Volume By Education for the Period 2022-2032F
- Historical Data and Forecast of Australia Graphing Calculator Market Revenues & Volume By Gaming for the Period 2022-2032F
- Historical Data and Forecast of Australia Graphing Calculator Market Revenues & Volume By Others for the Period 2022-2032F
- Australia Graphing Calculator Import Export Trade Statistics
- Market Opportunity Assessment By Display
- Market Opportunity Assessment By Application
- Australia Graphing Calculator Top Companies Market Share
- Australia Graphing Calculator Competitive Benchmarking By Technical and Operational Parameters
- Australia Graphing Calculator Company Profiles
- Australia Graphing Calculator Key Strategic Recommendations
Frequently Asked Questions About the Market Study (FAQs):
The growth is primarily driven by the incorporation of graphing calculators in STEM education curricula and their essential role in standardized testing.
The market was estimated at USD 128 Million in 2025 and is expected to reach USD 151 Million by 2032, reflecting a steady growth with a CAGR of 2.4% from 2026 to 2032.
Manufacturers face challenges from technological advancements in mobile applications that serve as alternatives to traditional calculators, alongside pricing pressures from increasingly cost-conscious consumers.
Government initiatives promoting STEM education and funding for digital learning resources are instrumental in boosting the adoption of graphing calculators in schools.
Emerging trends include the integration of connectivity features and real-time data analysis capabilities, enhancing the functionality and appeal of graphing calculators in both educational and professional settings.
Significant growth opportunities lie in developing products tailored for remote learning and professional sectors, along with enhancing existing features to integrate with educational technology platforms.
6Wresearch actively monitors the Australia Graphing Calculator Market and publishes its comprehensive annual report, highlighting emerging trends, growth drivers, revenue analysis, and forecast outlook. Our insights help businesses to make data-backed strategic decisions with ongoing market dynamics. Our analysts track relevent industries related to the Australia Graphing Calculator Market, allowing our clients with actionable intelligence and reliable forecasts tailored to emerging regional needs.
Yes, we provide customisation as per your requirements. To learn more, feel free to contact us on sales@6wresearch.com
Global Go To Market Strategy - 2030
Export potential enables firms to identify high-growth global markets with greater confidence by combining advanced trade intelligence with a structured quantitative methodology. The framework analyzes emerging demand trends and country-level import patterns while integrating macroeconomic and trade datasets such as GDP and population forecasts, bilateral import–export flows, tariff structures, elasticity differentials between developed and developing economies, geographic distance, and import demand projections. Using weighted trade values from 2020–2024 as the base period to project country-to-country export potential for 2030, these inputs are operationalized through calculated drivers such as gravity model parameters, tariff impact factors, and projected GDP per-capita growth. Through an analysis of hidden potentials, demand hotspots, and market conditions that are most favorable to success, this method enables firms to focus on target countries, maximize returns, and global expansion with data, backed by accuracy.
By factoring in the projected importer demand gap that is currently unmet and could be potential opportunity, it identifies the potential for the Exporter (Country) among 190 countries, against the general trade analysis, which identifies the biggest importer or exporter.
To discover high-growth global markets and optimize your business strategy:
Click Here
Pricing
- Single User License$ 1,995
- Department License$ 2,400
- Site License$ 3,120
- Global License$ 3,795

Leadership Perspectives from Industry Events
Search
Thought Leadership and Analyst Meet


Our Clients
6WResearch In News
- India Export Attractiveness Tracker 2026
- India Air Conditioner Market Set for Strong Rebound in 2026 After Weather-Led Correction and GST-Driven Recovery: 6Wresearch
- ADAS in India: How Automatic Emergency Braking, Blind Spot Detection & Driver Monitoring are Transforming Road Safety
- Doha a strategic location for EV manufacturing hub: IPA Qatar
- Demand for luxury TVs surging in the GCC, says Samsung
- Empowering Growth: The Thriving Journey of Bangladesh’s Cable Industry
Latest Reports
- Nicaragua RPG Gaming Market (2026-2032)
- New Zealand RPG Gaming Market (2026-2032)
- Netherlands RPG Gaming Market (2026-2032)
- Nauru RPG Gaming Market (2026-2032)
- Namibia RPG Gaming Market (2026-2032)
- Mozambique RPG Gaming Market (2026-2032)
- Montenegro RPG Gaming Market (2026-2032)
- Mongolia RPG Gaming Market (2026-2032)
- Monaco RPG Gaming Market (2026-2032)
- Micronesia RPG Gaming Market (2026-2032)
Industry Events and Analyst Meet

EV India Expo 2026

HIMTEX 2026

India Refining Summit 2026

India EV Show 2026

EV tech India Expo 2026
Whitepaper
- Middle East & Africa Commercial Security Market Click here to view more.
- Middle East & Africa Fire Safety Systems & Equipment Market Click here to view more.
- GCC Drone Market Click here to view more.
- Middle East Lighting Fixture Market Click here to view more.
- GCC Physical & Perimeter Security Market Click here to view more.