Australia Greeting Cards Market (2026-2032) | Share, Growth, Analysis, Competitive Landscape, Industry, Outlook, Trends, Size & Revenue, Segmentation, Forecast, Value, Companies
Market Forecast By Type (eCard, Traditional Card), By Distribution Channel (Online, Offline) And Competitive Landscape
| Product Code: ETC6181941 | Publication Date: Sep 2024 | Updated Date: Mar 2026 | Product Type: Market Research Report | |
| Publisher: 6Wresearch | Author: Shubham Padhi | No. of Pages: 75 | No. of Figures: 35 | No. of Tables: 20 |
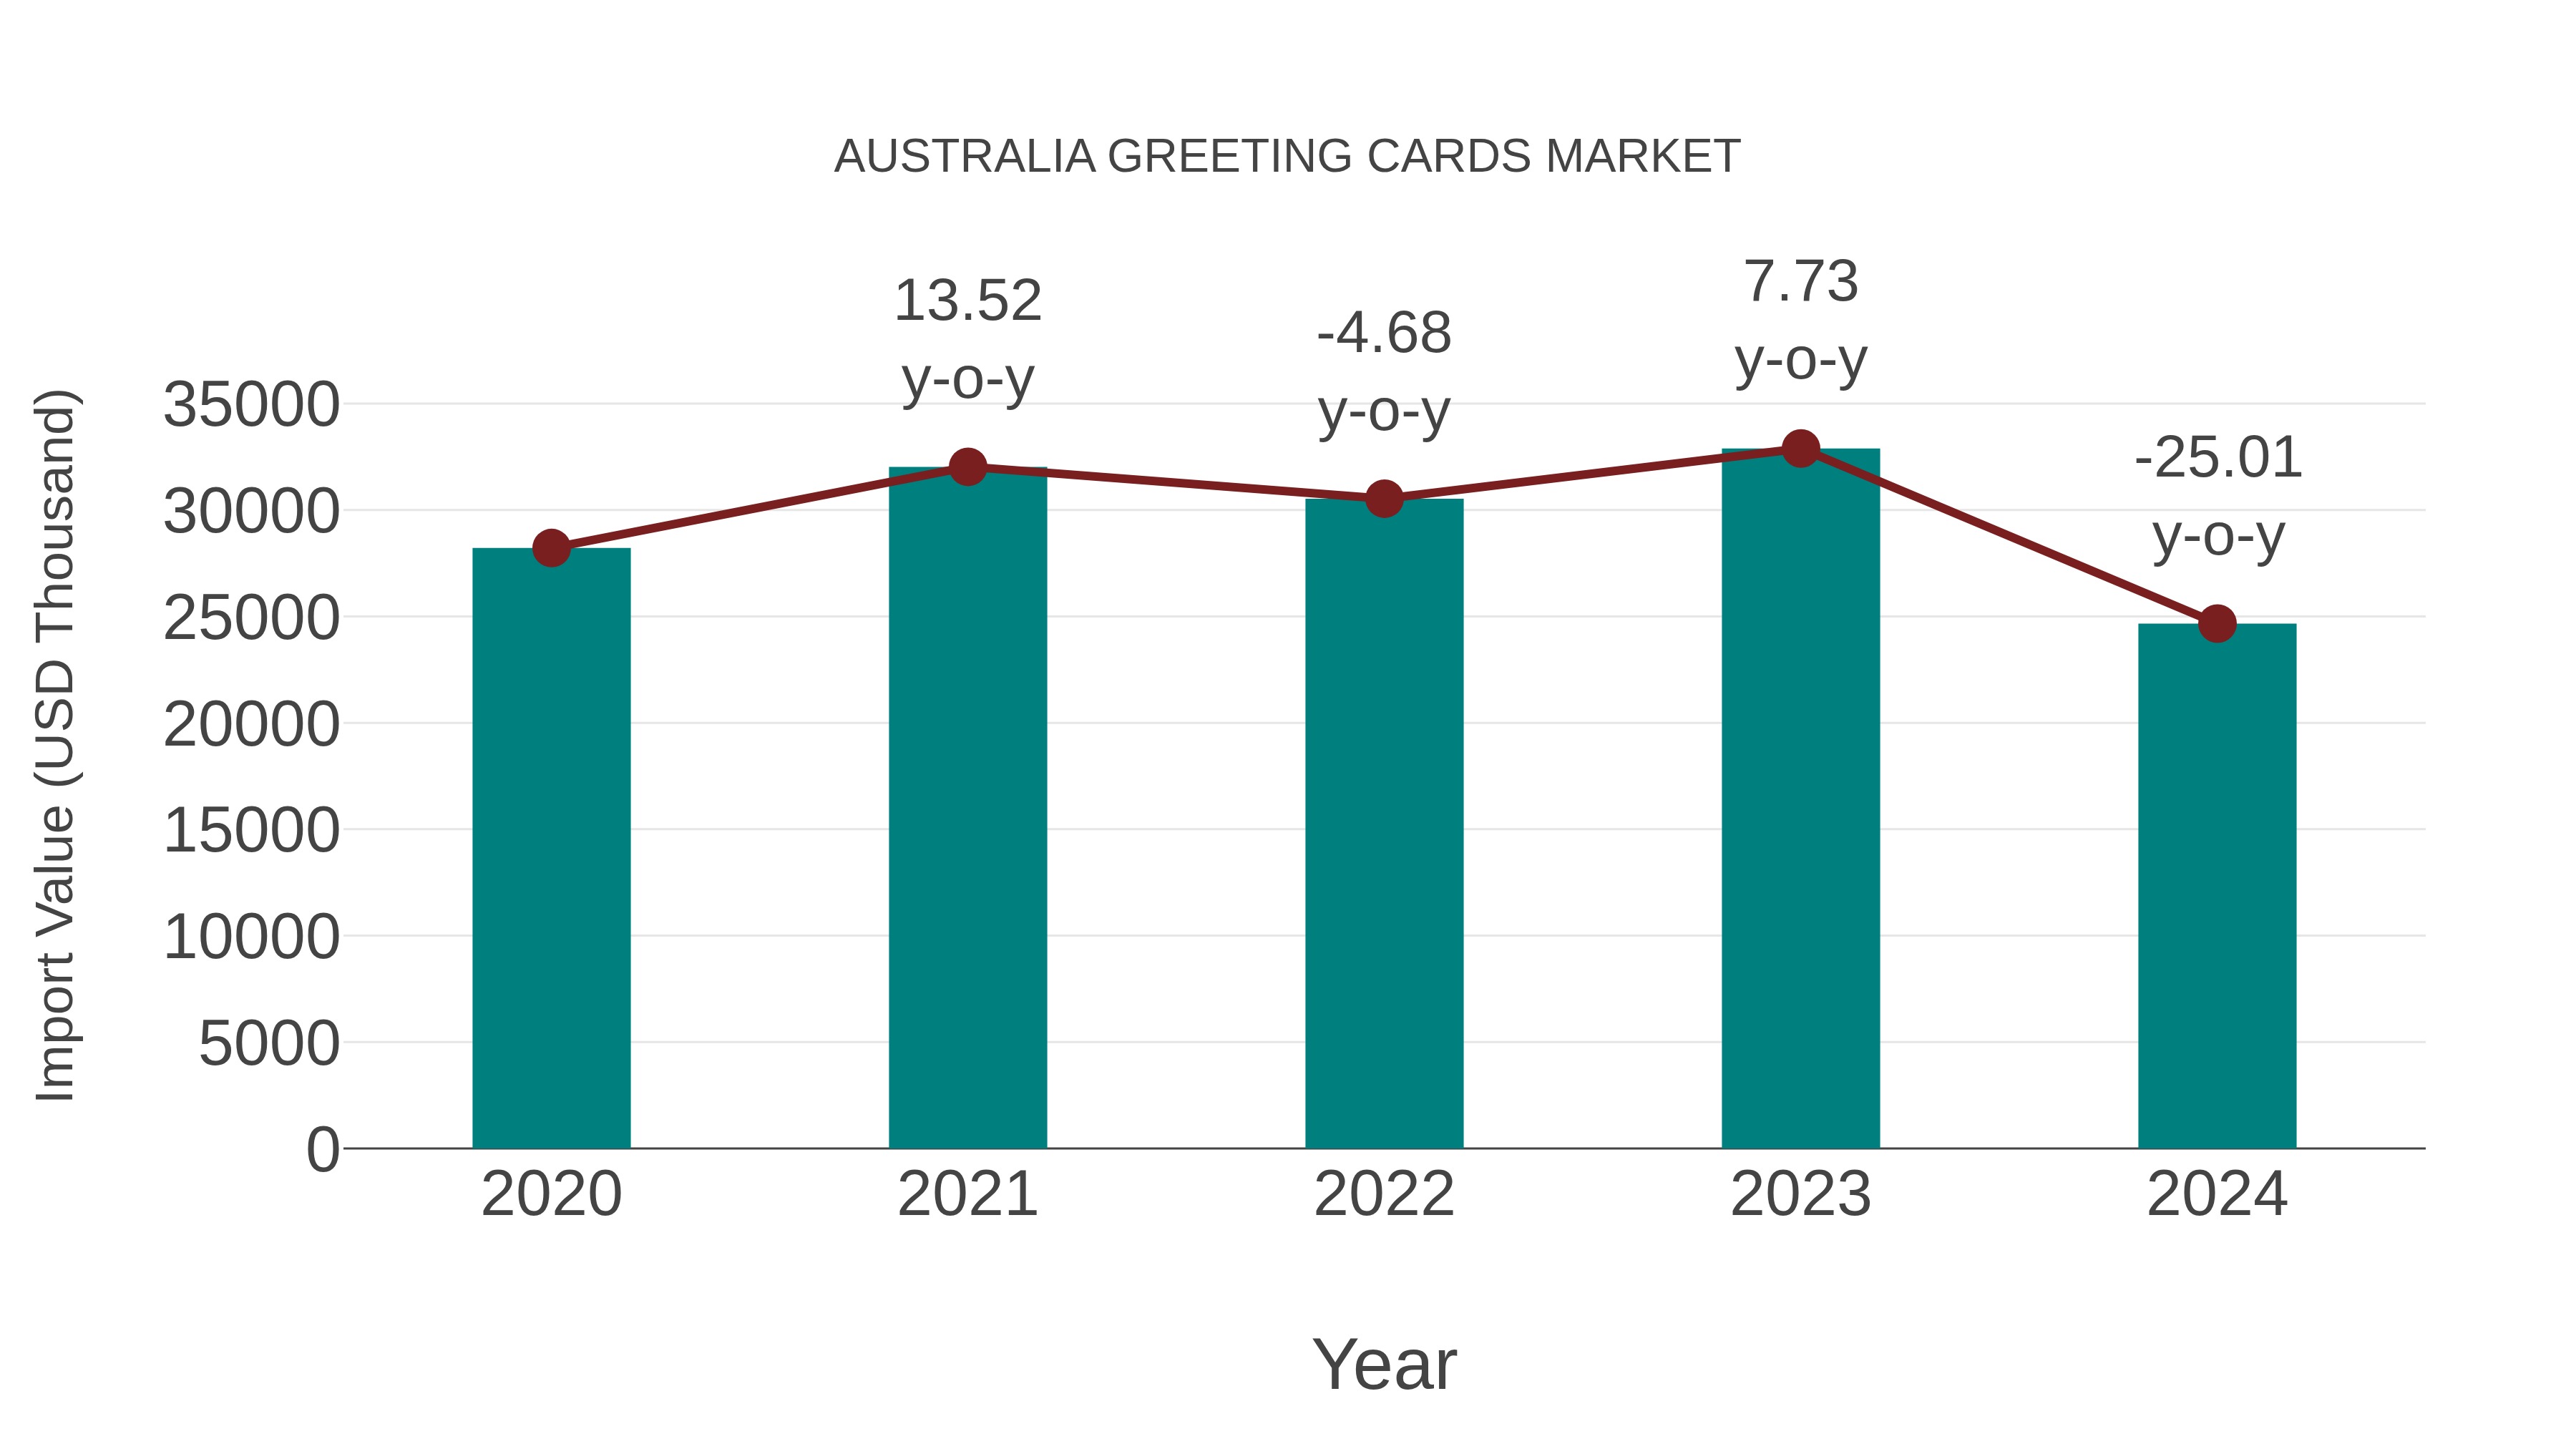
Australia Greeting Cards Market: Import Trend Analysis
Australia`s import trend for the greeting cards market experienced a notable decline from 2023 to 2024, with a growth rate of -25.01%. The compound annual growth rate (CAGR) for the period 2020-2024 stood at -3.31%. This decline can be attributed to shifting consumer preferences towards digital communication channels impacting the demand for traditional greeting cards.
Australia Greeting Cards Market Growth Rate
According to 6Wresearch internal database and industry insights, the Australia Greeting Cards Market is projected to grow at a compound annual growth rate (CAGR) of 3.2% during the forecast period from 2026 to 2032.
Topics Covered in the Australia Greeting Cards Market Report
The Australia Greeting Cards Market report thoroughly covers the market by type and distribution channel. It provides an unbiased and detailed analysis of ongoing market trends, opportunities, challenges, and market drivers, helping stakeholders align their strategies with current and future market dynamics.
Australia Greeting Cards Market Highlights
| Report Name | Australia Greeting Cards Market |
| Forecast period | 2026–2032 |
| CAGR | 3.2% |
| Growing Sector | Consumer Goods/Stationery |
Australia Greeting Cards Market Synopsis
Australia Greeting Cards Market is expected to have steady growth due to a strong cultural tradition of card-giving, increasing demand for premium handmade cards, and the rise of integrated digital-physical solutions. The market is also fuelled by advancements in sustainable printing technologies, the expansion of e-commerce platforms, and a shift toward high-quality, artisanal products. Australia’s robust retail sector and the growing trend of personalized thoughtful gifting are propelling the industry forward. With increasing consumer interest in unique designs and environmentally conscious materials, the greeting cards market is expected to have a consistent expansion.
Evaluation of Growth Drivers in Australia Greeting Cards Market
Below mentioned are some prominent drivers and their impact on Australia Greeting Cards Market dynamics:
| Drivers | Primary Segment Affected | Why It Matters (evidence) |
| Personalization and Customization | Traditional Card, Online | Consumers increasingly seek unique, tailored messages and designs, moving away from mass-produced generic cards. |
| Sustainability Trends | Traditional Card | High demand for FSC-certified paper and plastic-free packaging influences purchasing decisions in the Australian market. |
| E-commerce Proliferation | Online Distribution Channel | The ease of ordering cards via mobile apps and online platforms has significantly boosted the reach of boutique designers. |
| Cultural Traditions | All Segments | Strong involvement in events such as Mother's Day, Father's Day, and Christmas assures consistent annual demand. |
| Rise of Boutique Stationery | Traditional Card, Offline | The emergence of independent illustrators and local stationery brands adds variety and attracts younger demographics. |
Australia Greeting Cards Market is projected to grow at a CAGR of 3.2% from 2026 to 2032. Some major growth factors for this growth are the rising preference for premium sustainable products, the expansion of online greeting card platforms, and the high demand for personalized stationery. The demand for cards, particularly eco-friendly traditional cards, is increasing in the retail and e-commerce sectors as Australians prioritize sentimental value and environmental responsibility. The expanding digital printing infrastructure and the rising popularity of subscription-based card services are also contributing to the Australia Greeting Cards Market Growth.
Evaluation of Restraints in Australia Greeting Cards Market
Below mentioned are some major restraints and their influence on Australia Greeting Cards Market dynamics:
| Restraints | Primary Segment Affected | What This Means (evidence) |
| Rising Postal Costs | Traditional Card | Increased costs for domestic postage by Australia Post may deter consumers from sending physical cards. |
| Digital Alternatives (Social Media) | eCard, Traditional Card | The prevalence of free instant messaging and social media greetings reduces the volume of traditional card exchanges. |
| High Cost of Premium Materials | Traditional Card | The increased cost of specialist papers and ecological inks can result in higher retail pricing, affecting mass-market sales. |
| Shift in Communication Habits | All Segments | Younger generations often prefer digital-only interactions, which can limit the long-term growth of the physical card market. |
| Retail Competition | Offline Distribution Channel | Increased competition from supermarkets offering low-cost cards might reduce specialist gift businesses profit margins. |
Australia Greeting Cards Market Challenges
Australia Greeting Cards Market faces numerous challenges such as rising logistics and postage costs, competition from free digital messaging platforms, and the increasing price of eco-friendly raw materials. Inconsistency in retail foot traffic in certain urban areas can impact the sales of physical card outlets. Despite of all these challenges, the consumer’s appreciation for tangible, sentimental keepsakes and new advancements in online design tools is likely to continue to drive demand in this market. More retailers and designers are investing in cutting-edge greeting card solutions due to growing awareness of sustainable paper sourcing and the possibility of digital-physical integration.
Emerging Trends in the Australia Greeting Cards Market
Trends driving the Australia Greeting Cards Market include:
- Rise of Plantable Greeting Cards: As consumers seek out zero-waste options that can be planted after use, in line with Australia's strict environmental regulations, demand for cards with embedded seeds is rising.
- Integration of Augmented Reality (AR): Some Australian card companies are incorporating AR features where scanning a card with a smartphone plays a personal video message, merging digital and physical experiences.
- Surge in Support Local Movements: There is a major trend of consumers purchasing cards from local Australian artists and small-scale boutique publishers rather than international conglomerates.
- Growth of Direct-to-Recipient Online Services: To bridge the gap between digital convenience and tangible sentiment, more platforms are providing the ability to handwrite and mail cards directly to the recipient.
- Focus on Gender-Neutral and Inclusive Designs: The expansion of card ranges to incorporate more diverse partnerships, nontraditional family structures, and gender-neutral celebrations reflects Australia's changing social fabric.
Investment Opportunities in the Australia Greeting Cards Market
Key investment avenues in the Australia Greeting Cards Market are:
- Advancements in Eco-Friendly Printing: Investing in supply chains for recycled materials and soy-based inks can attract the increasing number of environmentally conscious customers in urban areas.
- Development of AI-Driven Personalization: Implementing AI tools that help consumers write personalized messages or design unique layouts can improve user engagement on digital platforms.
- Expansion into Subscription Models: Establishing monthly "card boxes" or subscription services for frequent card-senders presents a major opportunity for recurring revenue in the domestic market.
- Collaboration with Local Illustrators: Collaborative partnerships with Australian artists provide brands with unique cultural designs can differentiate brands from global mass-market competitors.
- Growth of Luxury Finishes: Foil stamping, embossing, and letterpress techniques are used more frequently for the high-value wedding and milestone event segment.
Top 5 Leading Players in the Australia Greeting Cards Market
Below is a list of prominent companies leading in the Australia Greeting Cards Market:
1. Hallmark Cards Pty Ltd
| Company Name | Hallmark Cards Pty Ltd |
| Headquarters | Melbourne, Australia |
| Established | 1910 |
| Official Website | Click Here |
Hallmark is a market leader in Australia, providing a vast range of traditional cards and gift wrap through extensive retail partnerships and its own online platform.
2. John Sands Ltd
| Company Name | John Sands Ltd |
| Headquarters | Mulgrave, Victoria, Australia |
| Established | 1837 |
| Official Website | Click Here |
One of the oldest stationery companies in Australia, John Sands specializes in high-quality greeting cards and social expression products across multiple retail tiers.
3. The Original Poster Company
| Company Name | The Original Poster Company |
| Headquarters | Queensland, Australia |
| Established | 1990 |
| Official Website | Click Here |
The Original Poster Company is a major distributor of greeting cards and gift products through a franchise network supplying retail stores across Australia.
4. Papernest Cards
| Company Name | Papernest Cards |
| Headquarters | Queensland, Australia |
| Established | 2010 |
| Official Website | Click Here |
Papernest Cards is an Australian greeting card and gift brand known for creative illustrated greeting cards and handcrafted designs sold through retail stores and online platforms.
5. Earth Greetings Pty Ltd.
| Company Name | Earth Greetings Pty Ltd. |
| Headquarters | Adelaide, Australia |
| Established | 2003 |
| Official Website | Click Here |
Earth Greetings is an Australian eco-friendly greeting card and stationery brand producing sustainable, recycled greeting cards while supporting Australian artists and environmental initiatives.
Government Regulations Introduced in the Australia Greeting Cards Market
According to Australian government data, they have introduced policies to support sustainable manufacturing such as the Australian Packaging Covenant Organisation (APCO) targets, which encourage the greeting card industry to move toward 100% recyclable or reusable packaging. In addition, Australia supports the National Waste Policy, encouraging the use of recycled fibre in paper products. The Australian government’s small business support grants and regional trade partnerships support the growth of local stationery manufacturers and will create a greater opportunity for private investment into quality domestic manufacturing.
Future Insights of the Australia Greeting Cards Market
The future of Australia Greeting Cards Market Share is expected to witness a major growth in the upcoming years with the help of digital transformation in retail, sustainable product innovation, and a resurgence in the popularity of physical stationery. The decreasing friction in online ordering, increasing usage of recycled materials, and a high demand for premium personalized cards will continue to push this market in the forward direction. The expansion of boutique design studios and new innovations in interactive cards will be main contributors in this market growth in the coming years.
Market Segmentation Analysis
The report offers a comprehensive study of the following market segments and their leading categories:
By Type - Traditional Card to dominate the market
According to Ekta Gupta, Senior Research Analyst, 6Wresearch, Traditional Cards are expected to dominate the Australia Greeting Cards Market Share due to the enduring cultural value placed on physical, tangible mementos. Despite the rise of digital communication, the emotional impact and "keep-sake" nature of a physical card remain preferred for major life events like weddings, funerals, and milestone birthdays. The tactile experience of high-quality paper and the ability to display the card in a home environment drive the continued dominance of this segment across both rural and urban demographics.
By Distribution Channel - Offline to dominate the market
Offline distribution is the dominant channel for greeting cards in Australia as it is driven by the "impulse buy" nature of the product within newsagents, supermarkets, and specialty gift stores. Consumers often prefer to browse and feel the quality of the card in person before purchasing. Large retail chains and localized newsstands provide high accessibility, making physical retail the primary segment in the market, although online channels are rapidly catching up in the personalized card sub-segment.
Key Attractiveness of the Report
- 10 Years of Market Numbers
- Historical Data Starting from 2022 to 2025
- Base Year: 2025
- Forecast Data until 2032
- Key Performance Indicators Impacting the Market
- Major Upcoming Developments and Projects
Key Highlights of the Report:
- Australia Greeting Cards Market Outlook
- Market Size of Australia Greeting Cards Market, 2025
- Forecast of Australia Greeting Cards Market, 2032
- Historical Data and Forecast of Australia Greeting Cards Revenues & Volume for the Period 2022-2032F
- Australia Greeting Cards Market Trend Evolution
- Australia Greeting Cards Market Drivers and Challenges
- Australia Greeting Cards Price Trends
- Australia Greeting Cards Porter's Five Forces
- Australia Greeting Cards Industry Life Cycle
- Historical Data and Forecast of Australia Greeting Cards Market Revenues & Volume By Type for the Period 2022-2032F
- Historical Data and Forecast of Australia Greeting Cards Market Revenues & Volume By eCard for the Period 2022-2032F
- Historical Data and Forecast of Australia Greeting Cards Market Revenues & Volume By Traditional Card for the Period 2022-2032F
- Historical Data and Forecast of Australia Greeting Cards Market Revenues & Volume By Distribution Channel for the Period 2022-2032F
- Historical Data and Forecast of Australia Greeting Cards Market Revenues & Volume By Online for the Period 2022-2032F
- Historical Data and Forecast of Australia Greeting Cards Market Revenues & Volume By Offline for the Period 2022-2032F
- Australia Greeting Cards Import Export Trade Statistics
- Market Opportunity Assessment By Type
- Market Opportunity Assessment By Distribution Channel
- Australia Greeting Cards Top Companies Market Share
- Australia Greeting Cards Competitive Benchmarking By Technical and Operational Parameters
- Australia Greeting Cards Company Profiles
- Australia Greeting Cards Key Strategic Recommendations
Market Covered
The report offers a comprehensive study of the following Australia Greeting Cards Market segments:
By Type
- Traditional Card
- eCard
By Distribution Channel
- Offline
- Online
Australia Greeting Cards Market (2026-2032): FAQs
The Australia Greeting Cards Market is expected to grow at a compound annual growth rate of 3.2% during the forecast period of 2026 to 2032.
Key growth drivers are a rising consumer preference for premium sustainable materials and expansion of online personalization platforms that offer direct-to-recipient mailing services.
Major trends are an increase in eco-friendly and plantable cards, as well as a growing need for inclusive and diverse design themes.
Government initiatives encourage producers to eliminate plastic waste and the industry to transition to recycled fibers and biodegradable inks in domestic card production.
6Wresearch actively monitors the Australia Greeting Cards Market and publishes its comprehensive annual report, highlighting emerging trends, growth drivers, revenue analysis, and forecast outlook. Our insights help businesses to make data-backed strategic decisions with ongoing market dynamics. Our analysts track relevent industries related to the Australia Greeting Cards Market, allowing our clients with actionable intelligence and reliable forecasts tailored to emerging regional needs.
Yes, we provide customisation as per your requirements. To learn more, feel free to contact us on sales@6wresearch.com
|
1 Executive Summary |
|
2 Introduction |
|
2.1 Key Highlights of the Report |
|
2.2 Report Description |
|
2.3 Market Scope & Segmentation |
|
2.4 Research Methodology |
|
2.5 Assumptions |
|
3 Australia Greeting Cards Market Overview |
|
3.1 Australia Country Macro Economic Indicators |
|
3.2 Australia Greeting Cards Market Revenues & Volume, 2022 & 2032F |
|
3.3 Australia Greeting Cards Market - Industry Life Cycle |
|
3.4 Australia Greeting Cards Market - Porter's Five Forces |
|
3.5 Australia Greeting Cards Market Revenues & Volume Share, By Type, 2022 & 2032F |
|
3.6 Australia Greeting Cards Market Revenues & Volume Share, By Distribution Channel, 2022 & 2032F |
|
4 Australia Greeting Cards Market Dynamics |
|
4.1 Impact Analysis |
|
4.2 Market Drivers |
|
4.2.1 Increasing consumer preference for personalized and unique greeting cards |
|
4.2.2 Growing trend of sending greeting cards for various occasions |
|
4.2.3 Innovation in card designs and technology, such as e-cards and augmented reality cards |
|
4.3 Market Restraints |
|
4.3.1 Competition from digital alternatives like e-cards and social media greetings |
|
4.3.2 Economic fluctuations affecting consumer discretionary spending on greeting cards |
|
4.3.3 Environmental concerns related to paper usage and waste from greeting cards |
|
5 Australia Greeting Cards Market Trends |
|
6 Australia Greeting Cards Market, By Types |
|
6.1 Australia Greeting Cards Market, By Type |
|
6.1.1 Overview and Analysis |
|
6.1.2 Australia Greeting Cards Market Revenues & Volume, By Type, 2022-2032F |
|
6.1.3 Australia Greeting Cards Market Revenues & Volume, By eCard, 2022-2032F |
|
6.1.4 Australia Greeting Cards Market Revenues & Volume, By Traditional Card, 2022-2032F |
|
6.2 Australia Greeting Cards Market, By Distribution Channel |
|
6.2.1 Overview and Analysis |
|
6.2.2 Australia Greeting Cards Market Revenues & Volume, By Online, 2022-2032F |
|
6.2.3 Australia Greeting Cards Market Revenues & Volume, By Offline, 2022-2032F |
|
7 Australia Greeting Cards Market Import-Export Trade Statistics |
|
7.1 Australia Greeting Cards Market Export to Major Countries |
|
7.2 Australia Greeting Cards Market Imports from Major Countries |
|
8 Australia Greeting Cards Market Key Performance Indicators |
|
8.1 Customer engagement metrics, such as click-through rates for e-cards or personalized card orders |
|
8.2 Market penetration of innovative greeting card technologies, like augmented reality cards |
|
8.3 Customer satisfaction scores related to the quality and uniqueness of greeting cards |
|
9 Australia Greeting Cards Market - Opportunity Assessment |
|
9.1 Australia Greeting Cards Market Opportunity Assessment, By Type, 2022 & 2032F |
|
9.2 Australia Greeting Cards Market Opportunity Assessment, By Distribution Channel, 2022 & 2032F |
|
10 Australia Greeting Cards Market - Competitive Landscape |
|
10.1 Australia Greeting Cards Market Revenue Share, By Companies, 2025 |
|
10.2 Australia Greeting Cards Market Competitive Benchmarking, By Operating and Technical Parameters |
|
11 Company Profiles |
|
12 Recommendations |
|
13 Disclaimer |
Global Go To Market Strategy - 2030
Export potential enables firms to identify high-growth global markets with greater confidence by combining advanced trade intelligence with a structured quantitative methodology. The framework analyzes emerging demand trends and country-level import patterns while integrating macroeconomic and trade datasets such as GDP and population forecasts, bilateral import–export flows, tariff structures, elasticity differentials between developed and developing economies, geographic distance, and import demand projections. Using weighted trade values from 2020–2024 as the base period to project country-to-country export potential for 2030, these inputs are operationalized through calculated drivers such as gravity model parameters, tariff impact factors, and projected GDP per-capita growth. Through an analysis of hidden potentials, demand hotspots, and market conditions that are most favorable to success, this method enables firms to focus on target countries, maximize returns, and global expansion with data, backed by accuracy.
By factoring in the projected importer demand gap that is currently unmet and could be potential opportunity, it identifies the potential for the Exporter (Country) among 190 countries, against the general trade analysis, which identifies the biggest importer or exporter.
To discover high-growth global markets and optimize your business strategy:
Click Here
Pricing
- Single User License$ 1,995
- Department License$ 2,400
- Site License$ 3,120
- Global License$ 3,795

Leadership Perspectives from Industry Events
Search
Thought Leadership and Analyst Meet


Our Clients
6WResearch In News
- India Export Attractiveness Tracker 2026
- India Air Conditioner Market Set for Strong Rebound in 2026 After Weather-Led Correction and GST-Driven Recovery: 6Wresearch
- ADAS in India: How Automatic Emergency Braking, Blind Spot Detection & Driver Monitoring are Transforming Road Safety
- Doha a strategic location for EV manufacturing hub: IPA Qatar
- Demand for luxury TVs surging in the GCC, says Samsung
- Empowering Growth: The Thriving Journey of Bangladesh’s Cable Industry
Latest Reports
- Nicaragua RPG Gaming Market (2026-2032)
- New Zealand RPG Gaming Market (2026-2032)
- Netherlands RPG Gaming Market (2026-2032)
- Nauru RPG Gaming Market (2026-2032)
- Namibia RPG Gaming Market (2026-2032)
- Mozambique RPG Gaming Market (2026-2032)
- Montenegro RPG Gaming Market (2026-2032)
- Mongolia RPG Gaming Market (2026-2032)
- Monaco RPG Gaming Market (2026-2032)
- Micronesia RPG Gaming Market (2026-2032)
Industry Events and Analyst Meet

EV India Expo 2026

HIMTEX 2026

India Refining Summit 2026

India EV Show 2026

EV tech India Expo 2026
Whitepaper
- Middle East & Africa Commercial Security Market Click here to view more.
- Middle East & Africa Fire Safety Systems & Equipment Market Click here to view more.
- GCC Drone Market Click here to view more.
- Middle East Lighting Fixture Market Click here to view more.
- GCC Physical & Perimeter Security Market Click here to view more.