Australia Phenolic Board Market (2026-2032) | Segmentation, Growth, Value, Size & Revenue, Analysis, Trends, Companies, Forecast, Outlook, Competitive Landscape, Share, Industry
Market Forecast By Thickness (?40 mm, >40 mm), By Application (Interior, Building and Construction, Insulation Panel, Exterior, Furniture, Others), By End Use (Residential, Commercial, Industrial) And Competitive Landscape
| Product Code: ETC6188196 | Publication Date: Sep 2024 | Updated Date: Mar 2026 | Product Type: Market Research Report | |
| Publisher: 6Wresearch | Author: Shubham Padhi | No. of Pages: 75 | No. of Figures: 35 | No. of Tables: 20 |
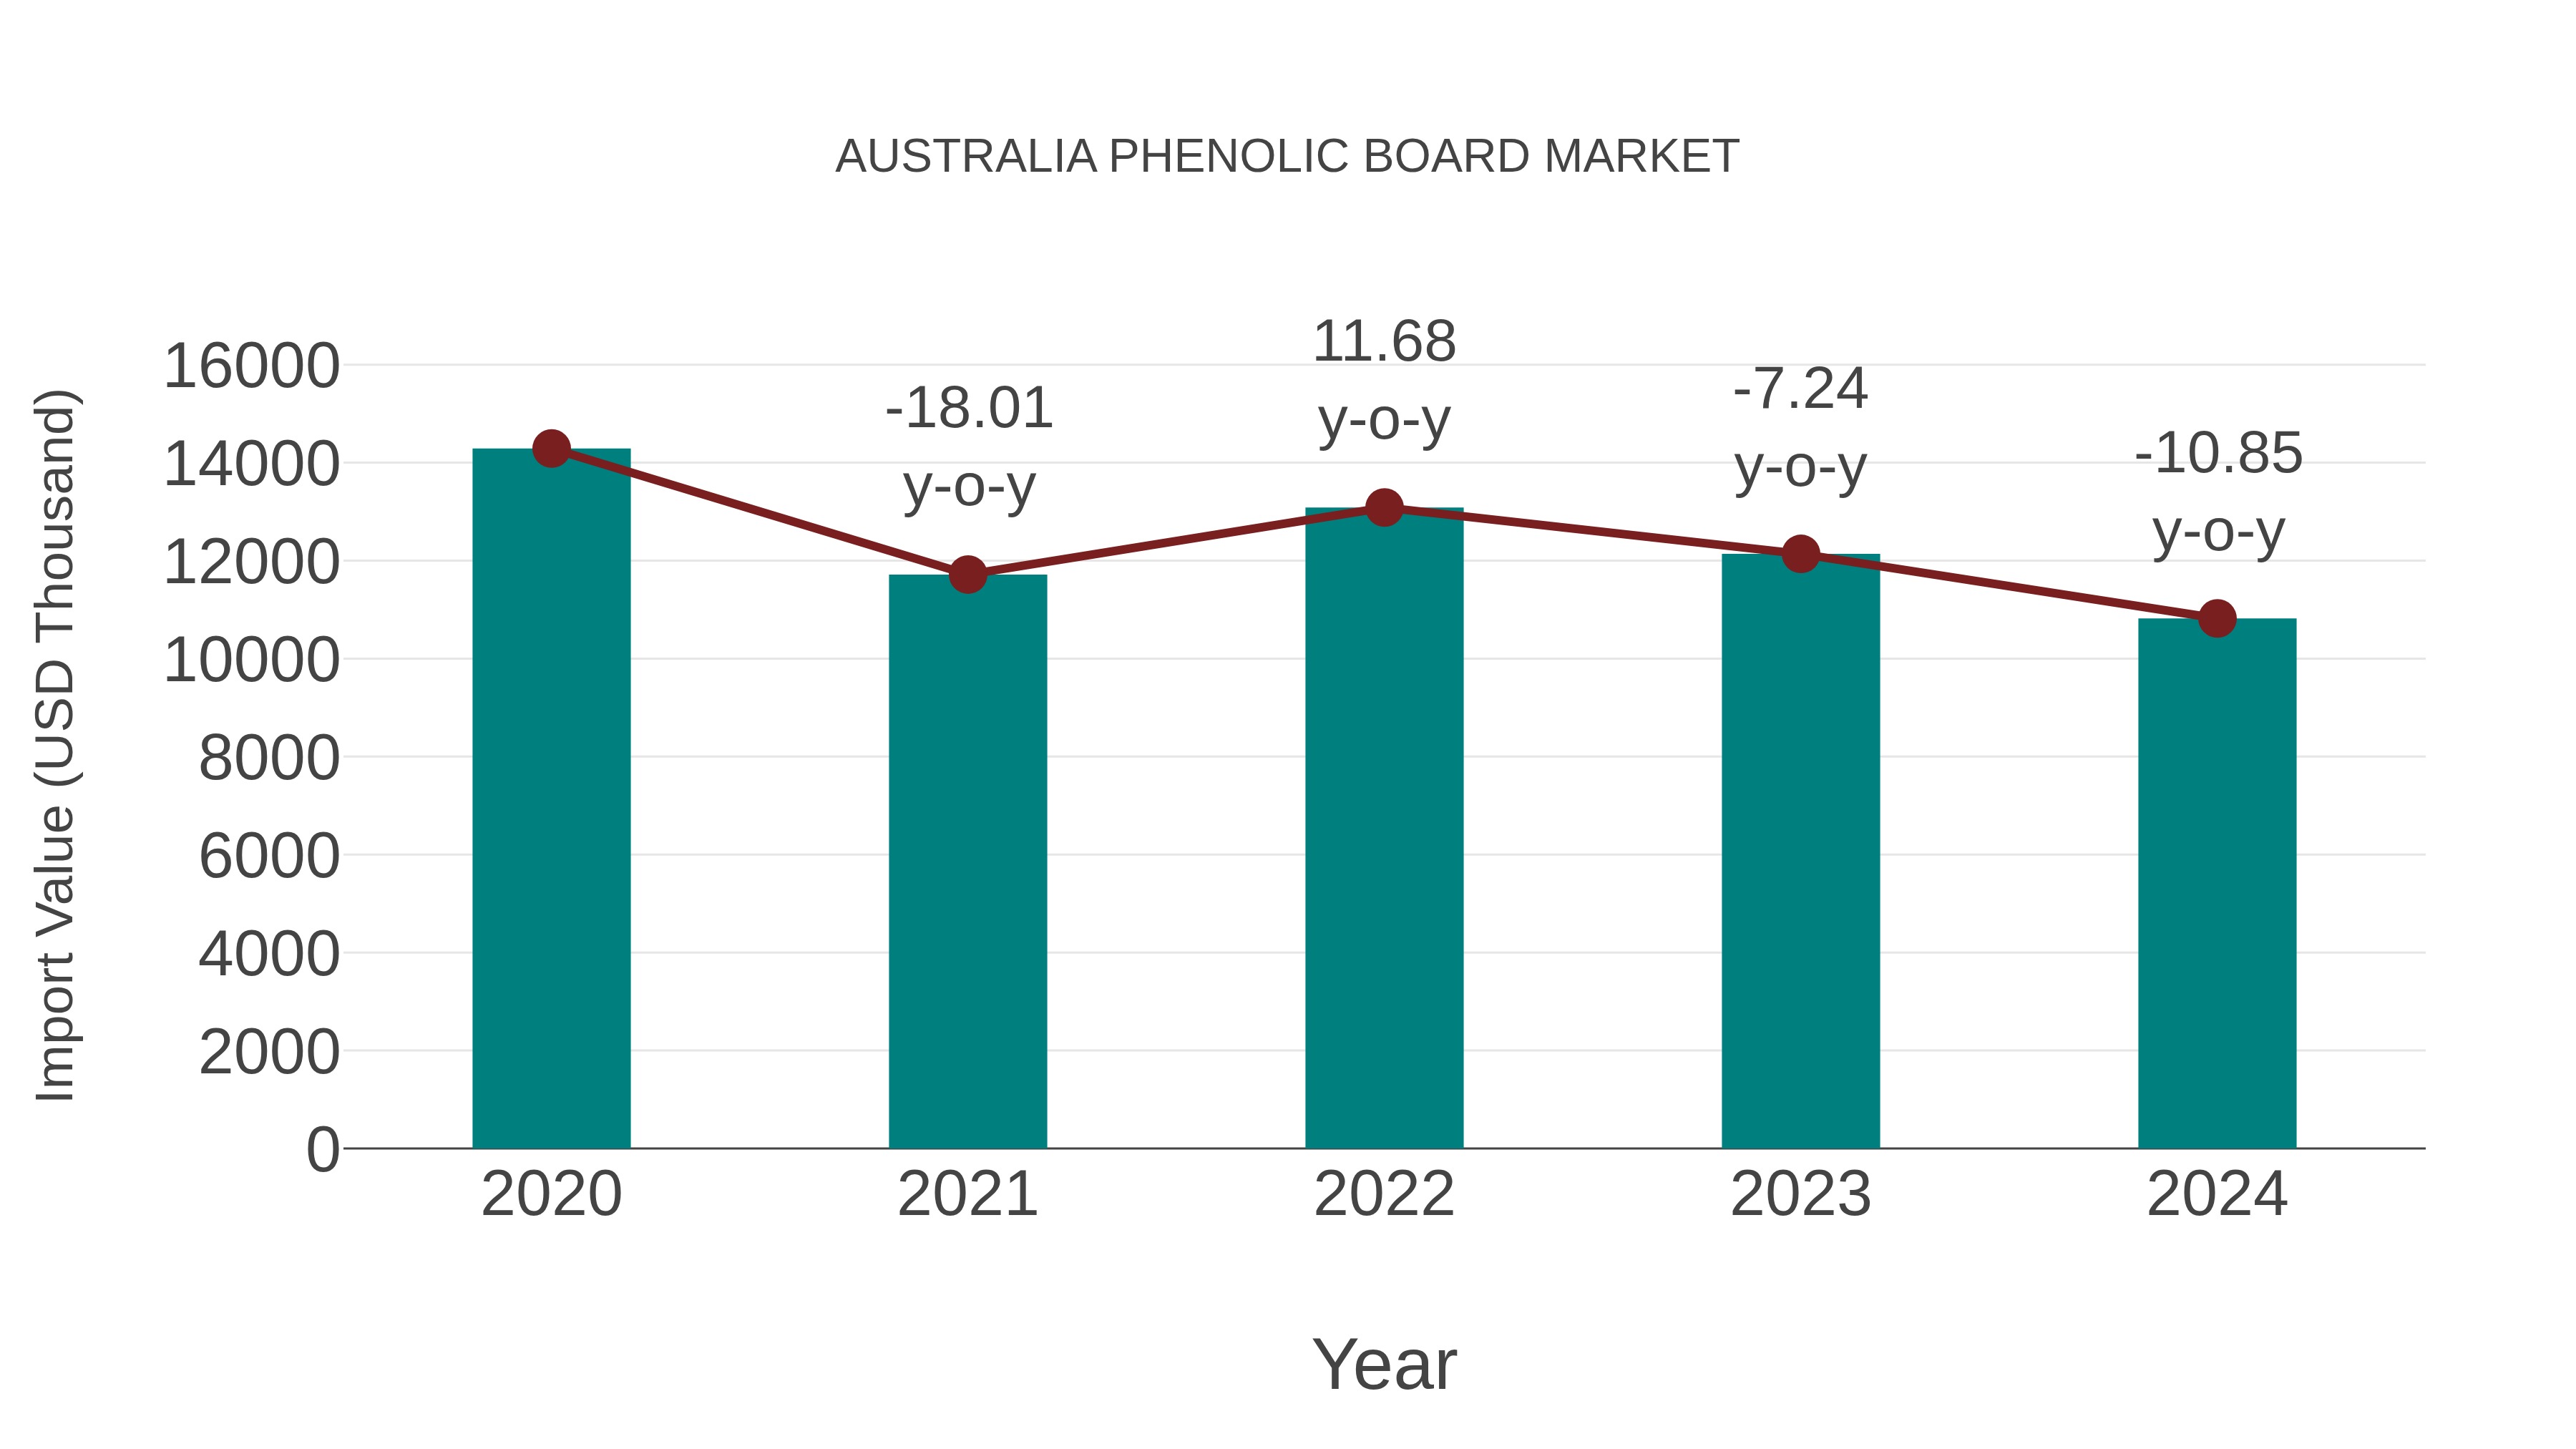
Australia Phenolic Board Market: Import Trend Analysis
In the Australia phenolic board market, the import trend experienced a decline from 2023 to 2024, with a growth rate of -10.85%. The compound annual growth rate (CAGR) for imports from 2020 to 2024 stood at -6.72%. This negative import momentum could be attributed to shifting demand patterns or possible market stabilization efforts.
Australia Phenolic Board Market Overview
Phenolic boards, made from phenolic resins and fibrous materials, are used in construction and insulation applications due to their excellent durability, moisture resistance, and thermal insulation properties. In Australia, the demand for phenolic boards is driven by the growing construction industry, particularly in commercial and industrial sectors. These boards are ideal for applications in environments where fire safety and insulation are paramount, such as in high-rise buildings, factories, and warehouses.
Trends of the market
Australias phenolic board market is expanding, particularly in construction and industrial applications. The trend is leaning toward fire-resistant and water-resistant materials for high-performance infrastructure. The use of phenolic boards in furniture and laboratory setups is also growing due to their durability and chemical resistance. Additionally, advancements in manufacturing techniques are making these boards more affordable and accessible.
Challenges of the market
In the Australia Phenolic Board Market, challenges revolve around the increasing environmental concerns and the shift towards more sustainable building materials. While phenolic boards are known for their durability and strength, the growing demand for eco-friendly products puts pressure on manufacturers to innovate and adopt greener production methods. The market also faces issues related to cost fluctuations in phenolic resins, a key raw material. Furthermore, competition from alternative materials like plywood and MDF boards, which are sometimes perceived as more cost-effective and sustainable, presents a constant challenge for growth.
Investment opportunities in the Market
Investments in the phenolic board market in Australia are shaped by policies that promote sustainable building materials and eco-friendly construction practices. The Australia government has implemented a series of incentives to encourage the use of environmentally friendly products in the construction sector, including the use of phenolic boards, which offer durability and fire resistance. Investors are encouraged to develop phenolic boards that meet Australia`s stringent environmental standards, such as those outlined by the Green Building Council of Australia (GBCA). Furthermore, tax incentives are provided for businesses investing in energy-efficient technologies and reducing carbon footprints, which can enhance the growth of the phenolic board market.
Government Policy of the market
In the phenolic board market, government policies focus on building codes and fire safety regulations. The National Construction Code (NCC) outlines the standards for fire-resistant construction materials, which include phenolic boards. Moreover, sustainability initiatives under the Green Building Council of Australia (GBCA) encourage the use of low-emission and thermally efficient materials, pushing manufacturers to innovate within regulatory frameworks.
Key Highlights of the Report:
- Australia Phenolic Board Market Outlook
- Market Size of Australia Phenolic Board Market, 2025
- Forecast of Australia Phenolic Board Market, 2032
- Historical Data and Forecast of Australia Phenolic Board Revenues & Volume for the Period 2022 - 2032F
- Australia Phenolic Board Market Trend Evolution
- Australia Phenolic Board Market Drivers and Challenges
- Australia Phenolic Board Price Trends
- Australia Phenolic Board Porter's Five Forces
- Australia Phenolic Board Industry Life Cycle
- Historical Data and Forecast of Australia Phenolic Board Market Revenues & Volume By Thickness for the Period 2022 - 2032F
- Historical Data and Forecast of Australia Phenolic Board Market Revenues & Volume By ?40 mm for the Period 2022 - 2032F
- Historical Data and Forecast of Australia Phenolic Board Market Revenues & Volume By >40 mm for the Period 2022 - 2032F
- Historical Data and Forecast of Australia Phenolic Board Market Revenues & Volume By Application for the Period 2022 - 2032F
- Historical Data and Forecast of Australia Phenolic Board Market Revenues & Volume By Interior for the Period 2022 - 2032F
- Historical Data and Forecast of Australia Phenolic Board Market Revenues & Volume By Building and Construction for the Period 2022 - 2032F
- Historical Data and Forecast of Australia Phenolic Board Market Revenues & Volume By Insulation Panel for the Period 2022 - 2032F
- Historical Data and Forecast of Australia Phenolic Board Market Revenues & Volume By Exterior for the Period 2022 - 2032F
- Historical Data and Forecast of Australia Phenolic Board Market Revenues & Volume By Furniture for the Period 2022 - 2032F
- Historical Data and Forecast of Australia Phenolic Board Market Revenues & Volume By Others for the Period 2022 - 2032F
- Historical Data and Forecast of Australia Phenolic Board Market Revenues & Volume By End Use for the Period 2022 - 2032F
- Historical Data and Forecast of Australia Phenolic Board Market Revenues & Volume By Residential for the Period 2022 - 2032F
- Historical Data and Forecast of Australia Phenolic Board Market Revenues & Volume By Commercial for the Period 2022 - 2032F
- Historical Data and Forecast of Australia Phenolic Board Market Revenues & Volume By Industrial for the Period 2022 - 2032F
- Australia Phenolic Board Import Export Trade Statistics
- Market Opportunity Assessment By Thickness
- Market Opportunity Assessment By Application
- Market Opportunity Assessment By End Use
- Australia Phenolic Board Top Companies Market Share
- Australia Phenolic Board Competitive Benchmarking By Technical and Operational Parameters
- Australia Phenolic Board Company Profiles
- Australia Phenolic Board Key Strategic Recommendations
Australia Phenolic Board Market (2026-2032): FAQs
6Wresearch actively monitors the Australia Phenolic Board Market and publishes its comprehensive annual report, highlighting emerging trends, growth drivers, revenue analysis, and forecast outlook. Our insights help businesses to make data-backed strategic decisions with ongoing market dynamics. Our analysts track relevent industries related to the Australia Phenolic Board Market, allowing our clients with actionable intelligence and reliable forecasts tailored to emerging regional needs.
Yes, we provide customisation as per your requirements. To learn more, feel free to contact us on sales@6wresearch.com
1 Executive Summary |
2 Introduction |
2.1 Key Highlights of the Report |
2.2 Report Description |
2.3 Market Scope & Segmentation |
2.4 Research Methodology |
2.5 Assumptions |
3 Australia Phenolic Board Market Overview |
3.1 Australia Country Macro Economic Indicators |
3.2 Australia Phenolic Board Market Revenues & Volume, 2022 & 2032F |
3.3 Australia Phenolic Board Market - Industry Life Cycle |
3.4 Australia Phenolic Board Market - Porter's Five Forces |
3.5 Australia Phenolic Board Market Revenues & Volume Share, By Thickness, 2022 & 2032F |
3.6 Australia Phenolic Board Market Revenues & Volume Share, By Application, 2022 & 2032F |
3.7 Australia Phenolic Board Market Revenues & Volume Share, By End Use, 2022 & 2032F |
4 Australia Phenolic Board Market Dynamics |
4.1 Impact Analysis |
4.2 Market Drivers |
4.2.1 Growing demand for energy-efficient and sustainable construction materials |
4.2.2 Increasing emphasis on fire-resistant building materials |
4.2.3 Rise in construction activities and infrastructure development in Australia |
4.3 Market Restraints |
4.3.1 Fluctuating raw material prices impacting production costs |
4.3.2 Competition from alternative materials such as foam boards or mineral wool |
4.3.3 Regulatory challenges and compliance requirements in the construction industry |
5 Australia Phenolic Board Market Trends |
6 Australia Phenolic Board Market, By Types |
6.1 Australia Phenolic Board Market, By Thickness |
6.1.1 Overview and Analysis |
6.1.2 Australia Phenolic Board Market Revenues & Volume, By Thickness, 2022 - 2032F |
6.1.3 Australia Phenolic Board Market Revenues & Volume, By ?40 mm, 2022 - 2032F |
6.1.4 Australia Phenolic Board Market Revenues & Volume, By >40 mm, 2022 - 2032F |
6.2 Australia Phenolic Board Market, By Application |
6.2.1 Overview and Analysis |
6.2.2 Australia Phenolic Board Market Revenues & Volume, By Interior, 2022 - 2032F |
6.2.3 Australia Phenolic Board Market Revenues & Volume, By Building and Construction, 2022 - 2032F |
6.2.4 Australia Phenolic Board Market Revenues & Volume, By Insulation Panel, 2022 - 2032F |
6.2.5 Australia Phenolic Board Market Revenues & Volume, By Exterior, 2022 - 2032F |
6.2.6 Australia Phenolic Board Market Revenues & Volume, By Furniture, 2022 - 2032F |
6.2.7 Australia Phenolic Board Market Revenues & Volume, By Others, 2022 - 2032F |
6.3 Australia Phenolic Board Market, By End Use |
6.3.1 Overview and Analysis |
6.3.2 Australia Phenolic Board Market Revenues & Volume, By Residential, 2022 - 2032F |
6.3.3 Australia Phenolic Board Market Revenues & Volume, By Commercial, 2022 - 2032F |
6.3.4 Australia Phenolic Board Market Revenues & Volume, By Industrial, 2022 - 2032F |
7 Australia Phenolic Board Market Import-Export Trade Statistics |
7.1 Australia Phenolic Board Market Export to Major Countries |
7.2 Australia Phenolic Board Market Imports from Major Countries |
8 Australia Phenolic Board Market Key Performance Indicators |
8.1 Energy efficiency ratings of buildings using phenolic boards |
8.2 Number of fire incidents in buildings using phenolic boards |
8.3 Percentage of construction projects specifying phenolic boards for insulation purposes. |
9 Australia Phenolic Board Market - Opportunity Assessment |
9.1 Australia Phenolic Board Market Opportunity Assessment, By Thickness, 2022 & 2032F |
9.2 Australia Phenolic Board Market Opportunity Assessment, By Application, 2022 & 2032F |
9.3 Australia Phenolic Board Market Opportunity Assessment, By End Use, 2022 & 2032F |
10 Australia Phenolic Board Market - Competitive Landscape |
10.1 Australia Phenolic Board Market Revenue Share, By Companies, 2025 |
10.2 Australia Phenolic Board Market Competitive Benchmarking, By Operating and Technical Parameters |
11 Company Profiles |
12 Recommendations |
13 Disclaimer |
Global Go To Market Strategy - 2030
Export potential enables firms to identify high-growth global markets with greater confidence by combining advanced trade intelligence with a structured quantitative methodology. The framework analyzes emerging demand trends and country-level import patterns while integrating macroeconomic and trade datasets such as GDP and population forecasts, bilateral import–export flows, tariff structures, elasticity differentials between developed and developing economies, geographic distance, and import demand projections. Using weighted trade values from 2020–2024 as the base period to project country-to-country export potential for 2030, these inputs are operationalized through calculated drivers such as gravity model parameters, tariff impact factors, and projected GDP per-capita growth. Through an analysis of hidden potentials, demand hotspots, and market conditions that are most favorable to success, this method enables firms to focus on target countries, maximize returns, and global expansion with data, backed by accuracy.
By factoring in the projected importer demand gap that is currently unmet and could be potential opportunity, it identifies the potential for the Exporter (Country) among 190 countries, against the general trade analysis, which identifies the biggest importer or exporter.
To discover high-growth global markets and optimize your business strategy:
Click Here
Pricing
- Single User License$ 1,995
- Department License$ 2,400
- Site License$ 3,120
- Global License$ 3,795

Leadership Perspectives from Industry Events
Search
Thought Leadership and Analyst Meet


Our Clients
6WResearch In News
- India Export Attractiveness Tracker 2026
- India Air Conditioner Market Set for Strong Rebound in 2026 After Weather-Led Correction and GST-Driven Recovery: 6Wresearch
- ADAS in India: How Automatic Emergency Braking, Blind Spot Detection & Driver Monitoring are Transforming Road Safety
- Doha a strategic location for EV manufacturing hub: IPA Qatar
- Demand for luxury TVs surging in the GCC, says Samsung
- Empowering Growth: The Thriving Journey of Bangladesh’s Cable Industry
Latest Reports
- Nicaragua RPG Gaming Market (2026-2032)
- New Zealand RPG Gaming Market (2026-2032)
- Netherlands RPG Gaming Market (2026-2032)
- Nauru RPG Gaming Market (2026-2032)
- Namibia RPG Gaming Market (2026-2032)
- Mozambique RPG Gaming Market (2026-2032)
- Montenegro RPG Gaming Market (2026-2032)
- Mongolia RPG Gaming Market (2026-2032)
- Monaco RPG Gaming Market (2026-2032)
- Micronesia RPG Gaming Market (2026-2032)
Industry Events and Analyst Meet

EV India Expo 2026

HIMTEX 2026

India Refining Summit 2026

India EV Show 2026

EV tech India Expo 2026
Whitepaper
- Middle East & Africa Commercial Security Market Click here to view more.
- Middle East & Africa Fire Safety Systems & Equipment Market Click here to view more.
- GCC Drone Market Click here to view more.
- Middle East Lighting Fixture Market Click here to view more.
- GCC Physical & Perimeter Security Market Click here to view more.