Australia Phthalic anhydride Market Outlook | Companies, Value, Revenue, Forecast, Growth, Industry, COVID-19 IMPACT, Analysis, Share, Trends & Size
Market Forecast By Process Type (O-Xylene Catalytic Oxidation, Napthalene Catalytic Oxidation), By Applications (Plasticizer, Polyester Resin, Alkyd Resin, Polyester Polyols, Dyes, Medicine, Insecticides, Others), By End-users (Automotive & Transportation, Building & Construction, Paints & Coatings, Marine, Electrical & Electronics, Plastics, Agriculture, Others) And Competitive Landscape
| Product Code: ETC088614 | Publication Date: Jun 2021 | Updated Date: Jan 2026 | Product Type: Report | |
| Publisher: 6Wresearch | Author: Ravi Bhandari | No. of Pages: 70 | No. of Figures: 35 | No. of Tables: 5 |
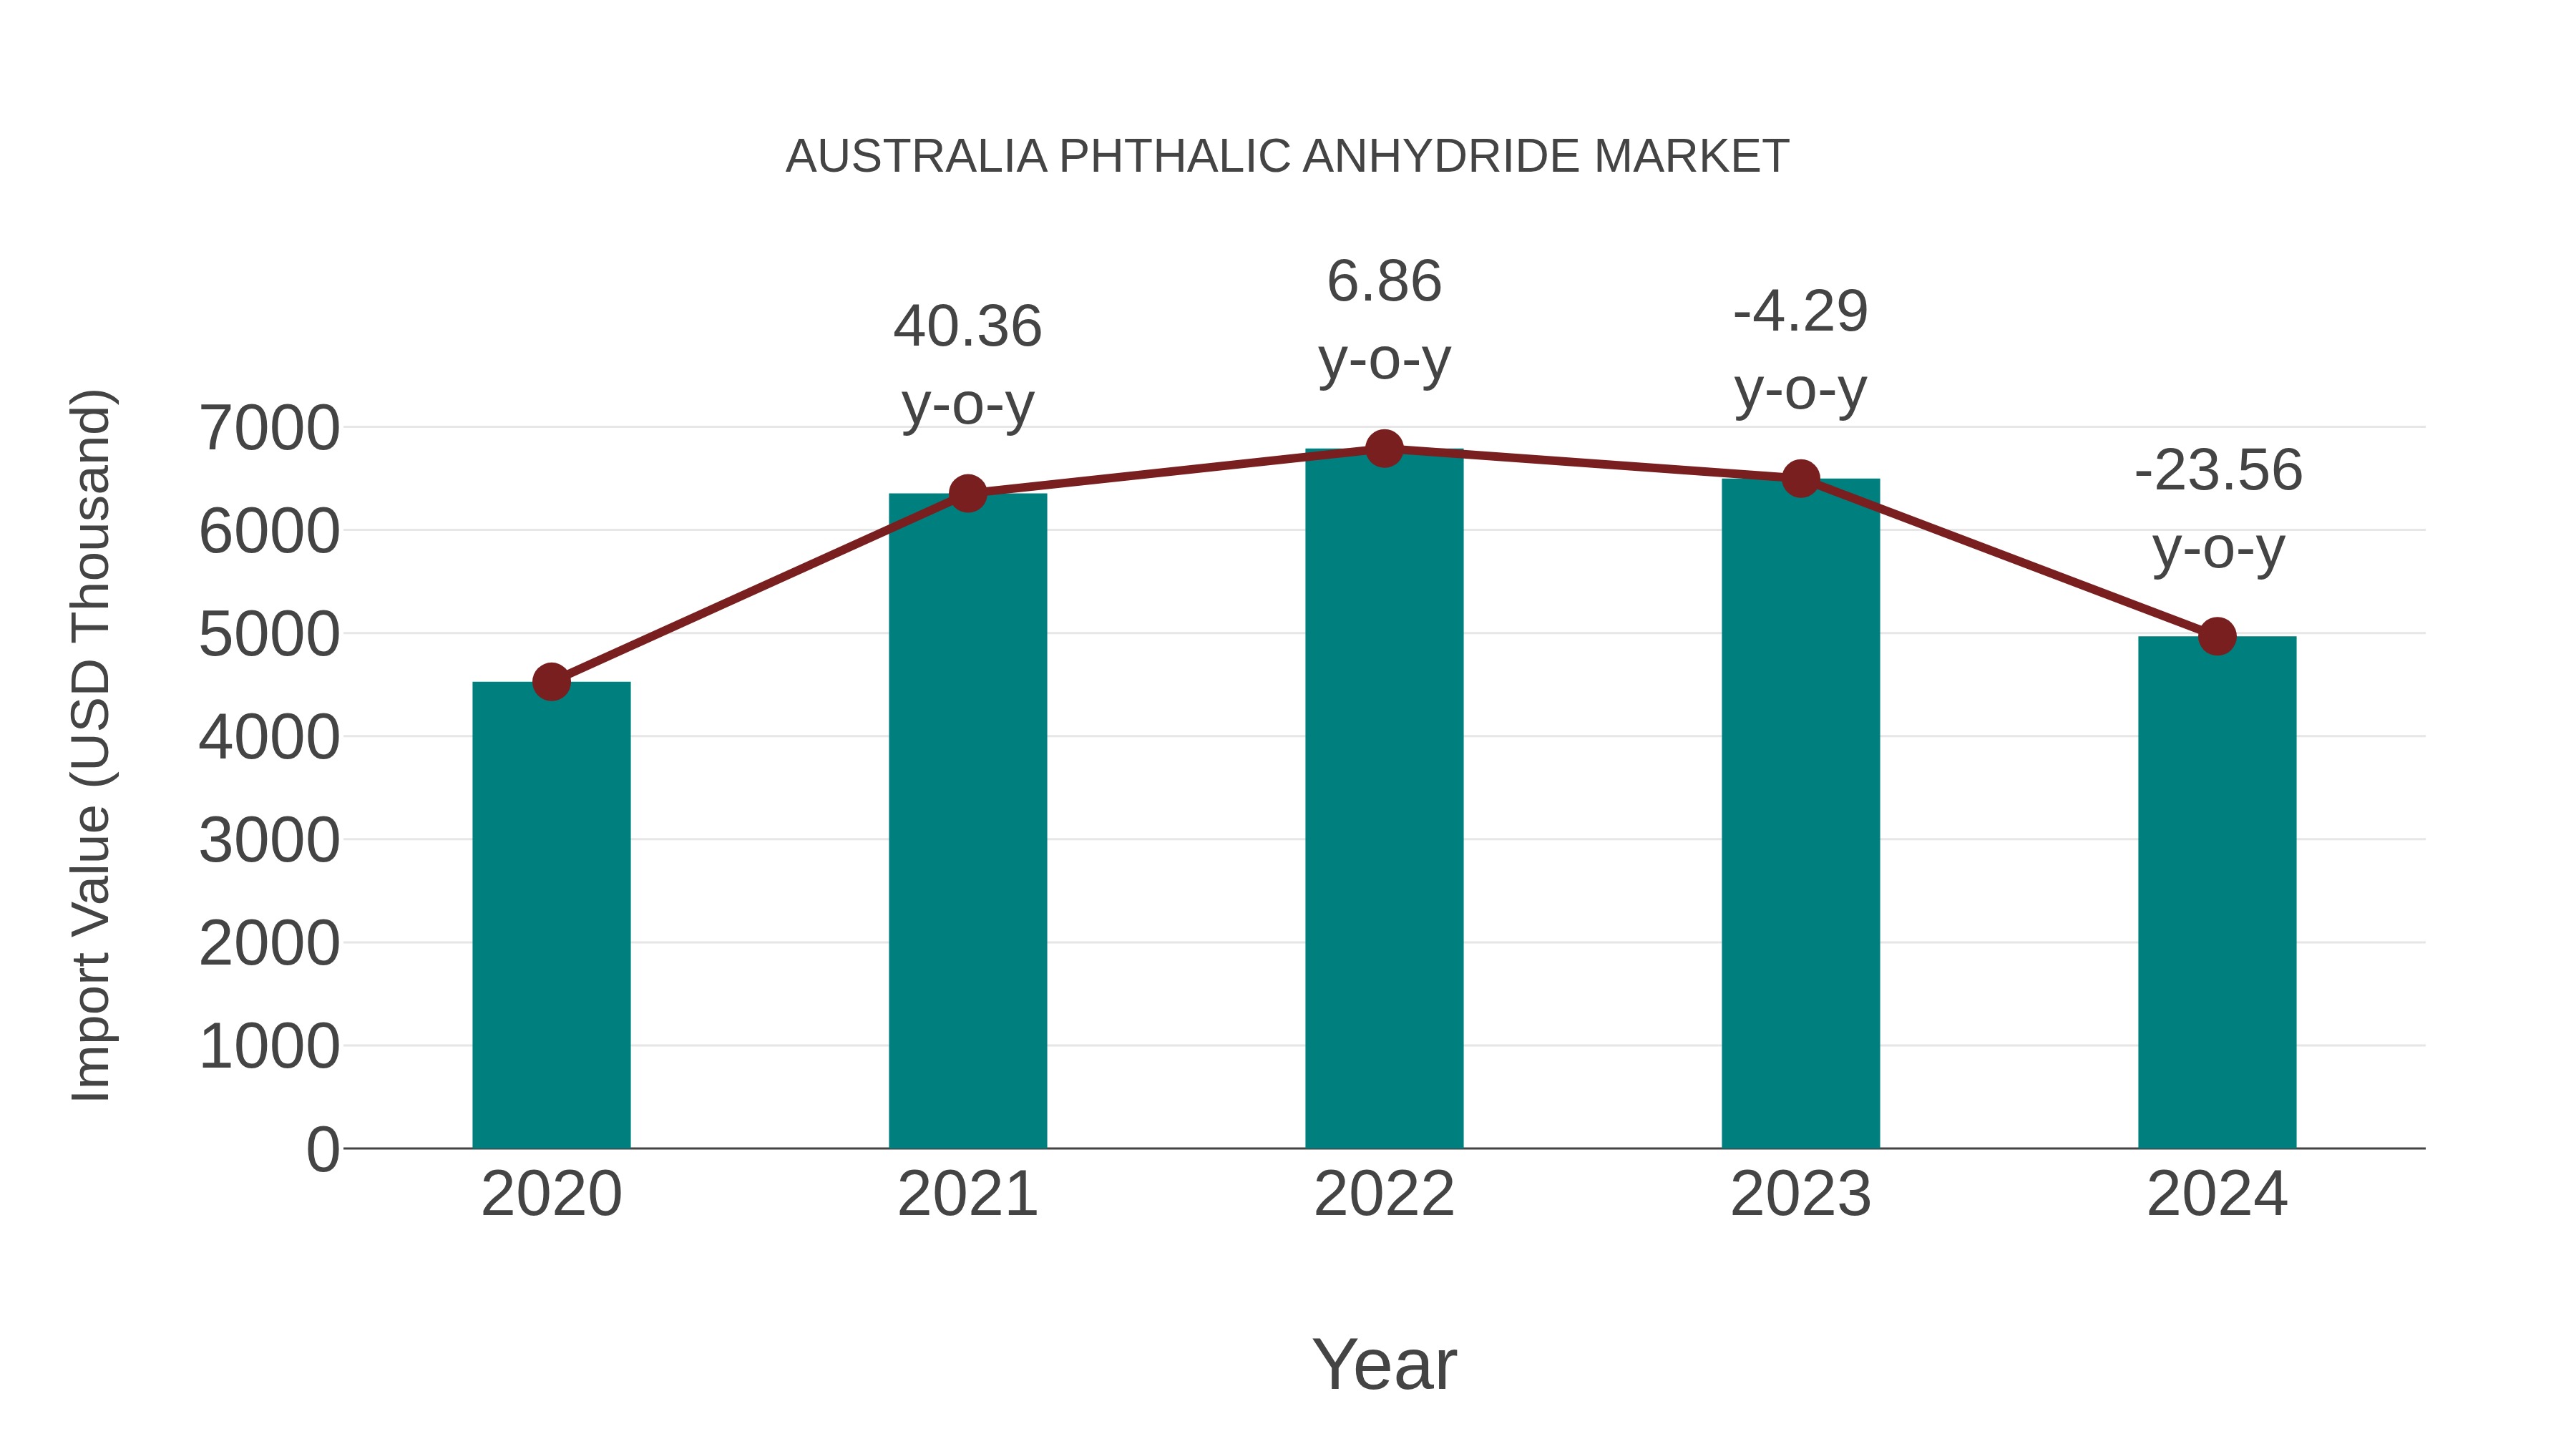
Australia Phthalic Anhydride Market: Import Trend Analysis
Australia`s import trend for phthalic anhydride in 2024 experienced a notable decline of -23.56% compared to 2023. The compound annual growth rate (CAGR) for imports during the period 2020-2024 stood at 2.35%. This negative growth in 2024 could be attributed to shifts in market demand or changes in trade policies impacting import momentum.
Australia Phthalic Anhydride Market Synopsis
Phthalic anhydride is a key ingredient in plasticizers, resins, and coatings, making it an essential chemical in Australia`s industrial sector. Demand is driven by the construction and automotive industries, where phthalic anhydride is used in flexible PVC production. The market is influenced by environmental regulations regarding plasticizers and sustainable alternatives.
Drivers of the market
Phthalic anhydride plays a vital role in plasticizers, resins, and coatings manufacturing in Australia. The demand for flexible PVC products in construction and automotive industries is a key driver for this market. Innovations in sustainable and phthalate-free plasticizers are also influencing market trends.
Challenges of the market
The phthalic anhydride market in Australia faces challenges due to environmental regulations limiting the use of phthalate-based products. High raw material costs and competition from alternative plasticizers also impact market growth. Additionally, fluctuations in demand from end-use industries such as plastics and coatings create uncertainty for manufacturers.
Investment opportunities in the Market
The phthalic anhydride market in Australia is driven by demand from the plastics, paints, and coatings industries. Investment opportunities exist in efficient production methods, research into phthalate-free alternatives, and supply chain improvements to meet regulatory standards. With the construction sectors growth, demand for phthalic anhydride-based products is expected to rise.
Government Policy of the market
Phthalic anhydride, widely used in plasticizers and coatings, is regulated under Australia`s chemical safety laws. The government mandates strict handling, transportation, and storage requirements to prevent environmental contamination. Regulations also control emissions from phthalic anhydride production, with industries required to implement pollution reduction measures. Trade policies impact the import and export of the compound, ensuring compliance with global chemical safety standards and promoting environmentally friendly alternatives.
Key Highlights of the Report:
- Australia Phthalic anhydride Market Outlook
- Market Size of Australia Phthalic anhydride Market, 2024
- Forecast of Australia Phthalic anhydride Market, 2031
- Historical Data and Forecast of Australia Phthalic anhydride Revenues & Volume for the Period 2018 - 2031
- Australia Phthalic anhydride Market Trend Evolution
- Australia Phthalic anhydride Market Drivers and Challenges
- Australia Phthalic anhydride Price Trends
- Australia Phthalic anhydride Porter's Five Forces
- Australia Phthalic anhydride Industry Life Cycle
- Historical Data and Forecast of Australia Phthalic anhydride Market Revenues & Volume By Process Type for the Period 2018 - 2031
- Historical Data and Forecast of Australia Phthalic anhydride Market Revenues & Volume By O-Xylene Catalytic Oxidation for the Period 2018 - 2031
- Historical Data and Forecast of Australia Phthalic anhydride Market Revenues & Volume By Napthalene Catalytic Oxidation for the Period 2018 - 2031
- Historical Data and Forecast of Australia Phthalic anhydride Market Revenues & Volume By Applications for the Period 2018 - 2031
- Historical Data and Forecast of Australia Phthalic anhydride Market Revenues & Volume By Plasticizer for the Period 2018 - 2031
- Historical Data and Forecast of Australia Phthalic anhydride Market Revenues & Volume By Polyester Resin for the Period 2018 - 2031
- Historical Data and Forecast of Australia Phthalic anhydride Market Revenues & Volume By Alkyd Resin for the Period 2018 - 2031
- Historical Data and Forecast of Australia Phthalic anhydride Market Revenues & Volume By Polyester Polyols for the Period 2018 - 2031
- Historical Data and Forecast of Australia Phthalic anhydride Market Revenues & Volume By Dyes for the Period 2018 - 2031
- Historical Data and Forecast of Australia Phthalic anhydride Market Revenues & Volume By Medicine for the Period 2018 - 2031
- Historical Data and Forecast of Australia Phthalic anhydride Market Revenues & Volume By Insecticides for the Period 2018 - 2031
- Historical Data and Forecast of Australia Phthalic anhydride Market Revenues & Volume By Others for the Period 2018 - 2031
- Historical Data and Forecast of Australia Phthalic anhydride Market Revenues & Volume By End-users for the Period 2018 - 2031
- Historical Data and Forecast of Australia Phthalic anhydride Market Revenues & Volume By Automotive & Transportation for the Period 2018 - 2031
- Historical Data and Forecast of Australia Phthalic anhydride Market Revenues & Volume By Building & Construction for the Period 2018 - 2031
- Historical Data and Forecast of Australia Phthalic anhydride Market Revenues & Volume By Paints & Coatings for the Period 2018 - 2031
- Historical Data and Forecast of Australia Phthalic anhydride Market Revenues & Volume By Marine for the Period 2018 - 2031
- Historical Data and Forecast of Australia Phthalic anhydride Market Revenues & Volume By Electrical & Electronics for the Period 2018 - 2031
- Historical Data and Forecast of Australia Phthalic anhydride Market Revenues & Volume By Plastics for the Period 2018 - 2031
- Historical Data and Forecast of Australia Phthalic anhydride Market Revenues & Volume By Agriculture for the Period 2018 - 2031
- Historical Data and Forecast of Australia Phthalic anhydride Market Revenues & Volume By Others for the Period 2018 - 2031
- Australia Phthalic anhydride Import Export Trade Statistics
- Market Opportunity Assessment By Process Type
- Market Opportunity Assessment By Applications
- Market Opportunity Assessment By End-users
- Australia Phthalic anhydride Top Companies Market Share
- Australia Phthalic anhydride Competitive Benchmarking By Technical and Operational Parameters
- Australia Phthalic anhydride Company Profiles
- Australia Phthalic anhydride Key Strategic Recommendations
Frequently Asked Questions About the Market Study (FAQs):
6Wresearch actively monitors the Australia Phthalic anhydride Market and publishes its comprehensive annual report, highlighting emerging trends, growth drivers, revenue analysis, and forecast outlook. Our insights help businesses to make data-backed strategic decisions with ongoing market dynamics. Our analysts track relevent industries related to the Australia Phthalic anhydride Market, allowing our clients with actionable intelligence and reliable forecasts tailored to emerging regional needs.
Yes, we provide customisation as per your requirements. To learn more, feel free to contact us on sales@6wresearch.com
1 Executive Summary |
2 Introduction |
2.1 Key Highlights of the Report |
2.2 Report Description |
2.3 Market Scope & Segmentation |
2.4 Research Methodology |
2.5 Assumptions |
3 Australia Phthalic anhydride Market Overview |
3.1 Australia Country Macro Economic Indicators |
3.2 Australia Phthalic anhydride Market Revenues & Volume, 2021 & 2031F |
3.3 Australia Phthalic anhydride Market - Industry Life Cycle |
3.4 Australia Phthalic anhydride Market - Porter's Five Forces |
3.5 Australia Phthalic anhydride Market Revenues & Volume Share, By Process Type, 2021 & 2031F |
3.6 Australia Phthalic anhydride Market Revenues & Volume Share, By Applications, 2021 & 2031F |
3.7 Australia Phthalic anhydride Market Revenues & Volume Share, By End-users, 2021 & 2031F |
4 Australia Phthalic anhydride Market Dynamics |
4.1 Impact Analysis |
4.2 Market Drivers |
4.2.1 Growth in end-use industries such as plastics, paints, and coatings |
4.2.2 Increasing demand for phthalic anhydride in the construction sector |
4.2.3 Favorable government regulations supporting the chemical industry in Australia |
4.3 Market Restraints |
4.3.1 Fluctuating prices of raw materials impacting production costs |
4.3.2 Environmental concerns leading to shift towards eco-friendly alternatives |
4.3.3 Intense competition from substitute products like bio-based chemicals |
5 Australia Phthalic anhydride Market Trends |
6 Australia Phthalic anhydride Market, By Types |
6.1 Australia Phthalic anhydride Market, By Process Type |
6.1.1 Overview and Analysis |
6.1.2 Australia Phthalic anhydride Market Revenues & Volume, By Process Type, 2021-2031F |
6.1.3 Australia Phthalic anhydride Market Revenues & Volume, By O-Xylene Catalytic Oxidation, 2021-2031F |
6.1.4 Australia Phthalic anhydride Market Revenues & Volume, By Napthalene Catalytic Oxidation, 2021-2031F |
6.2 Australia Phthalic anhydride Market, By Applications |
6.2.1 Overview and Analysis |
6.2.2 Australia Phthalic anhydride Market Revenues & Volume, By Plasticizer, 2021-2031F |
6.2.3 Australia Phthalic anhydride Market Revenues & Volume, By Polyester Resin, 2021-2031F |
6.2.4 Australia Phthalic anhydride Market Revenues & Volume, By Alkyd Resin, 2021-2031F |
6.2.5 Australia Phthalic anhydride Market Revenues & Volume, By Polyester Polyols, 2021-2031F |
6.2.6 Australia Phthalic anhydride Market Revenues & Volume, By Dyes, 2021-2031F |
6.2.7 Australia Phthalic anhydride Market Revenues & Volume, By Medicine, 2021-2031F |
6.2.8 Australia Phthalic anhydride Market Revenues & Volume, By Others, 2021-2031F |
6.2.9 Australia Phthalic anhydride Market Revenues & Volume, By Others, 2021-2031F |
6.3 Australia Phthalic anhydride Market, By End-users |
6.3.1 Overview and Analysis |
6.3.2 Australia Phthalic anhydride Market Revenues & Volume, By Automotive & Transportation, 2021-2031F |
6.3.3 Australia Phthalic anhydride Market Revenues & Volume, By Building & Construction, 2021-2031F |
6.3.4 Australia Phthalic anhydride Market Revenues & Volume, By Paints & Coatings, 2021-2031F |
6.3.5 Australia Phthalic anhydride Market Revenues & Volume, By Marine, 2021-2031F |
6.3.6 Australia Phthalic anhydride Market Revenues & Volume, By Electrical & Electronics, 2021-2031F |
6.3.7 Australia Phthalic anhydride Market Revenues & Volume, By Plastics, 2021-2031F |
6.3.8 Australia Phthalic anhydride Market Revenues & Volume, By Others, 2021-2031F |
6.3.9 Australia Phthalic anhydride Market Revenues & Volume, By Others, 2021-2031F |
7 Australia Phthalic anhydride Market Import-Export Trade Statistics |
7.1 Australia Phthalic anhydride Market Export to Major Countries |
7.2 Australia Phthalic anhydride Market Imports from Major Countries |
8 Australia Phthalic anhydride Market Key Performance Indicators |
8.1 Energy efficiency improvements in phthalic anhydride production process |
8.2 Adoption rate of sustainable practices in manufacturing |
8.3 Percentage increase in demand from key end-use industries |
9 Australia Phthalic anhydride Market - Opportunity Assessment |
9.1 Australia Phthalic anhydride Market Opportunity Assessment, By Process Type, 2021 & 2031F |
9.2 Australia Phthalic anhydride Market Opportunity Assessment, By Applications, 2021 & 2031F |
9.3 Australia Phthalic anhydride Market Opportunity Assessment, By End-users, 2021 & 2031F |
10 Australia Phthalic anhydride Market - Competitive Landscape |
10.1 Australia Phthalic anhydride Market Revenue Share, By Companies, 2024 |
10.2 Australia Phthalic anhydride Market Competitive Benchmarking, By Operating and Technical Parameters |
11 Company Profiles |
12 Recommendations |
13 Disclaimer |
Global Go To Market Strategy - 2030
Export potential enables firms to identify high-growth global markets with greater confidence by combining advanced trade intelligence with a structured quantitative methodology. The framework analyzes emerging demand trends and country-level import patterns while integrating macroeconomic and trade datasets such as GDP and population forecasts, bilateral import–export flows, tariff structures, elasticity differentials between developed and developing economies, geographic distance, and import demand projections. Using weighted trade values from 2020–2024 as the base period to project country-to-country export potential for 2030, these inputs are operationalized through calculated drivers such as gravity model parameters, tariff impact factors, and projected GDP per-capita growth. Through an analysis of hidden potentials, demand hotspots, and market conditions that are most favorable to success, this method enables firms to focus on target countries, maximize returns, and global expansion with data, backed by accuracy.
By factoring in the projected importer demand gap that is currently unmet and could be potential opportunity, it identifies the potential for the Exporter (Country) among 190 countries, against the general trade analysis, which identifies the biggest importer or exporter.
To discover high-growth global markets and optimize your business strategy:
Click Here
Pricing
- Single User License$ 1,995
- Department License$ 2,400
- Site License$ 3,120
- Global License$ 3,795

Leadership Perspectives from Industry Events
Search
Thought Leadership and Analyst Meet


Our Clients
6WResearch In News
- Doha a strategic location for EV manufacturing hub: IPA Qatar
- Demand for luxury TVs surging in the GCC, says Samsung
- Empowering Growth: The Thriving Journey of Bangladesh’s Cable Industry
- Demand for luxury TVs surging in the GCC, says Samsung
- Video call with a traditional healer? Once unthinkable, it’s now common in South Africa
- Intelligent Buildings To Smooth GCC’s Path To Net Zero
Latest Reports
- New Zealand Aseptic Manufacturing Market (2026-2032)
- Netherlands Aseptic Manufacturing Market (2026-2032)
- Nauru Aseptic Manufacturing Market (2026-2032)
- Namibia Aseptic Manufacturing Market (2026-2032)
- Mozambique Aseptic Manufacturing Market (2026-2032)
- Montenegro Aseptic Manufacturing Market (2026-2032)
- Mongolia Aseptic Manufacturing Market (2026-2032)
- Monaco Aseptic Manufacturing Market (2026-2032)
- Micronesia Aseptic Manufacturing Market (2026-2032)
- Mauritius Aseptic Manufacturing Market (2026-2032)
Industry Events and Analyst Meet

HIMTEX 2026

India Refining Summit 2026

India EV Show 2026

EV tech India Expo 2026

Auto Tech Asia 2026
Whitepaper
- Middle East & Africa Commercial Security Market Click here to view more.
- Middle East & Africa Fire Safety Systems & Equipment Market Click here to view more.
- GCC Drone Market Click here to view more.
- Middle East Lighting Fixture Market Click here to view more.
- GCC Physical & Perimeter Security Market Click here to view more.