Australia Pour Point Depressant Market (2026-2032) Outlook | Growth, Trends, Companies, Analysis, Revenue, Size, Industry, Share, Value, Forecast
Market Forecast By Chemistry (polyalkylmethacrylates, styrene esters, ethylene co vinyl acetate, poly alpha olefin, others), By End User (Lubricant Industry , Oil & Gas Industry) And Competitive Landscape
| Product Code: ETC4484256 | Publication Date: Jul 2023 | Updated Date: Mar 2026 | Product Type: Report | |
| Publisher: 6Wresearch | Author: Dhaval Chaurasia | No. of Pages: 85 | No. of Figures: 45 | No. of Tables: 25 |
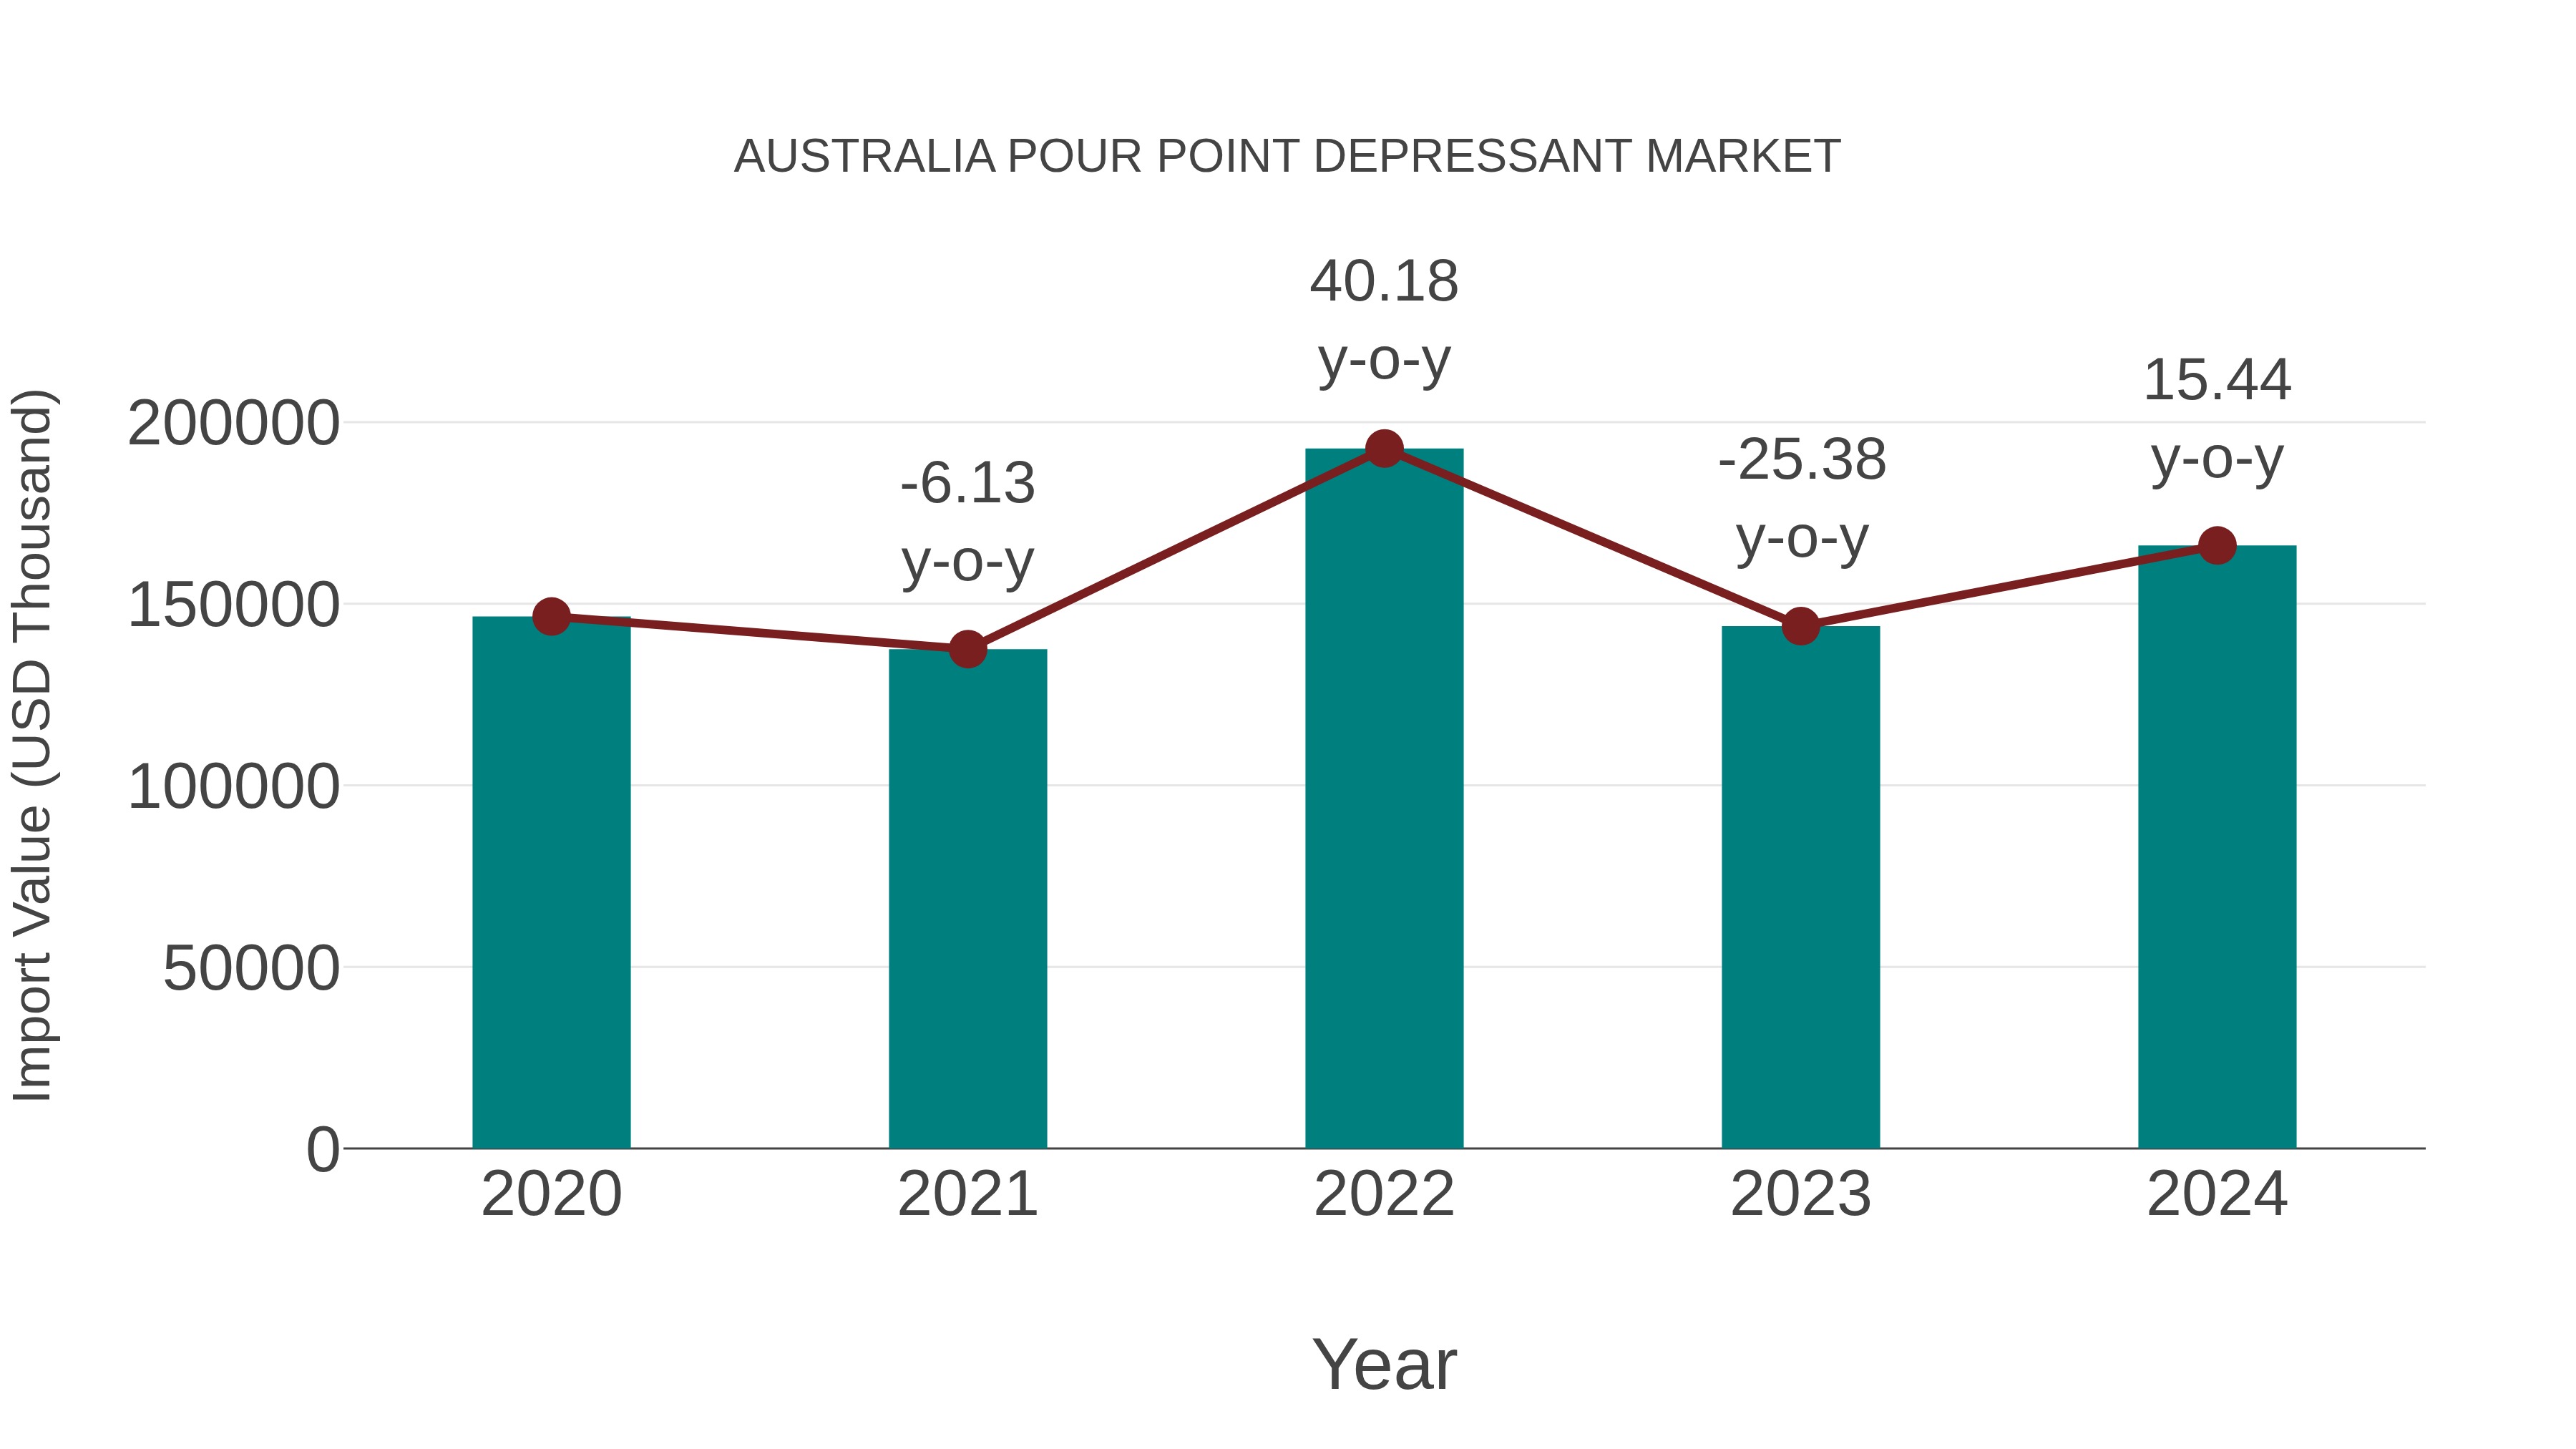
Australia Pour Point Depressant Market: Import Trend Analysis
Australia`s import trend for pour point depressants in 2024 showed a notable growth rate of 15.44% compared to the previous year, with a compound annual growth rate (CAGR) of 3.18% from 2020 to 2024. This import momentum can be attributed to the increasing demand for pour point depressants in the Australian market, indicating a shift towards enhanced performance and efficiency in the oil and gas sector.
Australia Pour Point Depressant Market Overview
The pour point depressant market in Australia is experiencing steady growth due to its crucial role in improving the flow properties of lubricants and fuels at low temperatures. The oil and gas sector remains a key consumer, as pour point depressants enhance the performance of crude oil, diesel, and lubricants in colder environments. With ongoing advancements in chemical formulation, new depressants are being developed to optimize fuel efficiency and reduce emissions.
Drivers of the market
The pour point depressant market in Australia is driven by increasing demand for improved cold flow properties in lubricants and fuels. Rising adoption of pour point depressants for enhancing product performance in low-temperature environments is fueling market growth. Enhanced focus on developing high-performance and environmentally friendly formulations is supporting market performance.
Challenges of the market
The pour point depressant market in Australia faces challenges from fluctuations in crude oil prices, which directly affect demand for lubricants and fuel additives. Stringent environmental regulations regarding emissions and the use of petroleum-based products increase production costs. Limited domestic manufacturing capacity and dependence on imports further expose the market to supply chain disruptions.
Investment opportunities in the Market
The Australia Pour Point Depressant Market presents growth opportunities due to increasing demand in the oil and gas industry. Investment opportunities include developing high-performance depressants, improving low-temperature performance, and expanding into offshore and deepwater projects.
Government Policy of the market
Pour point depressants used in the oil and gas sector are regulated under the Petroleum and Gas (Production and Safety) Act 2004. The government mandates that chemical compositions and safety data of pour point depressants be disclosed under the AICIS. Environmental guidelines for handling and disposal are enforced under the Environmental Protection Act 1997.
Key Highlights of the Report:
- Australia Pour Point Depressant Market Outlook
- Market Size of Australia Pour Point Depressant Market, 2025
- Forecast of Australia Pour Point Depressant Market, 2032
- Historical Data and Forecast of Australia Pour Point Depressant Revenues & Volume for the Period 2022-2032F
- Australia Pour Point Depressant Market Trend Evolution
- Australia Pour Point Depressant Market Drivers and Challenges
- Australia Pour Point Depressant Price Trends
- Australia Pour Point Depressant Porter's Five Forces
- Australia Pour Point Depressant Industry Life Cycle
- Historical Data and Forecast of Australia Pour Point Depressant Market Revenues & Volume By Chemistry for the Period 2022-2032F
- Historical Data and Forecast of Australia Pour Point Depressant Market Revenues & Volume By polyalkylmethacrylates for the Period 2022-2032F
- Historical Data and Forecast of Australia Pour Point Depressant Market Revenues & Volume By styrene esters for the Period 2022-2032F
- Historical Data and Forecast of Australia Pour Point Depressant Market Revenues & Volume By ethylene co vinyl acetate for the Period 2022-2032F
- Historical Data and Forecast of Australia Pour Point Depressant Market Revenues & Volume By poly alpha olefin for the Period 2022-2032F
- Historical Data and Forecast of Australia Pour Point Depressant Market Revenues & Volume By others for the Period 2022-2032F
- Historical Data and Forecast of Australia Pour Point Depressant Market Revenues & Volume By End User for the Period 2022-2032F
- Historical Data and Forecast of Australia Pour Point Depressant Market Revenues & Volume By Lubricant Industry for the Period 2022-2032F
- Historical Data and Forecast of Australia Pour Point Depressant Market Revenues & Volume By Oil & Gas Industry for the Period 2022-2032F
- Australia Pour Point Depressant Import Export Trade Statistics
- Market Opportunity Assessment By Chemistry
- Market Opportunity Assessment By End User
- Australia Pour Point Depressant Top Companies Market Share
- Australia Pour Point Depressant Competitive Benchmarking By Technical and Operational Parameters
- Australia Pour Point Depressant Company Profiles
- Australia Pour Point Depressant Key Strategic Recommendations
Australia Pour Point Depressant Market (2026-2032): FAQs
6Wresearch actively monitors the Australia Pour Point Depressant Market and publishes its comprehensive annual report, highlighting emerging trends, growth drivers, revenue analysis, and forecast outlook. Our insights help businesses to make data-backed strategic decisions with ongoing market dynamics. Our analysts track relevent industries related to the Australia Pour Point Depressant Market, allowing our clients with actionable intelligence and reliable forecasts tailored to emerging regional needs.
Yes, we provide customisation as per your requirements. To learn more, feel free to contact us on sales@6wresearch.com
1 Executive Summary |
2 Introduction |
2.1 Key Highlights of the Report |
2.2 Report Description |
2.3 Market Scope & Segmentation |
2.4 Research Methodology |
2.5 Assumptions |
3 Australia Pour Point Depressant Market Overview |
3.1 Australia Country Macro Economic Indicators |
3.2 Australia Pour Point Depressant Market Revenues & Volume, 2022 & 2032F |
3.3 Australia Pour Point Depressant Market - Industry Life Cycle |
3.4 Australia Pour Point Depressant Market - Porter's Five Forces |
3.5 Australia Pour Point Depressant Market Revenues & Volume Share, By Chemistry, 2022 & 2032F |
3.6 Australia Pour Point Depressant Market Revenues & Volume Share, By End User, 2022 & 2032F |
4 Australia Pour Point Depressant Market Dynamics |
4.1 Impact Analysis |
4.2 Market Drivers |
4.2.1 Increasing demand for pour point depressants in the oil and gas industry due to the growing exploration and production activities in Australia. |
4.2.2 Stringent environmental regulations driving the need for efficient pour point depressants to enhance fuel quality and reduce emissions. |
4.2.3 Technological advancements leading to the development of more effective and eco-friendly pour point depressant products. |
4.3 Market Restraints |
4.3.1 Fluctuating crude oil prices impacting the investment decisions and budgets of oil and gas companies, affecting the demand for pour point depressants. |
4.3.2 Competition from alternative technologies and solutions that could potentially replace pour point depressants in certain applications. |
5 Australia Pour Point Depressant Market Trends |
6 Australia Pour Point Depressant Market, By Types |
6.1 Australia Pour Point Depressant Market, By Chemistry |
6.1.1 Overview and Analysis |
6.1.2 Australia Pour Point Depressant Market Revenues & Volume, By Chemistry, 2022-2032F |
6.1.3 Australia Pour Point Depressant Market Revenues & Volume, By polyalkylmethacrylates, 2022-2032F |
6.1.4 Australia Pour Point Depressant Market Revenues & Volume, By styrene esters, 2022-2032F |
6.1.5 Australia Pour Point Depressant Market Revenues & Volume, By ethylene co vinyl acetate, 2022-2032F |
6.1.6 Australia Pour Point Depressant Market Revenues & Volume, By poly alpha olefin, 2022-2032F |
6.1.7 Australia Pour Point Depressant Market Revenues & Volume, By others, 2022-2032F |
6.2 Australia Pour Point Depressant Market, By End User |
6.2.1 Overview and Analysis |
6.2.2 Australia Pour Point Depressant Market Revenues & Volume, By Lubricant Industry , 2022-2032F |
6.2.3 Australia Pour Point Depressant Market Revenues & Volume, By Oil & Gas Industry, 2022-2032F |
7 Australia Pour Point Depressant Market Import-Export Trade Statistics |
7.1 Australia Pour Point Depressant Market Export to Major Countries |
7.2 Australia Pour Point Depressant Market Imports from Major Countries |
8 Australia Pour Point Depressant Market Key Performance Indicators |
8.1 Research and development investment in new pour point depressant formulations. |
8.2 Number of patents filed for innovative pour point depressant technologies. |
8.3 Adoption rate of pour point depressants in key end-user industries such as oil and gas. |
9 Australia Pour Point Depressant Market - Opportunity Assessment |
9.1 Australia Pour Point Depressant Market Opportunity Assessment, By Chemistry, 2022 & 2032F |
9.2 Australia Pour Point Depressant Market Opportunity Assessment, By End User, 2022 & 2032F |
10 Australia Pour Point Depressant Market - Competitive Landscape |
10.1 Australia Pour Point Depressant Market Revenue Share, By Companies, 2025 |
10.2 Australia Pour Point Depressant Market Competitive Benchmarking, By Operating and Technical Parameters |
11 Company Profiles |
12 Recommendations |
13 Disclaimer |
Global Go To Market Strategy - 2030
Export potential enables firms to identify high-growth global markets with greater confidence by combining advanced trade intelligence with a structured quantitative methodology. The framework analyzes emerging demand trends and country-level import patterns while integrating macroeconomic and trade datasets such as GDP and population forecasts, bilateral import–export flows, tariff structures, elasticity differentials between developed and developing economies, geographic distance, and import demand projections. Using weighted trade values from 2020–2024 as the base period to project country-to-country export potential for 2030, these inputs are operationalized through calculated drivers such as gravity model parameters, tariff impact factors, and projected GDP per-capita growth. Through an analysis of hidden potentials, demand hotspots, and market conditions that are most favorable to success, this method enables firms to focus on target countries, maximize returns, and global expansion with data, backed by accuracy.
By factoring in the projected importer demand gap that is currently unmet and could be potential opportunity, it identifies the potential for the Exporter (Country) among 190 countries, against the general trade analysis, which identifies the biggest importer or exporter.
To discover high-growth global markets and optimize your business strategy:
Click Here
Pricing
- Single User License$ 1,995
- Department License$ 2,400
- Site License$ 3,120
- Global License$ 3,795

Leadership Perspectives from Industry Events
Search
Thought Leadership and Analyst Meet


Our Clients
6WResearch In News
- India Export Attractiveness Tracker 2026
- India Air Conditioner Market Set for Strong Rebound in 2026 After Weather-Led Correction and GST-Driven Recovery: 6Wresearch
- ADAS in India: How Automatic Emergency Braking, Blind Spot Detection & Driver Monitoring are Transforming Road Safety
- Doha a strategic location for EV manufacturing hub: IPA Qatar
- Demand for luxury TVs surging in the GCC, says Samsung
- Empowering Growth: The Thriving Journey of Bangladesh’s Cable Industry
Latest Reports
- Nicaragua RPG Gaming Market (2026-2032)
- New Zealand RPG Gaming Market (2026-2032)
- Netherlands RPG Gaming Market (2026-2032)
- Nauru RPG Gaming Market (2026-2032)
- Namibia RPG Gaming Market (2026-2032)
- Mozambique RPG Gaming Market (2026-2032)
- Montenegro RPG Gaming Market (2026-2032)
- Mongolia RPG Gaming Market (2026-2032)
- Monaco RPG Gaming Market (2026-2032)
- Micronesia RPG Gaming Market (2026-2032)
Industry Events and Analyst Meet

EV India Expo 2026

HIMTEX 2026

India Refining Summit 2026

India EV Show 2026

EV tech India Expo 2026
Whitepaper
- Middle East & Africa Commercial Security Market Click here to view more.
- Middle East & Africa Fire Safety Systems & Equipment Market Click here to view more.
- GCC Drone Market Click here to view more.
- Middle East Lighting Fixture Market Click here to view more.
- GCC Physical & Perimeter Security Market Click here to view more.