Australia Propionic Acid and Derivatives Market (2026-2032) | Outlook, Value, Analysis, Competitive Landscape, Companies, Trends, Growth, Forecast, Segmentation, Share, Size & Revenue, Industry
Market Forecast By Product (Propionic AcidDerivatives), By Grade (Industrial Grade/Technical Grade, Food Grade, Feed Grade, Pharma Grade), By Form (Dry, Liquid), By Type (Encapsulated, Non-Encapsulated), By Source (Natural, Synthetic), By Application (Food & Beverage, Feed, Pharmaceuticals, Cosmetics, Home & Personal Care, Agriculture, Industrial) And Competitive Landscape
| Product Code: ETC6189400 | Publication Date: Sep 2024 | Updated Date: Mar 2026 | Product Type: Market Research Report | |
| Publisher: 6Wresearch | Author: Sachin Kumar Rai | No. of Pages: 75 | No. of Figures: 35 | No. of Tables: 20 |
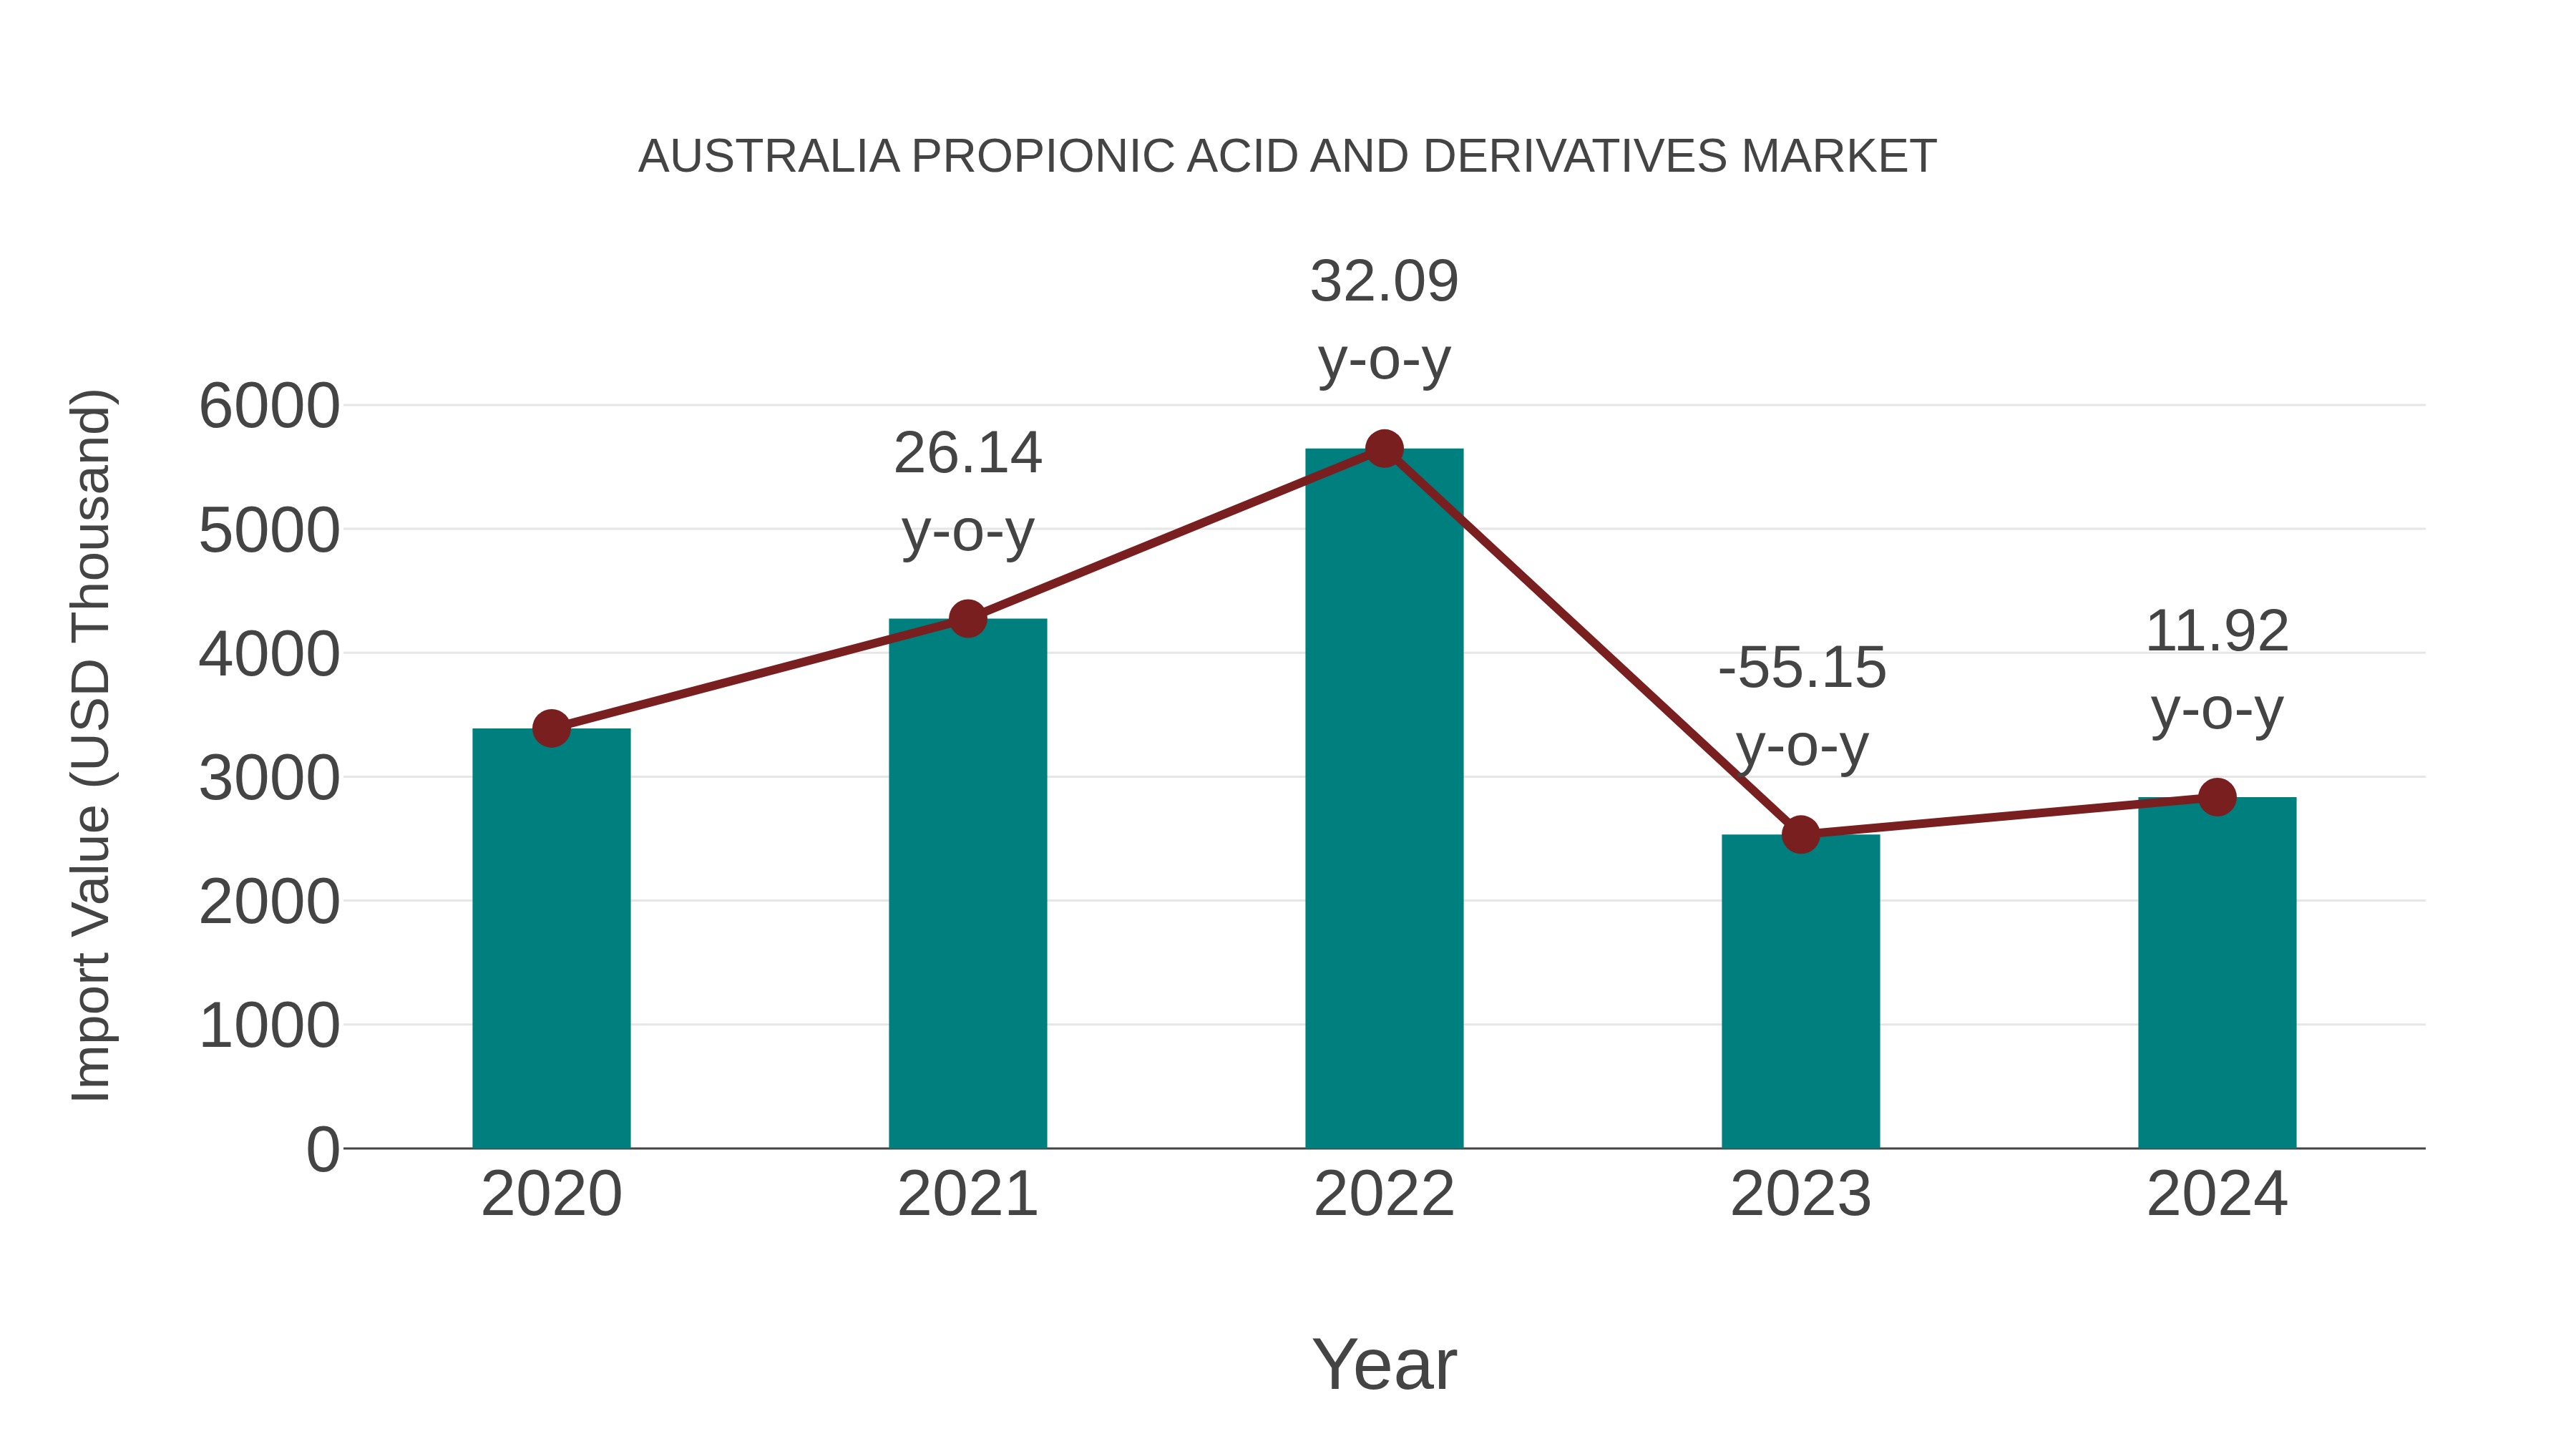
Australia Propionic Acid and Derivatives Market: Import Trend Analysis
In 2024, Australia`s import trend for propionic acid and derivatives experienced a growth rate of 11.92%, contrasting with a negative compound annual growth rate (CAGR) of -4.37% from 2020 to 2023. This shift indicates a potential demand recovery or a change in market dynamics influencing import momentum.
Australia Propionic Acid And Derivatives Market Overview
The propionic acid and derivatives market in Australia is part of the broader specialty chemicals sector, driven by the demand for preservatives in food, animal feed, and agricultural products. Propionic acid is commonly used to inhibit the growth of molds and bacteria in various products. The market is supported by the food and beverage industry, where the growing demand for safe and long-lasting products fuels the need for preservatives. However, the market faces challenges from consumer preferences for natural and organic products, which may limit the use of synthetic preservatives like propionic acid. Additionally, regulatory concerns over the use of certain chemicals in food products are also factors that could affect market dynamics.
Trends of the market
The propionic acid and derivatives market in Australia is witnessing growth, driven by the increasing demand for propionic acid in the food and beverage industry as a preservative. The rise in demand for processed food products, particularly in the bakery and dairy sectors, is fueling the growth of this market. Propionic acid derivatives are also gaining traction in the agricultural industry, where they are used as feed preservatives to enhance animal health and nutrition. Furthermore, the growing adoption of eco-friendly and sustainable chemicals is propelling the demand for bio-based propionic acid and its derivatives in various applications.
Challenges of the market
The Australia propionic acid and derivatives market is challenged by environmental and regulatory pressures. Propionic acid, used in various applications such as preservatives and herbicides, faces scrutiny due to concerns over its environmental impact. Stricter environmental regulations aimed at reducing the use of chemicals in agriculture and food preservation may limit its use. Additionally, the market is affected by price volatility in raw materials, such as natural gas and petroleum, which are integral to the production of propionic acid. The market also faces competition from alternative preservation methods and more sustainable chemicals.
Investment opportunities in the Market
Propionic acid and its derivatives have growing applications in food preservation, pharmaceuticals, and agriculture, making this market in Australia attractive for chemical investors. The rising demand for safer food additives and animal feed preservatives opens the door for manufacturing expansion and import substitution. Environmentally sustainable production methods and bio-based derivatives are especially compelling for eco-conscious investors.
Government Policy of the market
This market is regulated under chemical safety and environmental standards set by the National Industrial Chemicals Notification and Assessment Scheme (NICNAS). The governments focus on sustainable agriculture and bio-based alternatives is driving demand for safer chemical derivatives in food and feed applications.
Key Highlights of the Report:
- Australia Propionic Acid and Derivatives Market Outlook
- Market Size of Australia Propionic Acid and Derivatives Market, 2025
- Forecast of Australia Propionic Acid and Derivatives Market, 2032
- Historical Data and Forecast of Australia Propionic Acid and Derivatives Revenues & Volume for the Period 2022 - 2032F
- Australia Propionic Acid and Derivatives Market Trend Evolution
- Australia Propionic Acid and Derivatives Market Drivers and Challenges
- Australia Propionic Acid and Derivatives Price Trends
- Australia Propionic Acid and Derivatives Porter's Five Forces
- Australia Propionic Acid and Derivatives Industry Life Cycle
- Historical Data and Forecast of Australia Propionic Acid and Derivatives Market Revenues & Volume By Product for the Period 2022 - 2032F
- Historical Data and Forecast of Australia Propionic Acid and Derivatives Market Revenues & Volume By Propionic AcidDerivatives for the Period 2022 - 2032F
- Historical Data and Forecast of Australia Propionic Acid and Derivatives Market Revenues & Volume By Grade for the Period 2022 - 2032F
- Historical Data and Forecast of Australia Propionic Acid and Derivatives Market Revenues & Volume By Industrial Grade/Technical Grade for the Period 2022 - 2032F
- Historical Data and Forecast of Australia Propionic Acid and Derivatives Market Revenues & Volume By Food Grade for the Period 2022 - 2032F
- Historical Data and Forecast of Australia Propionic Acid and Derivatives Market Revenues & Volume By Feed Grade for the Period 2022 - 2032F
- Historical Data and Forecast of Australia Propionic Acid and Derivatives Market Revenues & Volume By Pharma Grade for the Period 2022 - 2032F
- Historical Data and Forecast of Australia Propionic Acid and Derivatives Market Revenues & Volume By Form for the Period 2022 - 2032F
- Historical Data and Forecast of Australia Propionic Acid and Derivatives Market Revenues & Volume By Dry for the Period 2022 - 2032F
- Historical Data and Forecast of Australia Propionic Acid and Derivatives Market Revenues & Volume By Liquid for the Period 2022 - 2032F
- Historical Data and Forecast of Australia Propionic Acid and Derivatives Market Revenues & Volume By Type for the Period 2022 - 2032F
- Historical Data and Forecast of Australia Propionic Acid and Derivatives Market Revenues & Volume By Encapsulated for the Period 2022 - 2032F
- Historical Data and Forecast of Australia Propionic Acid and Derivatives Market Revenues & Volume By Non-Encapsulated for the Period 2022 - 2032F
- Historical Data and Forecast of Australia Propionic Acid and Derivatives Market Revenues & Volume By Source for the Period 2022 - 2032F
- Historical Data and Forecast of Australia Propionic Acid and Derivatives Market Revenues & Volume By Natural for the Period 2022 - 2032F
- Historical Data and Forecast of Australia Propionic Acid and Derivatives Market Revenues & Volume By Synthetic for the Period 2022 - 2032F
- Historical Data and Forecast of Australia Propionic Acid and Derivatives Market Revenues & Volume By Application for the Period 2022 - 2032F
- Historical Data and Forecast of Australia Propionic Acid and Derivatives Market Revenues & Volume By Food & Beverage for the Period 2022 - 2032F
- Historical Data and Forecast of Australia Propionic Acid and Derivatives Market Revenues & Volume By Feed for the Period 2022 - 2032F
- Historical Data and Forecast of Australia Propionic Acid and Derivatives Market Revenues & Volume By Pharmaceuticals for the Period 2022 - 2032F
- Historical Data and Forecast of Australia Propionic Acid and Derivatives Market Revenues & Volume By Cosmetics for the Period 2022 - 2032F
- Historical Data and Forecast of Australia Propionic Acid and Derivatives Market Revenues & Volume By Home & Personal Care for the Period 2022 - 2032F
- Historical Data and Forecast of Australia Propionic Acid and Derivatives Market Revenues & Volume By Agriculture for the Period 2022 - 2032F
- Historical Data and Forecast of Australia Propionic Acid and Derivatives Market Revenues & Volume By Industrial for the Period 2022 - 2032F
- Australia Propionic Acid and Derivatives Import Export Trade Statistics
- Market Opportunity Assessment By Product
- Market Opportunity Assessment By Grade
- Market Opportunity Assessment By Form
- Market Opportunity Assessment By Type
- Market Opportunity Assessment By Source
- Market Opportunity Assessment By Application
- Australia Propionic Acid and Derivatives Top Companies Market Share
- Australia Propionic Acid and Derivatives Competitive Benchmarking By Technical and Operational Parameters
- Australia Propionic Acid and Derivatives Company Profiles
- Australia Propionic Acid and Derivatives Key Strategic Recommendations
Australia Propionic Acid and Derivatives Market (2026-2032): FAQs
6Wresearch actively monitors the Australia Propionic Acid and Derivatives Market and publishes its comprehensive annual report, highlighting emerging trends, growth drivers, revenue analysis, and forecast outlook. Our insights help businesses to make data-backed strategic decisions with ongoing market dynamics. Our analysts track relevent industries related to the Australia Propionic Acid and Derivatives Market, allowing our clients with actionable intelligence and reliable forecasts tailored to emerging regional needs.
Yes, we provide customisation as per your requirements. To learn more, feel free to contact us on sales@6wresearch.com
1 Executive Summary |
2 Introduction |
2.1 Key Highlights of the Report |
2.2 Report Description |
2.3 Market Scope & Segmentation |
2.4 Research Methodology |
2.5 Assumptions |
3 Australia Propionic Acid and Derivatives Market Overview |
3.1 Australia Country Macro Economic Indicators |
3.2 Australia Propionic Acid and Derivatives Market Revenues & Volume, 2022 & 2032F |
3.3 Australia Propionic Acid and Derivatives Market - Industry Life Cycle |
3.4 Australia Propionic Acid and Derivatives Market - Porter's Five Forces |
3.5 Australia Propionic Acid and Derivatives Market Revenues & Volume Share, By Product, 2022 & 2032F |
3.6 Australia Propionic Acid and Derivatives Market Revenues & Volume Share, By Grade, 2022 & 2032F |
3.7 Australia Propionic Acid and Derivatives Market Revenues & Volume Share, By Form, 2022 & 2032F |
3.8 Australia Propionic Acid and Derivatives Market Revenues & Volume Share, By Type, 2022 & 2032F |
3.9 Australia Propionic Acid and Derivatives Market Revenues & Volume Share, By Source, 2022 & 2032F |
3.10 Australia Propionic Acid and Derivatives Market Revenues & Volume Share, By Application, 2022 & 2032F |
4 Australia Propionic Acid and Derivatives Market Dynamics |
4.1 Impact Analysis |
4.2 Market Drivers |
4.2.1 Increasing demand for processed food products that use propionic acid and its derivatives as preservatives. |
4.2.2 Growing awareness regarding the benefits of propionic acid in animal feed for improving livestock health and performance. |
4.2.3 Rising adoption of propionic acid in pharmaceuticals and cosmetics industries for various applications. |
4.3 Market Restraints |
4.3.1 Stringent regulations and guidelines regarding the usage and concentration of propionic acid in food and feed products. |
4.3.2 Fluctuating prices of raw materials used in the production of propionic acid and derivatives. |
5 Australia Propionic Acid and Derivatives Market Trends |
6 Australia Propionic Acid and Derivatives Market, By Types |
6.1 Australia Propionic Acid and Derivatives Market, By Product |
6.1.1 Overview and Analysis |
6.1.2 Australia Propionic Acid and Derivatives Market Revenues & Volume, By Product, 2022 - 2032F |
6.1.3 Australia Propionic Acid and Derivatives Market Revenues & Volume, By Propionic AcidDerivatives, 2022 - 2032F |
6.2 Australia Propionic Acid and Derivatives Market, By Grade |
6.2.1 Overview and Analysis |
6.2.2 Australia Propionic Acid and Derivatives Market Revenues & Volume, By Industrial Grade/Technical Grade, 2022 - 2032F |
6.2.3 Australia Propionic Acid and Derivatives Market Revenues & Volume, By Food Grade, 2022 - 2032F |
6.2.4 Australia Propionic Acid and Derivatives Market Revenues & Volume, By Feed Grade, 2022 - 2032F |
6.2.5 Australia Propionic Acid and Derivatives Market Revenues & Volume, By Pharma Grade, 2022 - 2032F |
6.3 Australia Propionic Acid and Derivatives Market, By Form |
6.3.1 Overview and Analysis |
6.3.2 Australia Propionic Acid and Derivatives Market Revenues & Volume, By Dry, 2022 - 2032F |
6.3.3 Australia Propionic Acid and Derivatives Market Revenues & Volume, By Liquid, 2022 - 2032F |
6.4 Australia Propionic Acid and Derivatives Market, By Type |
6.4.1 Overview and Analysis |
6.4.2 Australia Propionic Acid and Derivatives Market Revenues & Volume, By Encapsulated, 2022 - 2032F |
6.4.3 Australia Propionic Acid and Derivatives Market Revenues & Volume, By Non-Encapsulated, 2022 - 2032F |
6.5 Australia Propionic Acid and Derivatives Market, By Source |
6.5.1 Overview and Analysis |
6.5.2 Australia Propionic Acid and Derivatives Market Revenues & Volume, By Natural, 2022 - 2032F |
6.5.3 Australia Propionic Acid and Derivatives Market Revenues & Volume, By Synthetic, 2022 - 2032F |
6.6 Australia Propionic Acid and Derivatives Market, By Application |
6.6.1 Overview and Analysis |
6.6.2 Australia Propionic Acid and Derivatives Market Revenues & Volume, By Food & Beverage, 2022 - 2032F |
6.6.3 Australia Propionic Acid and Derivatives Market Revenues & Volume, By Feed, 2022 - 2032F |
6.6.4 Australia Propionic Acid and Derivatives Market Revenues & Volume, By Pharmaceuticals, 2022 - 2032F |
6.6.5 Australia Propionic Acid and Derivatives Market Revenues & Volume, By Cosmetics, 2022 - 2032F |
6.6.6 Australia Propionic Acid and Derivatives Market Revenues & Volume, By Home & Personal Care, 2022 - 2032F |
6.6.7 Australia Propionic Acid and Derivatives Market Revenues & Volume, By Agriculture, 2022 - 2032F |
7 Australia Propionic Acid and Derivatives Market Import-Export Trade Statistics |
7.1 Australia Propionic Acid and Derivatives Market Export to Major Countries |
7.2 Australia Propionic Acid and Derivatives Market Imports from Major Countries |
8 Australia Propionic Acid and Derivatives Market Key Performance Indicators |
8.1 Research and development investment in innovative applications of propionic acid and its derivatives. |
8.2 Number of new product launches incorporating propionic acid and derivatives. |
8.3 Adoption rate of propionic acid in different end-user industries. |
9 Australia Propionic Acid and Derivatives Market - Opportunity Assessment |
9.1 Australia Propionic Acid and Derivatives Market Opportunity Assessment, By Product, 2022 & 2032F |
9.2 Australia Propionic Acid and Derivatives Market Opportunity Assessment, By Grade, 2022 & 2032F |
9.3 Australia Propionic Acid and Derivatives Market Opportunity Assessment, By Form, 2022 & 2032F |
9.4 Australia Propionic Acid and Derivatives Market Opportunity Assessment, By Type, 2022 & 2032F |
9.5 Australia Propionic Acid and Derivatives Market Opportunity Assessment, By Source, 2022 & 2032F |
9.6 Australia Propionic Acid and Derivatives Market Opportunity Assessment, By Application, 2022 & 2032F |
10 Australia Propionic Acid and Derivatives Market - Competitive Landscape |
10.1 Australia Propionic Acid and Derivatives Market Revenue Share, By Companies, 2025 |
10.2 Australia Propionic Acid and Derivatives Market Competitive Benchmarking, By Operating and Technical Parameters |
11 Company Profiles |
12 Recommendations |
13 Disclaimer |
Global Go To Market Strategy - 2030
Export potential enables firms to identify high-growth global markets with greater confidence by combining advanced trade intelligence with a structured quantitative methodology. The framework analyzes emerging demand trends and country-level import patterns while integrating macroeconomic and trade datasets such as GDP and population forecasts, bilateral import–export flows, tariff structures, elasticity differentials between developed and developing economies, geographic distance, and import demand projections. Using weighted trade values from 2020–2024 as the base period to project country-to-country export potential for 2030, these inputs are operationalized through calculated drivers such as gravity model parameters, tariff impact factors, and projected GDP per-capita growth. Through an analysis of hidden potentials, demand hotspots, and market conditions that are most favorable to success, this method enables firms to focus on target countries, maximize returns, and global expansion with data, backed by accuracy.
By factoring in the projected importer demand gap that is currently unmet and could be potential opportunity, it identifies the potential for the Exporter (Country) among 190 countries, against the general trade analysis, which identifies the biggest importer or exporter.
To discover high-growth global markets and optimize your business strategy:
Click Here
Pricing
- Single User License$ 1,995
- Department License$ 2,400
- Site License$ 3,120
- Global License$ 3,795

Leadership Perspectives from Industry Events
Search
Thought Leadership and Analyst Meet


Our Clients
6WResearch In News
- India Export Attractiveness Tracker 2026
- India Air Conditioner Market Set for Strong Rebound in 2026 After Weather-Led Correction and GST-Driven Recovery: 6Wresearch
- ADAS in India: How Automatic Emergency Braking, Blind Spot Detection & Driver Monitoring are Transforming Road Safety
- Doha a strategic location for EV manufacturing hub: IPA Qatar
- Demand for luxury TVs surging in the GCC, says Samsung
- Empowering Growth: The Thriving Journey of Bangladesh’s Cable Industry
Latest Reports
- Nicaragua RPG Gaming Market (2026-2032)
- New Zealand RPG Gaming Market (2026-2032)
- Netherlands RPG Gaming Market (2026-2032)
- Nauru RPG Gaming Market (2026-2032)
- Namibia RPG Gaming Market (2026-2032)
- Mozambique RPG Gaming Market (2026-2032)
- Montenegro RPG Gaming Market (2026-2032)
- Mongolia RPG Gaming Market (2026-2032)
- Monaco RPG Gaming Market (2026-2032)
- Micronesia RPG Gaming Market (2026-2032)
Industry Events and Analyst Meet

EV India Expo 2026

HIMTEX 2026

India Refining Summit 2026

India EV Show 2026

EV tech India Expo 2026
Whitepaper
- Middle East & Africa Commercial Security Market Click here to view more.
- Middle East & Africa Fire Safety Systems & Equipment Market Click here to view more.
- GCC Drone Market Click here to view more.
- Middle East Lighting Fixture Market Click here to view more.
- GCC Physical & Perimeter Security Market Click here to view more.