Australia Shading Meshes Market (2026-2032) | Segmentation, Share, Analysis, Growth, Trends, Value, Outlook, Forecast, Companies, Size & Revenue, Competitive Landscape, Industry
Market Forecast By Shade Type (75% Shade Nets, 50% Shade Nets, 90% Shade Nets), By Material (Polyethylene Thread, HDPE Plastic, Synthetic Fiber, PVC, Nylon, Others), By Application (Agriculture, Animal Husbandry, Greenhouses, Fencing, Others), By Distribution Channel (Convenience Stores, Specialty Stores, E-Commerce, Others) And Competitive Landscape
| Product Code: ETC6190851 | Publication Date: Sep 2024 | Updated Date: Mar 2026 | Product Type: Market Research Report | |
| Publisher: 6Wresearch | Author: Shubham Deep | No. of Pages: 75 | No. of Figures: 35 | No. of Tables: 20 |
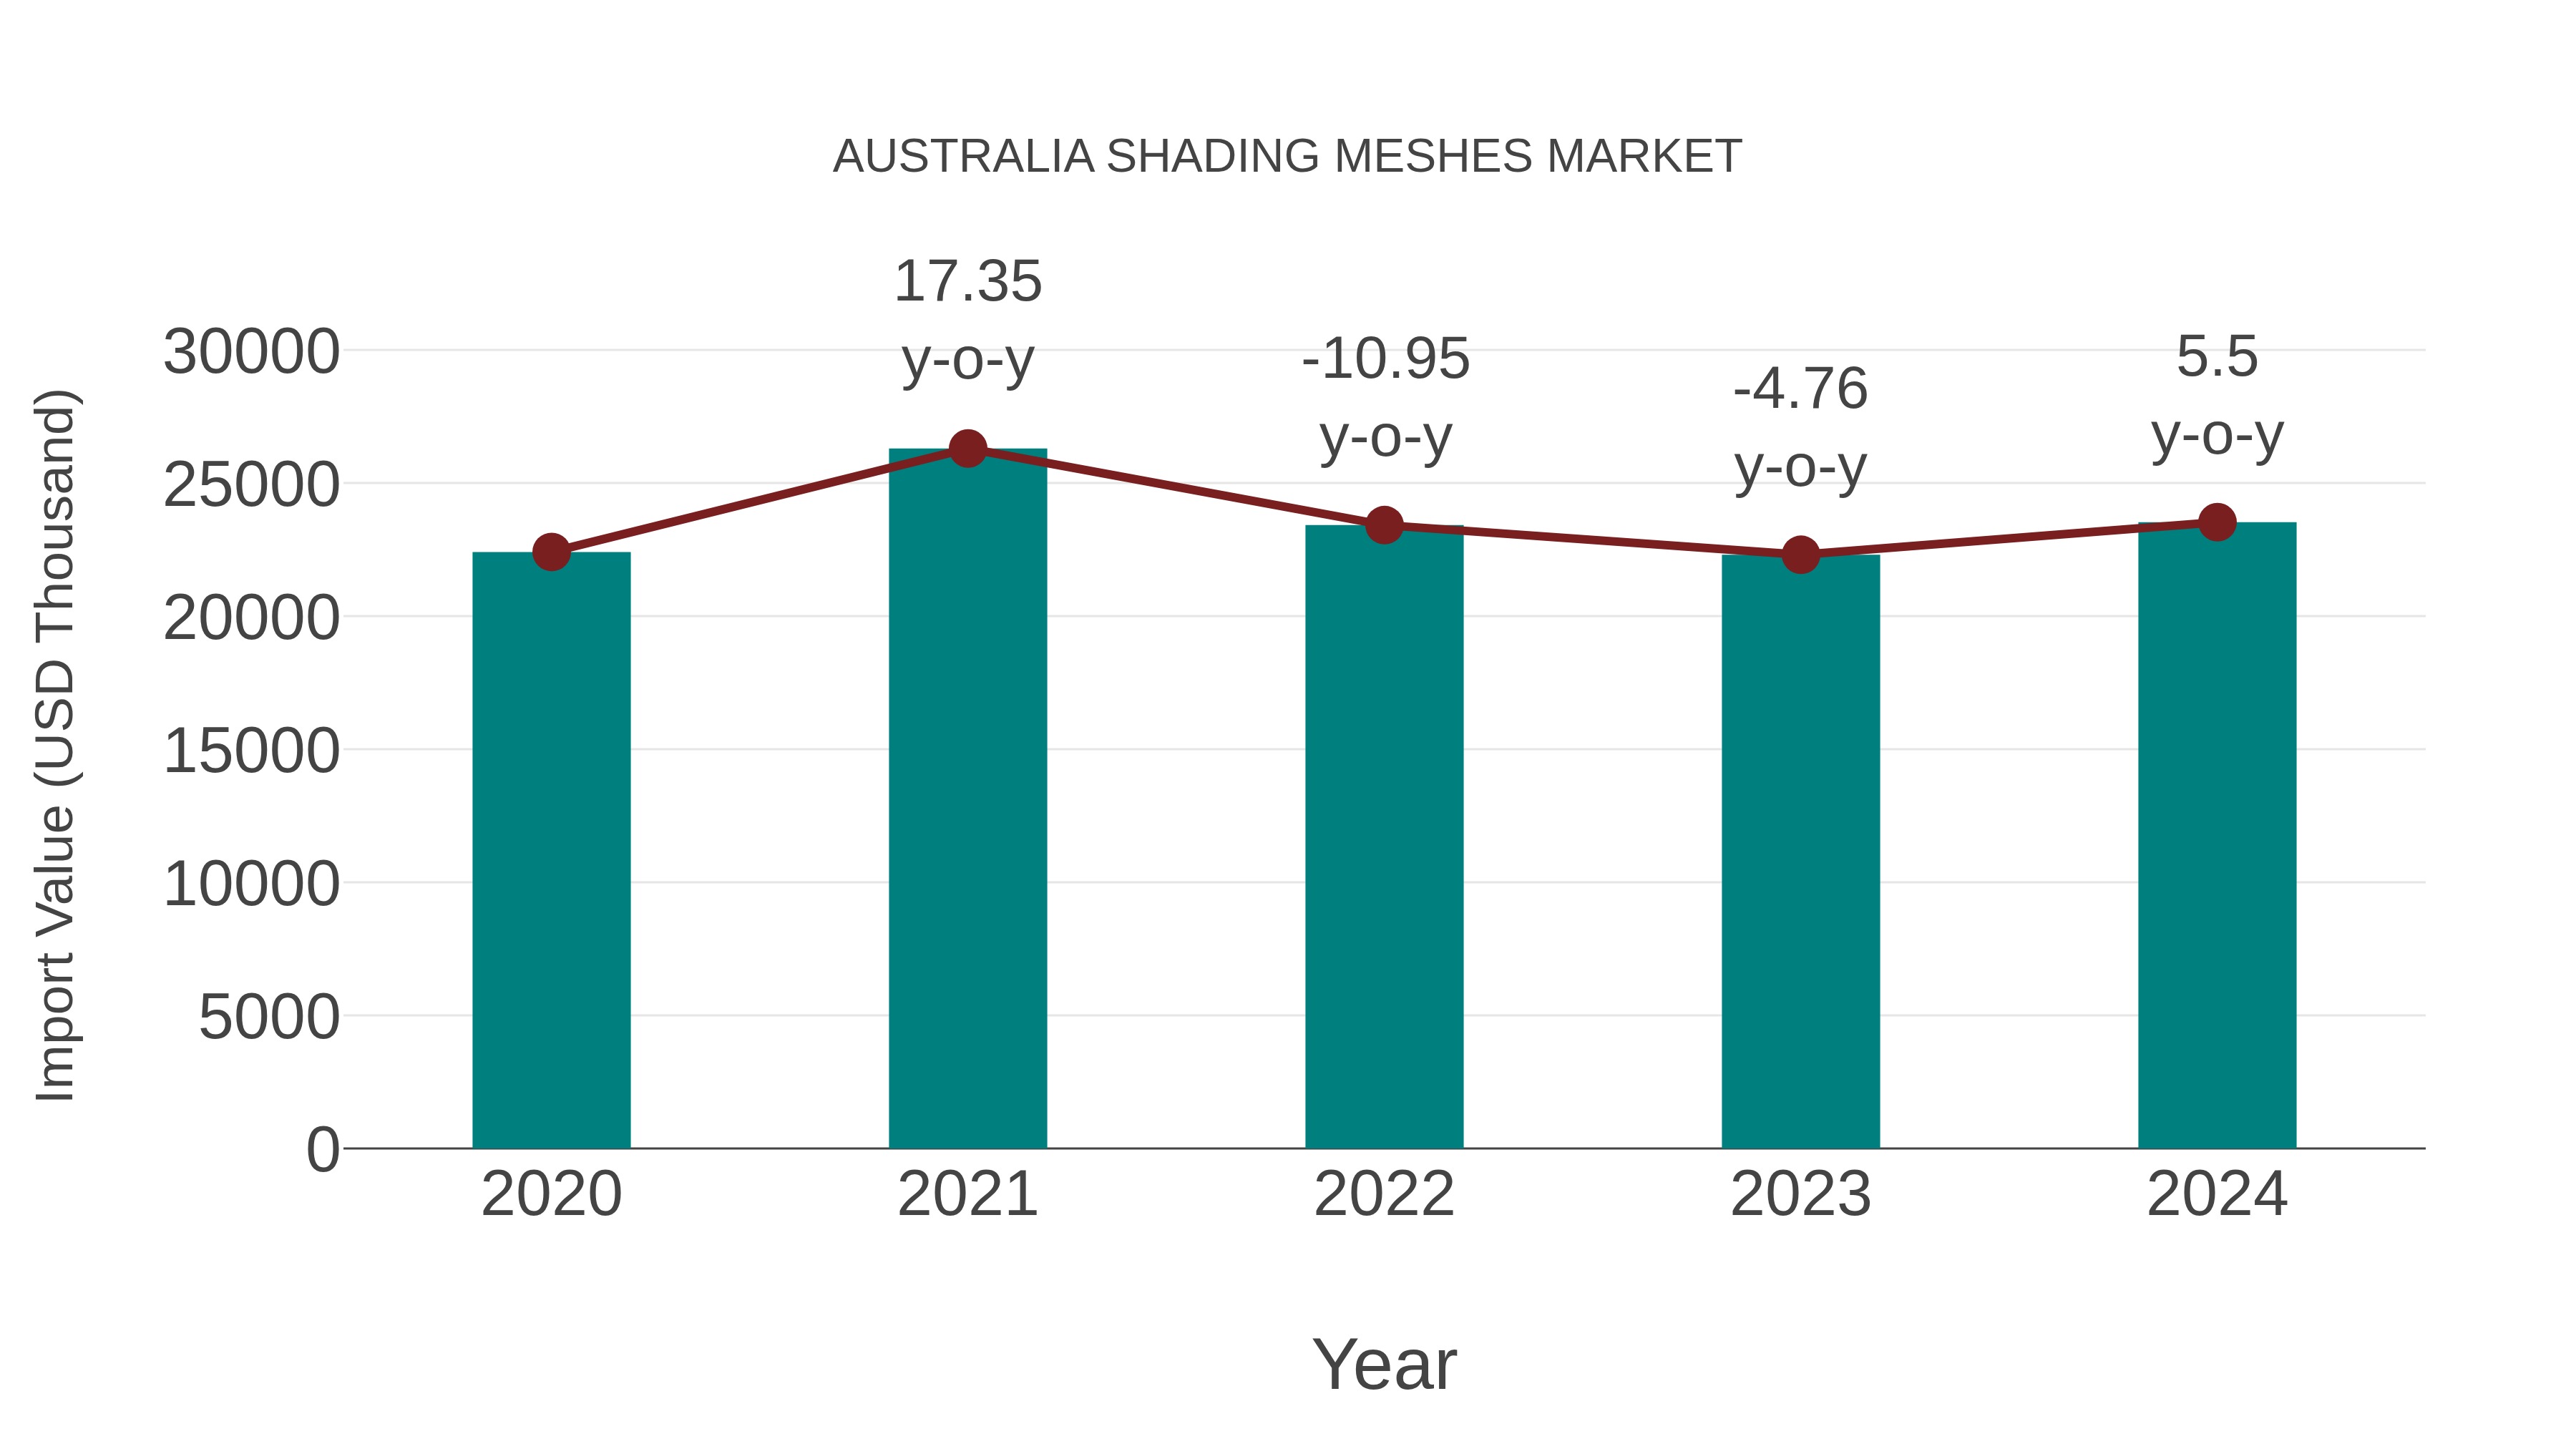
Australia Shading Meshes Market: Import Trend Analysis
Australia`s import trend for shading meshes in 2024 exhibited a growth rate of 5.5% compared to the previous year. The compound annual growth rate (CAGR) for the period 2020-2024 stood at 1.23%. This uptick in import momentum can be attributed to a steady demand shift towards innovative shading solutions in the market.
Australia Shading Meshes Market Overview
The shading meshes market in Australia is influenced by both residential and commercial demand for outdoor spaces. Shading meshes are commonly used in gardening, agriculture, and construction to provide UV protection, reduce heat, and protect crops or outdoor seating areas from sun damage. The increasing use of shading solutions to conserve energy in commercial and residential buildings, especially in the agricultural sector, fuels the market`s growth.
Trends of the market
The shading meshes market in Australia is witnessing notable growth, driven by increasing demand from agriculture and horticulture sectors for effective sun protection and climate control. With the rise of greenhouse farming and urban agriculture, shading meshes are being used extensively to improve crop yields by protecting plants from harsh sunlight and pests. Additionally, shading meshes are used in construction and residential sectors to enhance privacy and reduce solar heat gain, aligning with the broader trend toward sustainability and energy-efficient buildings.
Challenges of the market
The shading meshes market in Australia faces challenges related to fluctuating raw material prices and the environmental impact of synthetic mesh production. The demand for sustainable and recyclable shading solutions is growing, but transitioning to eco-friendly materials increases production costs. Additionally, intense competition from low-cost imports and variable construction industry activitylargely dependent on seasonal agricultural needs and climate conditionscontributes to market volatility.
Investment opportunities in the Market
Driven by urban gardening, agriculture, and infrastructure projects, demand for shading meshes is growing. Investors can target sectors like climate-resilient agriculture, energy-efficient building materials, and outdoor recreation facilities. Theres also potential in eco-friendly mesh manufacturing and distribution channels serving rural Australia.
Government Policy of the market
Government policies affecting shading meshes are mostly tied to building regulations and environmental sustainability guidelines. Programs promoting energy efficiency in buildings, such as the Nationwide House Energy Rating Scheme (NatHERS), indirectly boost demand. Import standards, construction safety codes, and local council planning regulations also shape this market.
Key Highlights of the Report:
- Australia Shading Meshes Market Outlook
- Market Size of Australia Shading Meshes Market, 2025
- Forecast of Australia Shading Meshes Market, 2032
- Historical Data and Forecast of Australia Shading Meshes Revenues & Volume for the Period 2022 - 2032F
- Australia Shading Meshes Market Trend Evolution
- Australia Shading Meshes Market Drivers and Challenges
- Australia Shading Meshes Price Trends
- Australia Shading Meshes Porter's Five Forces
- Australia Shading Meshes Industry Life Cycle
- Historical Data and Forecast of Australia Shading Meshes Market Revenues & Volume By Shade Type for the Period 2022 - 2032F
- Historical Data and Forecast of Australia Shading Meshes Market Revenues & Volume By 75% Shade Nets for the Period 2022 - 2032F
- Historical Data and Forecast of Australia Shading Meshes Market Revenues & Volume By 50% Shade Nets for the Period 2022 - 2032F
- Historical Data and Forecast of Australia Shading Meshes Market Revenues & Volume By 90% Shade Nets for the Period 2022 - 2032F
- Historical Data and Forecast of Australia Shading Meshes Market Revenues & Volume By Material for the Period 2022 - 2032F
- Historical Data and Forecast of Australia Shading Meshes Market Revenues & Volume By Polyethylene Thread for the Period 2022 - 2032F
- Historical Data and Forecast of Australia Shading Meshes Market Revenues & Volume By HDPE Plastic for the Period 2022 - 2032F
- Historical Data and Forecast of Australia Shading Meshes Market Revenues & Volume By Synthetic Fiber for the Period 2022 - 2032F
- Historical Data and Forecast of Australia Shading Meshes Market Revenues & Volume By PVC for the Period 2022 - 2032F
- Historical Data and Forecast of Australia Shading Meshes Market Revenues & Volume By Nylon for the Period 2022 - 2032F
- Historical Data and Forecast of Australia Shading Meshes Market Revenues & Volume By Others for the Period 2022 - 2032F
- Historical Data and Forecast of Australia Shading Meshes Market Revenues & Volume By Application for the Period 2022 - 2032F
- Historical Data and Forecast of Australia Shading Meshes Market Revenues & Volume By Agriculture for the Period 2022 - 2032F
- Historical Data and Forecast of Australia Shading Meshes Market Revenues & Volume By Animal Husbandry for the Period 2022 - 2032F
- Historical Data and Forecast of Australia Shading Meshes Market Revenues & Volume By Greenhouses for the Period 2022 - 2032F
- Historical Data and Forecast of Australia Shading Meshes Market Revenues & Volume By Fencing for the Period 2022 - 2032F
- Historical Data and Forecast of Australia Shading Meshes Market Revenues & Volume By Others for the Period 2022 - 2032F
- Historical Data and Forecast of Australia Shading Meshes Market Revenues & Volume By Distribution Channel for the Period 2022 - 2032F
- Historical Data and Forecast of Australia Shading Meshes Market Revenues & Volume By Convenience Stores for the Period 2022 - 2032F
- Historical Data and Forecast of Australia Shading Meshes Market Revenues & Volume By Specialty Stores for the Period 2022 - 2032F
- Historical Data and Forecast of Australia Shading Meshes Market Revenues & Volume By E-Commerce for the Period 2022 - 2032F
- Historical Data and Forecast of Australia Shading Meshes Market Revenues & Volume By Others for the Period 2022 - 2032F
- Australia Shading Meshes Import Export Trade Statistics
- Market Opportunity Assessment By Shade Type
- Market Opportunity Assessment By Material
- Market Opportunity Assessment By Application
- Market Opportunity Assessment By Distribution Channel
- Australia Shading Meshes Top Companies Market Share
- Australia Shading Meshes Competitive Benchmarking By Technical and Operational Parameters
- Australia Shading Meshes Company Profiles
- Australia Shading Meshes Key Strategic Recommendations
Australia Shading Meshes Market (2026-2032): FAQs
6Wresearch actively monitors the Australia Shading Meshes Market and publishes its comprehensive annual report, highlighting emerging trends, growth drivers, revenue analysis, and forecast outlook. Our insights help businesses to make data-backed strategic decisions with ongoing market dynamics. Our analysts track relevent industries related to the Australia Shading Meshes Market, allowing our clients with actionable intelligence and reliable forecasts tailored to emerging regional needs.
Yes, we provide customisation as per your requirements. To learn more, feel free to contact us on sales@6wresearch.com
1 Executive Summary |
2 Introduction |
2.1 Key Highlights of the Report |
2.2 Report Description |
2.3 Market Scope & Segmentation |
2.4 Research Methodology |
2.5 Assumptions |
3 Australia Shading Meshes Market Overview |
3.1 Australia Country Macro Economic Indicators |
3.2 Australia Shading Meshes Market Revenues & Volume, 2022 & 2032F |
3.3 Australia Shading Meshes Market - Industry Life Cycle |
3.4 Australia Shading Meshes Market - Porter's Five Forces |
3.5 Australia Shading Meshes Market Revenues & Volume Share, By Shade Type, 2022 & 2032F |
3.6 Australia Shading Meshes Market Revenues & Volume Share, By Material, 2022 & 2032F |
3.7 Australia Shading Meshes Market Revenues & Volume Share, By Application, 2022 & 2032F |
3.8 Australia Shading Meshes Market Revenues & Volume Share, By Distribution Channel, 2022 & 2032F |
4 Australia Shading Meshes Market Dynamics |
4.1 Impact Analysis |
4.2 Market Drivers |
4.2.1 Increasing awareness about the benefits of shading meshes in Australia |
4.2.2 Growing demand for energy-efficient and sustainable solutions |
4.2.3 Favorable government regulations promoting the use of shading meshes |
4.3 Market Restraints |
4.3.1 High initial costs associated with shading meshes installation |
4.3.2 Limited availability of skilled labor for installation and maintenance |
4.3.3 Seasonal variations impacting the demand for shading meshes |
5 Australia Shading Meshes Market Trends |
6 Australia Shading Meshes Market, By Types |
6.1 Australia Shading Meshes Market, By Shade Type |
6.1.1 Overview and Analysis |
6.1.2 Australia Shading Meshes Market Revenues & Volume, By Shade Type, 2022 - 2032F |
6.1.3 Australia Shading Meshes Market Revenues & Volume, By 75% Shade Nets, 2022 - 2032F |
6.1.4 Australia Shading Meshes Market Revenues & Volume, By 50% Shade Nets, 2022 - 2032F |
6.1.5 Australia Shading Meshes Market Revenues & Volume, By 90% Shade Nets, 2022 - 2032F |
6.2 Australia Shading Meshes Market, By Material |
6.2.1 Overview and Analysis |
6.2.2 Australia Shading Meshes Market Revenues & Volume, By Polyethylene Thread, 2022 - 2032F |
6.2.3 Australia Shading Meshes Market Revenues & Volume, By HDPE Plastic, 2022 - 2032F |
6.2.4 Australia Shading Meshes Market Revenues & Volume, By Synthetic Fiber, 2022 - 2032F |
6.2.5 Australia Shading Meshes Market Revenues & Volume, By PVC, 2022 - 2032F |
6.2.6 Australia Shading Meshes Market Revenues & Volume, By Nylon, 2022 - 2032F |
6.2.7 Australia Shading Meshes Market Revenues & Volume, By Others, 2022 - 2032F |
6.3 Australia Shading Meshes Market, By Application |
6.3.1 Overview and Analysis |
6.3.2 Australia Shading Meshes Market Revenues & Volume, By Agriculture, 2022 - 2032F |
6.3.3 Australia Shading Meshes Market Revenues & Volume, By Animal Husbandry, 2022 - 2032F |
6.3.4 Australia Shading Meshes Market Revenues & Volume, By Greenhouses, 2022 - 2032F |
6.3.5 Australia Shading Meshes Market Revenues & Volume, By Fencing, 2022 - 2032F |
6.3.6 Australia Shading Meshes Market Revenues & Volume, By Others, 2022 - 2032F |
6.4 Australia Shading Meshes Market, By Distribution Channel |
6.4.1 Overview and Analysis |
6.4.2 Australia Shading Meshes Market Revenues & Volume, By Convenience Stores, 2022 - 2032F |
6.4.3 Australia Shading Meshes Market Revenues & Volume, By Specialty Stores, 2022 - 2032F |
6.4.4 Australia Shading Meshes Market Revenues & Volume, By E-Commerce, 2022 - 2032F |
6.4.5 Australia Shading Meshes Market Revenues & Volume, By Others, 2022 - 2032F |
7 Australia Shading Meshes Market Import-Export Trade Statistics |
7.1 Australia Shading Meshes Market Export to Major Countries |
7.2 Australia Shading Meshes Market Imports from Major Countries |
8 Australia Shading Meshes Market Key Performance Indicators |
8.1 Number of new residential and commercial constructions adopting shading meshes |
8.2 Average energy savings achieved by using shading meshes |
8.3 Percentage increase in the adoption of shading meshes in different industries |
8.4 Number of research and development initiatives focused on improving shading mesh technology |
9 Australia Shading Meshes Market - Opportunity Assessment |
9.1 Australia Shading Meshes Market Opportunity Assessment, By Shade Type, 2022 & 2032F |
9.2 Australia Shading Meshes Market Opportunity Assessment, By Material, 2022 & 2032F |
9.3 Australia Shading Meshes Market Opportunity Assessment, By Application, 2022 & 2032F |
9.4 Australia Shading Meshes Market Opportunity Assessment, By Distribution Channel, 2022 & 2032F |
10 Australia Shading Meshes Market - Competitive Landscape |
10.1 Australia Shading Meshes Market Revenue Share, By Companies, 2025 |
10.2 Australia Shading Meshes Market Competitive Benchmarking, By Operating and Technical Parameters |
11 Company Profiles |
12 Recommendations |
13 Disclaimer |
Global Go To Market Strategy - 2030
Export potential enables firms to identify high-growth global markets with greater confidence by combining advanced trade intelligence with a structured quantitative methodology. The framework analyzes emerging demand trends and country-level import patterns while integrating macroeconomic and trade datasets such as GDP and population forecasts, bilateral import–export flows, tariff structures, elasticity differentials between developed and developing economies, geographic distance, and import demand projections. Using weighted trade values from 2020–2024 as the base period to project country-to-country export potential for 2030, these inputs are operationalized through calculated drivers such as gravity model parameters, tariff impact factors, and projected GDP per-capita growth. Through an analysis of hidden potentials, demand hotspots, and market conditions that are most favorable to success, this method enables firms to focus on target countries, maximize returns, and global expansion with data, backed by accuracy.
By factoring in the projected importer demand gap that is currently unmet and could be potential opportunity, it identifies the potential for the Exporter (Country) among 190 countries, against the general trade analysis, which identifies the biggest importer or exporter.
To discover high-growth global markets and optimize your business strategy:
Click Here
Pricing
- Single User License$ 1,995
- Department License$ 2,400
- Site License$ 3,120
- Global License$ 3,795

Leadership Perspectives from Industry Events
Search
Thought Leadership and Analyst Meet


Our Clients
6WResearch In News
- India Export Attractiveness Tracker 2026
- India Air Conditioner Market Set for Strong Rebound in 2026 After Weather-Led Correction and GST-Driven Recovery: 6Wresearch
- ADAS in India: How Automatic Emergency Braking, Blind Spot Detection & Driver Monitoring are Transforming Road Safety
- Doha a strategic location for EV manufacturing hub: IPA Qatar
- Demand for luxury TVs surging in the GCC, says Samsung
- Empowering Growth: The Thriving Journey of Bangladesh’s Cable Industry
Latest Reports
- Nicaragua RPG Gaming Market (2026-2032)
- New Zealand RPG Gaming Market (2026-2032)
- Netherlands RPG Gaming Market (2026-2032)
- Nauru RPG Gaming Market (2026-2032)
- Namibia RPG Gaming Market (2026-2032)
- Mozambique RPG Gaming Market (2026-2032)
- Montenegro RPG Gaming Market (2026-2032)
- Mongolia RPG Gaming Market (2026-2032)
- Monaco RPG Gaming Market (2026-2032)
- Micronesia RPG Gaming Market (2026-2032)
Industry Events and Analyst Meet

EV India Expo 2026

HIMTEX 2026

India Refining Summit 2026

India EV Show 2026

EV tech India Expo 2026
Whitepaper
- Middle East & Africa Commercial Security Market Click here to view more.
- Middle East & Africa Fire Safety Systems & Equipment Market Click here to view more.
- GCC Drone Market Click here to view more.
- Middle East Lighting Fixture Market Click here to view more.
- GCC Physical & Perimeter Security Market Click here to view more.