Australia Stand-Up Paddleboard Market (2026-2032) | Share, Size & Revenue, Companies, Growth, Outlook, Trends, Competitive Landscape, Analysis, Forecast, Value, Segmentation, Industry
Market Forecast By Product (Solid SUP Boards, Inflatable SUP Boards), By Weight (56kg-68kg, 68kg-79kg, 79kg-91kg, 91kg-102kg, 22kg-56kg, 102kg-113kg, 113kg-125kg, above 125kg), By Length (9.1-12.0 feet, <9 feet, >12 feet), By Price (Medium, Low, Premium), By Material (PVC, EPOXY, Fiber Glass), By Distribution Channel (Online, Third Party Online, Franchised Sport Outlet, Retail Sports Outlet, Modern Trade Channel, Specialty Store, Independent Sports Outlets) And Competitive Landscape
| Product Code: ETC6191857 | Publication Date: Sep 2024 | Updated Date: Mar 2026 | Product Type: Market Research Report | |
| Publisher: 6Wresearch | Author: Ravi Bhandari | No. of Pages: 75 | No. of Figures: 35 | No. of Tables: 20 |
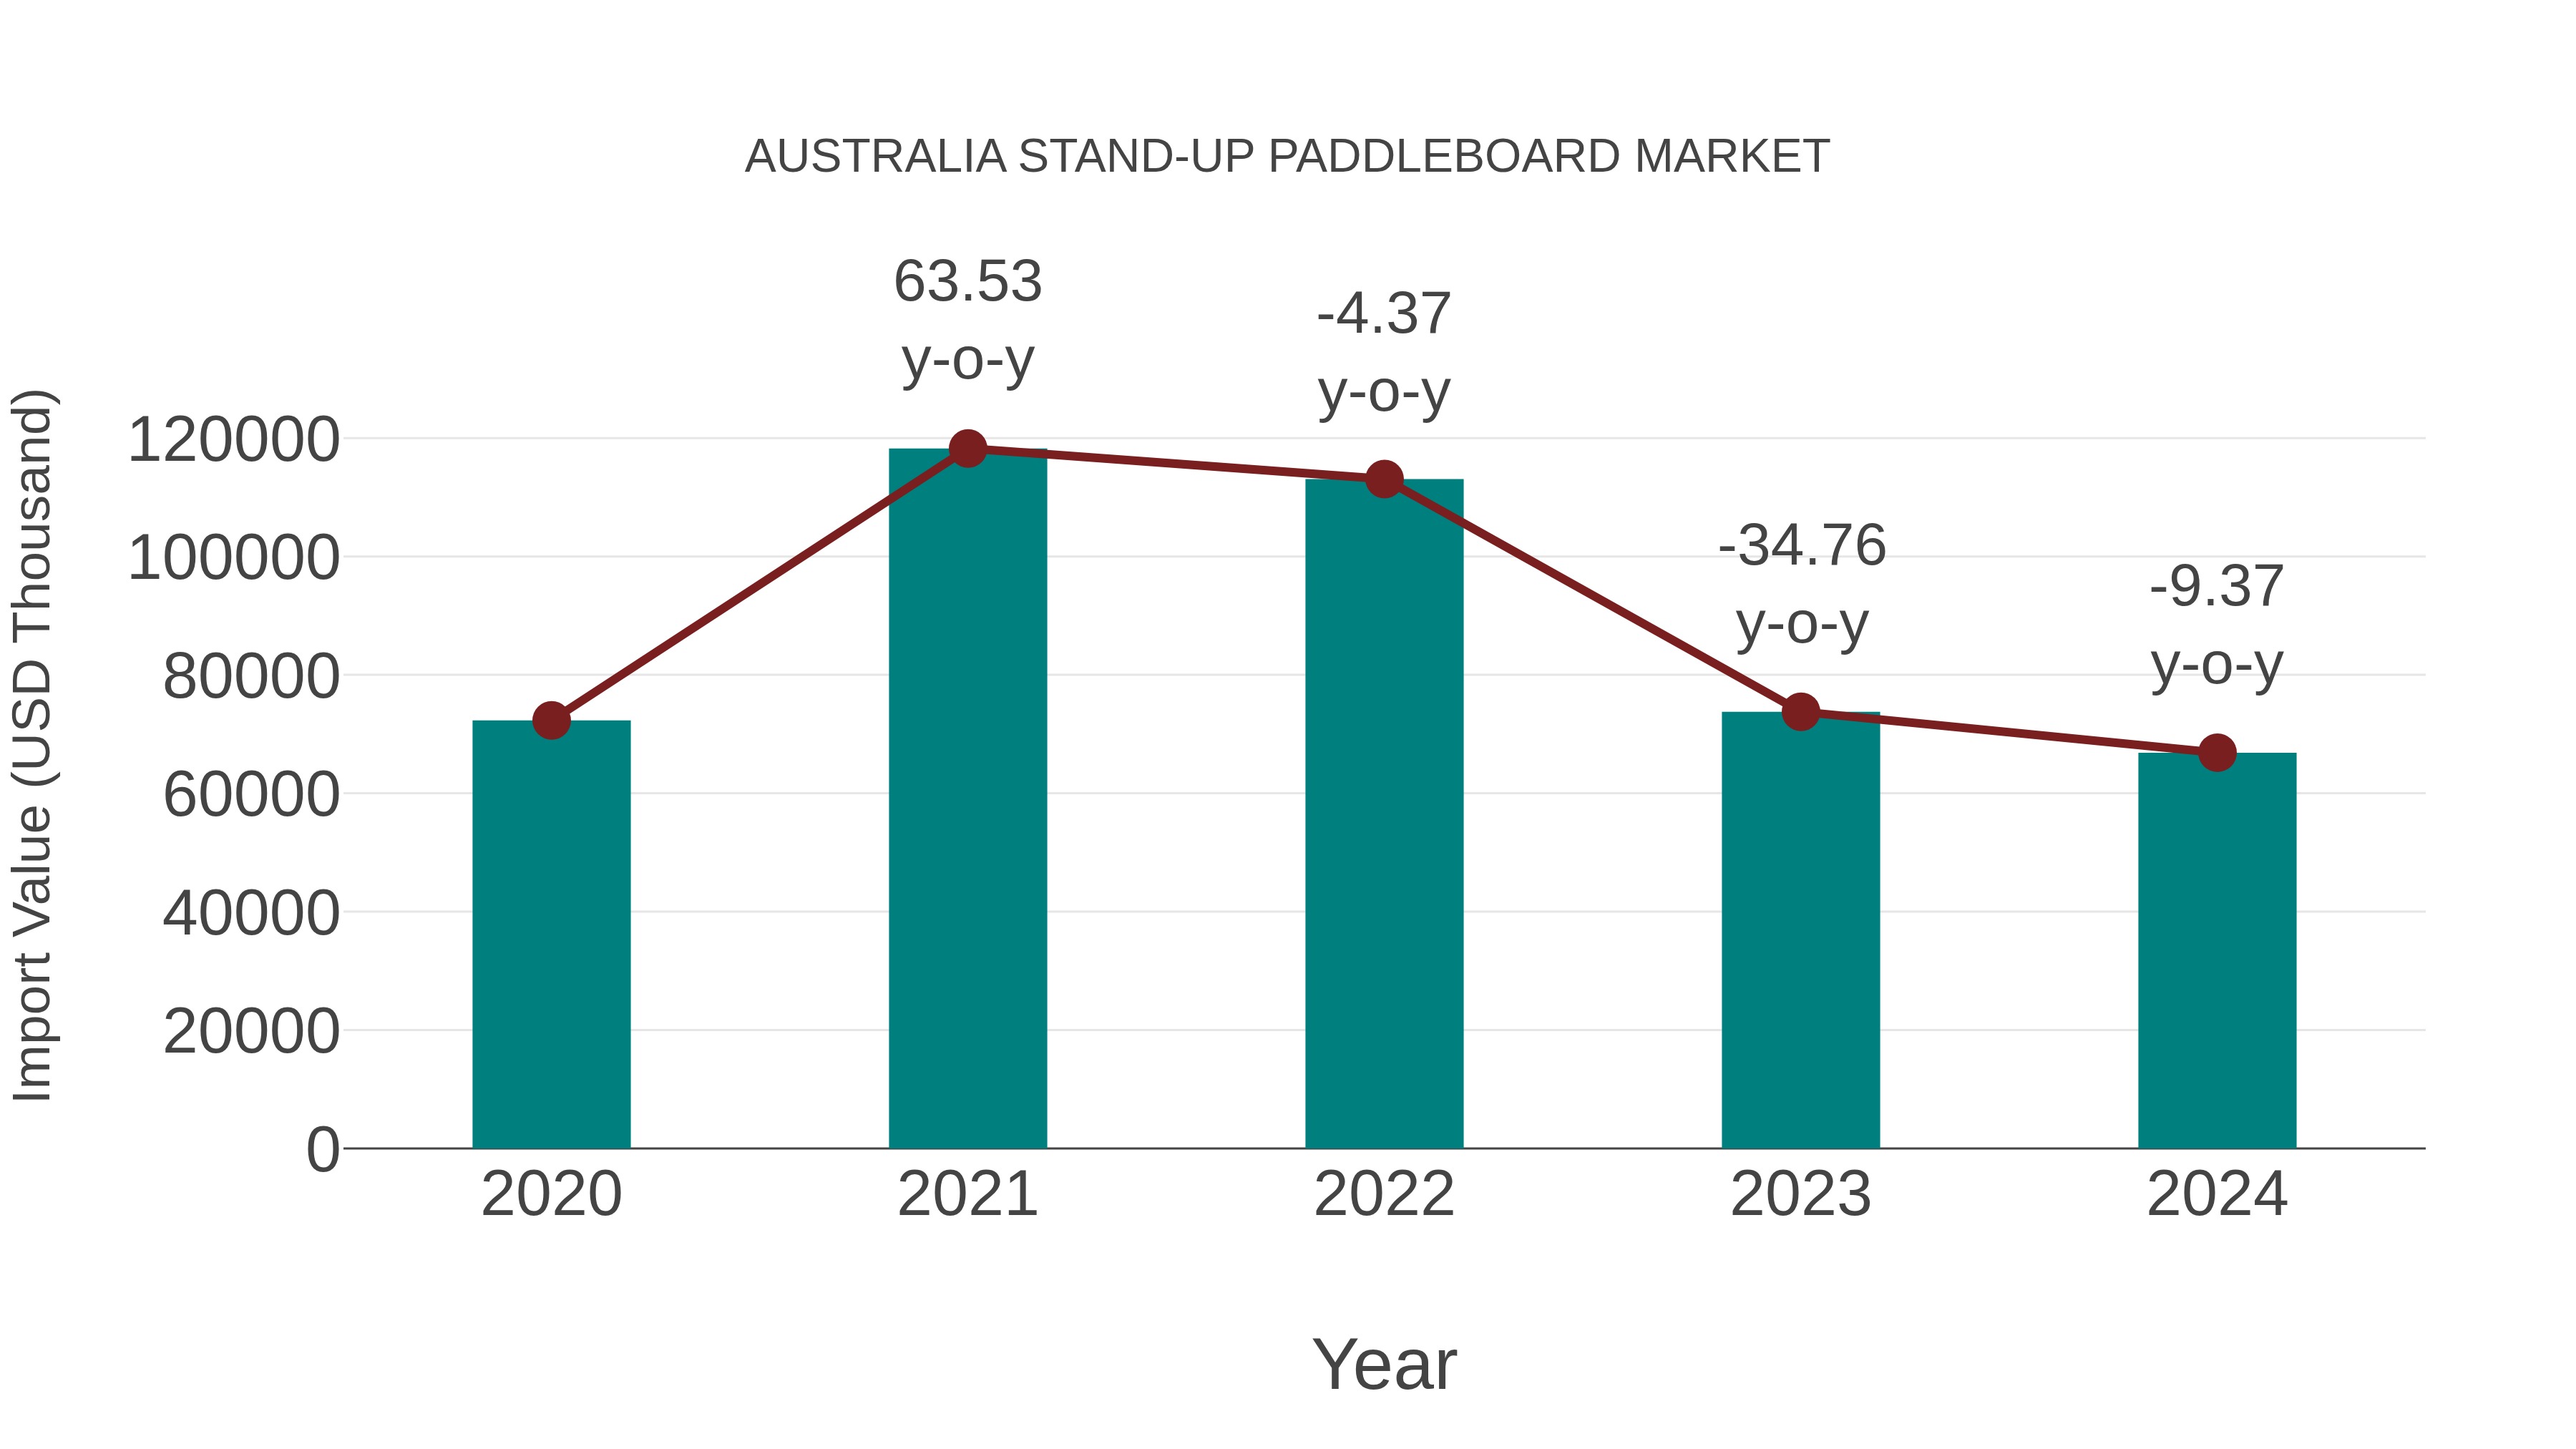
Australia Stand-up Paddleboard Market: Import Trend Analysis
Australia`s import trend for the stand-up paddleboard market experienced a decline with a growth rate of -9.37% from 2023 to 2024, resulting in a compound annual growth rate (CAGR) of -1.94% for the period of 2020-2024. This negative momentum could be attributed to shifts in consumer preferences towards other water sports equipment or changes in trade policies impacting import volumes.
Australia Stand Up Paddleboard Market Overview
Australias stand up paddleboard market is buoyed by the country`s strong beach culture and growing interest in water sports. Recreational and fitness trends have significantly influenced consumer adoption. Technological advancements in materials such as inflatable and lightweight boards have widened accessibility. Tourism activities and eco-friendly water sports are also contributing to market expansion.
Drivers of the market
The stand up paddleboard (SUP) market in Australia is expanding rapidly as outdoor recreational activities gain popularity post-pandemic. Increased health awareness and interest in water sports have led to a surge in demand for SUPs. Innovations in lightweight and durable materials, including carbon fiber and epoxy composites, are improving product performance. The market is also witnessing growth in rentals and SUP-related tourism, supported by government initiatives to promote active lifestyles.
Challenges of the market
In the Australia Stand Up Paddleboard Market, seasonality and weather conditions limit sales and usage to warmer months, causing revenue fluctuations. The market is also challenged by the high costs of manufacturing durable and lightweight paddleboards using advanced materials like carbon fiber or epoxy resin. Consumer preferences are evolving rapidly, requiring frequent innovation and diversification of product lines. Furthermore, competition from imported products, often at lower price points, pressures local manufacturers and retailers.
Investment opportunities in the Market
Australia`s coastal geography and growing interest in water sports make the stand up paddleboard market a lucrative investment avenue. Opportunities exist in premium boards, eco-friendly materials, and tourism-related rentals. Collaborations with surf shops, resorts, and adventure sports platforms can boost brand visibility. Additionally, tapping into e-commerce channels can help reach niche consumer groups nationwide.
Government Policy of the market
In Australia, water sports are closely regulated by state maritime safety authorities. The government enforces safety standards, mandatory life jackets, and equipment guidelines that impact the stand-up paddleboard market. Additionally, tourism-related funding and initiatives supporting recreational outdoor activities have indirectly supported the growth of this market. However, environmental regulations also govern the use of paddleboards in sensitive marine areas.
Key Highlights of the Report:
- Australia Stand-Up Paddleboard Market Outlook
- Market Size of Australia Stand-Up Paddleboard Market, 2025
- Forecast of Australia Stand-Up Paddleboard Market, 2032
- Historical Data and Forecast of Australia Stand-Up Paddleboard Revenues & Volume for the Period 2022 - 2032F
- Australia Stand-Up Paddleboard Market Trend Evolution
- Australia Stand-Up Paddleboard Market Drivers and Challenges
- Australia Stand-Up Paddleboard Price Trends
- Australia Stand-Up Paddleboard Porter's Five Forces
- Australia Stand-Up Paddleboard Industry Life Cycle
- Historical Data and Forecast of Australia Stand-Up Paddleboard Market Revenues & Volume By Product for the Period 2022 - 2032F
- Historical Data and Forecast of Australia Stand-Up Paddleboard Market Revenues & Volume By Solid SUP Boards for the Period 2022 - 2032F
- Historical Data and Forecast of Australia Stand-Up Paddleboard Market Revenues & Volume By Inflatable SUP Boards for the Period 2022 - 2032F
- Historical Data and Forecast of Australia Stand-Up Paddleboard Market Revenues & Volume By Weight for the Period 2022 - 2032F
- Historical Data and Forecast of Australia Stand-Up Paddleboard Market Revenues & Volume By 56kg-68kg for the Period 2022 - 2032F
- Historical Data and Forecast of Australia Stand-Up Paddleboard Market Revenues & Volume By 68kg-79kg for the Period 2022 - 2032F
- Historical Data and Forecast of Australia Stand-Up Paddleboard Market Revenues & Volume By 79kg-91kg for the Period 2022 - 2032F
- Historical Data and Forecast of Australia Stand-Up Paddleboard Market Revenues & Volume By 91kg-102kg for the Period 2022 - 2032F
- Historical Data and Forecast of Australia Stand-Up Paddleboard Market Revenues & Volume By 22kg-56kg for the Period 2022 - 2032F
- Historical Data and Forecast of Australia Stand-Up Paddleboard Market Revenues & Volume By 102kg-113kg for the Period 2022 - 2032F
- Historical Data and Forecast of Australia Stand-Up Paddleboard Market Revenues & Volume By 113kg-125kg for the Period 2022 - 2032F
- Historical Data and Forecast of Australia Stand-Up Paddleboard Market Revenues & Volume By above 125kg for the Period 2022 - 2032F
- Historical Data and Forecast of Australia Stand-Up Paddleboard Market Revenues & Volume By Length for the Period 2022 - 2032F
- Historical Data and Forecast of Australia Stand-Up Paddleboard Market Revenues & Volume By 9.1-12.0 feet, for the Period 2022 - 2032F
- Historical Data and Forecast of Australia Stand-Up Paddleboard Market Revenues & Volume By <9 feet for the Period 2022 - 2032F
- Historical Data and Forecast of Australia Stand-Up Paddleboard Market Revenues & Volume By >12 feet for the Period 2022 - 2032F
- Historical Data and Forecast of Australia Stand-Up Paddleboard Market Revenues & Volume By Price for the Period 2022 - 2032F
- Historical Data and Forecast of Australia Stand-Up Paddleboard Market Revenues & Volume By Medium for the Period 2022 - 2032F
- Historical Data and Forecast of Australia Stand-Up Paddleboard Market Revenues & Volume By Low for the Period 2022 - 2032F
- Historical Data and Forecast of Australia Stand-Up Paddleboard Market Revenues & Volume By Premium for the Period 2022 - 2032F
- Historical Data and Forecast of Australia Stand-Up Paddleboard Market Revenues & Volume By Material for the Period 2022 - 2032F
- Historical Data and Forecast of Australia Stand-Up Paddleboard Market Revenues & Volume By PVC for the Period 2022 - 2032F
- Historical Data and Forecast of Australia Stand-Up Paddleboard Market Revenues & Volume By EPOXY for the Period 2022 - 2032F
- Historical Data and Forecast of Australia Stand-Up Paddleboard Market Revenues & Volume By Fiber Glass for the Period 2022 - 2032F
- Historical Data and Forecast of Australia Stand-Up Paddleboard Market Revenues & Volume By Distribution Channel for the Period 2022 - 2032F
- Historical Data and Forecast of Australia Stand-Up Paddleboard Market Revenues & Volume By Online for the Period 2022 - 2032F
- Historical Data and Forecast of Australia Stand-Up Paddleboard Market Revenues & Volume By Third Party Online for the Period 2022 - 2032F
- Historical Data and Forecast of Australia Stand-Up Paddleboard Market Revenues & Volume By Franchised Sport Outlet for the Period 2022 - 2032F
- Historical Data and Forecast of Australia Stand-Up Paddleboard Market Revenues & Volume By Retail Sports Outlet for the Period 2022 - 2032F
- Historical Data and Forecast of Australia Stand-Up Paddleboard Market Revenues & Volume By Modern Trade Channel for the Period 2022 - 2032F
- Historical Data and Forecast of Australia Stand-Up Paddleboard Market Revenues & Volume By Specialty Store for the Period 2022 - 2032F
- Historical Data and Forecast of Australia Stand-Up Paddleboard Market Revenues & Volume By Independent Sports Outlets for the Period 2022 - 2032F
- Australia Stand-Up Paddleboard Import Export Trade Statistics
- Market Opportunity Assessment By Product
- Market Opportunity Assessment By Weight
- Market Opportunity Assessment By Length
- Market Opportunity Assessment By Price
- Market Opportunity Assessment By Material
- Market Opportunity Assessment By Distribution Channel
- Australia Stand-Up Paddleboard Top Companies Market Share
- Australia Stand-Up Paddleboard Competitive Benchmarking By Technical and Operational Parameters
- Australia Stand-Up Paddleboard Company Profiles
- Australia Stand-Up Paddleboard Key Strategic Recommendations
Australia Stand-Up Paddleboard Market (2026-2032): FAQs
6Wresearch actively monitors the Australia Stand-Up Paddleboard Market and publishes its comprehensive annual report, highlighting emerging trends, growth drivers, revenue analysis, and forecast outlook. Our insights help businesses to make data-backed strategic decisions with ongoing market dynamics. Our analysts track relevent industries related to the Australia Stand-Up Paddleboard Market, allowing our clients with actionable intelligence and reliable forecasts tailored to emerging regional needs.
Yes, we provide customisation as per your requirements. To learn more, feel free to contact us on sales@6wresearch.com
1 Executive Summary |
2 Introduction |
2.1 Key Highlights of the Report |
2.2 Report Description |
2.3 Market Scope & Segmentation |
2.4 Research Methodology |
2.5 Assumptions |
3 Australia Stand-Up Paddleboard Market Overview |
3.1 Australia Country Macro Economic Indicators |
3.2 Australia Stand-Up Paddleboard Market Revenues & Volume, 2022 & 2032F |
3.3 Australia Stand-Up Paddleboard Market - Industry Life Cycle |
3.4 Australia Stand-Up Paddleboard Market - Porter's Five Forces |
3.5 Australia Stand-Up Paddleboard Market Revenues & Volume Share, By Product, 2022 & 2032F |
3.6 Australia Stand-Up Paddleboard Market Revenues & Volume Share, By Weight, 2022 & 2032F |
3.7 Australia Stand-Up Paddleboard Market Revenues & Volume Share, By Length, 2022 & 2032F |
3.8 Australia Stand-Up Paddleboard Market Revenues & Volume Share, By Price, 2022 & 2032F |
3.9 Australia Stand-Up Paddleboard Market Revenues & Volume Share, By Material, 2022 & 2032F |
3.10 Australia Stand-Up Paddleboard Market Revenues & Volume Share, By Distribution Channel, 2022 & 2032F |
4 Australia Stand-Up Paddleboard Market Dynamics |
4.1 Impact Analysis |
4.2 Market Drivers |
4.2.1 Increasing interest in outdoor activities and water sports among Australians |
4.2.2 Growing awareness about health and fitness benefits of stand-up paddleboarding |
4.2.3 Rise in tourism activities promoting water sports in Australia |
4.3 Market Restraints |
4.3.1 Seasonal demand fluctuations due to weather conditions |
4.3.2 High initial cost associated with stand-up paddleboarding equipment |
4.3.3 Limited accessibility to water bodies suitable for paddleboarding in certain regions |
5 Australia Stand-Up Paddleboard Market Trends |
6 Australia Stand-Up Paddleboard Market, By Types |
6.1 Australia Stand-Up Paddleboard Market, By Product |
6.1.1 Overview and Analysis |
6.1.2 Australia Stand-Up Paddleboard Market Revenues & Volume, By Product, 2022 - 2032F |
6.1.3 Australia Stand-Up Paddleboard Market Revenues & Volume, By Solid SUP Boards, 2022 - 2032F |
6.1.4 Australia Stand-Up Paddleboard Market Revenues & Volume, By Inflatable SUP Boards, 2022 - 2032F |
6.2 Australia Stand-Up Paddleboard Market, By Weight |
6.2.1 Overview and Analysis |
6.2.2 Australia Stand-Up Paddleboard Market Revenues & Volume, By 56kg-68kg, 2022 - 2032F |
6.2.3 Australia Stand-Up Paddleboard Market Revenues & Volume, By 68kg-79kg, 2022 - 2032F |
6.2.4 Australia Stand-Up Paddleboard Market Revenues & Volume, By 79kg-91kg, 2022 - 2032F |
6.2.5 Australia Stand-Up Paddleboard Market Revenues & Volume, By 91kg-102kg, 2022 - 2032F |
6.2.6 Australia Stand-Up Paddleboard Market Revenues & Volume, By 22kg-56kg, 2022 - 2032F |
6.2.7 Australia Stand-Up Paddleboard Market Revenues & Volume, By 102kg-113kg, 2022 - 2032F |
6.2.8 Australia Stand-Up Paddleboard Market Revenues & Volume, By above 125kg, 2022 - 2032F |
6.2.9 Australia Stand-Up Paddleboard Market Revenues & Volume, By above 125kg, 2022 - 2032F |
6.3 Australia Stand-Up Paddleboard Market, By Length |
6.3.1 Overview and Analysis |
6.3.2 Australia Stand-Up Paddleboard Market Revenues & Volume, By 9.1-12.0 feet,, 2022 - 2032F |
6.3.3 Australia Stand-Up Paddleboard Market Revenues & Volume, By <9 feet, 2022 - 2032F |
6.3.4 Australia Stand-Up Paddleboard Market Revenues & Volume, By >12 feet, 2022 - 2032F |
6.4 Australia Stand-Up Paddleboard Market, By Price |
6.4.1 Overview and Analysis |
6.4.2 Australia Stand-Up Paddleboard Market Revenues & Volume, By Medium, 2022 - 2032F |
6.4.3 Australia Stand-Up Paddleboard Market Revenues & Volume, By Low, 2022 - 2032F |
6.4.4 Australia Stand-Up Paddleboard Market Revenues & Volume, By Premium, 2022 - 2032F |
6.5 Australia Stand-Up Paddleboard Market, By Material |
6.5.1 Overview and Analysis |
6.5.2 Australia Stand-Up Paddleboard Market Revenues & Volume, By PVC, 2022 - 2032F |
6.5.3 Australia Stand-Up Paddleboard Market Revenues & Volume, By EPOXY, 2022 - 2032F |
6.5.4 Australia Stand-Up Paddleboard Market Revenues & Volume, By Fiber Glass, 2022 - 2032F |
6.6 Australia Stand-Up Paddleboard Market, By Distribution Channel |
6.6.1 Overview and Analysis |
6.6.2 Australia Stand-Up Paddleboard Market Revenues & Volume, By Online, 2022 - 2032F |
6.6.3 Australia Stand-Up Paddleboard Market Revenues & Volume, By Third Party Online, 2022 - 2032F |
6.6.4 Australia Stand-Up Paddleboard Market Revenues & Volume, By Franchised Sport Outlet, 2022 - 2032F |
6.6.5 Australia Stand-Up Paddleboard Market Revenues & Volume, By Retail Sports Outlet, 2022 - 2032F |
6.6.6 Australia Stand-Up Paddleboard Market Revenues & Volume, By Modern Trade Channel, 2022 - 2032F |
6.6.7 Australia Stand-Up Paddleboard Market Revenues & Volume, By Specialty Store, 2022 - 2032F |
7 Australia Stand-Up Paddleboard Market Import-Export Trade Statistics |
7.1 Australia Stand-Up Paddleboard Market Export to Major Countries |
7.2 Australia Stand-Up Paddleboard Market Imports from Major Countries |
8 Australia Stand-Up Paddleboard Market Key Performance Indicators |
8.1 Average number of paddleboard rental bookings per month |
8.2 Percentage increase in participation rates in stand-up paddleboarding events |
8.3 Growth in the number of stand-up paddleboarding instructors and schools offering training |
8.4 Average utilization rate of paddleboard rental shops |
8.5 Number of social media engagements related to stand-up paddleboarding events and content |
9 Australia Stand-Up Paddleboard Market - Opportunity Assessment |
9.1 Australia Stand-Up Paddleboard Market Opportunity Assessment, By Product, 2022 & 2032F |
9.2 Australia Stand-Up Paddleboard Market Opportunity Assessment, By Weight, 2022 & 2032F |
9.3 Australia Stand-Up Paddleboard Market Opportunity Assessment, By Length, 2022 & 2032F |
9.4 Australia Stand-Up Paddleboard Market Opportunity Assessment, By Price, 2022 & 2032F |
9.5 Australia Stand-Up Paddleboard Market Opportunity Assessment, By Material, 2022 & 2032F |
9.6 Australia Stand-Up Paddleboard Market Opportunity Assessment, By Distribution Channel, 2022 & 2032F |
10 Australia Stand-Up Paddleboard Market - Competitive Landscape |
10.1 Australia Stand-Up Paddleboard Market Revenue Share, By Companies, 2025 |
10.2 Australia Stand-Up Paddleboard Market Competitive Benchmarking, By Operating and Technical Parameters |
11 Company Profiles |
12 Recommendations |
13 Disclaimer |
Global Go To Market Strategy - 2030
Export potential enables firms to identify high-growth global markets with greater confidence by combining advanced trade intelligence with a structured quantitative methodology. The framework analyzes emerging demand trends and country-level import patterns while integrating macroeconomic and trade datasets such as GDP and population forecasts, bilateral import–export flows, tariff structures, elasticity differentials between developed and developing economies, geographic distance, and import demand projections. Using weighted trade values from 2020–2024 as the base period to project country-to-country export potential for 2030, these inputs are operationalized through calculated drivers such as gravity model parameters, tariff impact factors, and projected GDP per-capita growth. Through an analysis of hidden potentials, demand hotspots, and market conditions that are most favorable to success, this method enables firms to focus on target countries, maximize returns, and global expansion with data, backed by accuracy.
By factoring in the projected importer demand gap that is currently unmet and could be potential opportunity, it identifies the potential for the Exporter (Country) among 190 countries, against the general trade analysis, which identifies the biggest importer or exporter.
To discover high-growth global markets and optimize your business strategy:
Click Here
Pricing
- Single User License$ 1,995
- Department License$ 2,400
- Site License$ 3,120
- Global License$ 3,795

Leadership Perspectives from Industry Events
Search
Thought Leadership and Analyst Meet


Our Clients
6WResearch In News
- India Export Attractiveness Tracker 2026
- India Air Conditioner Market Set for Strong Rebound in 2026 After Weather-Led Correction and GST-Driven Recovery: 6Wresearch
- ADAS in India: How Automatic Emergency Braking, Blind Spot Detection & Driver Monitoring are Transforming Road Safety
- Doha a strategic location for EV manufacturing hub: IPA Qatar
- Demand for luxury TVs surging in the GCC, says Samsung
- Empowering Growth: The Thriving Journey of Bangladesh’s Cable Industry
Latest Reports
- Nicaragua RPG Gaming Market (2026-2032)
- New Zealand RPG Gaming Market (2026-2032)
- Netherlands RPG Gaming Market (2026-2032)
- Nauru RPG Gaming Market (2026-2032)
- Namibia RPG Gaming Market (2026-2032)
- Mozambique RPG Gaming Market (2026-2032)
- Montenegro RPG Gaming Market (2026-2032)
- Mongolia RPG Gaming Market (2026-2032)
- Monaco RPG Gaming Market (2026-2032)
- Micronesia RPG Gaming Market (2026-2032)
Industry Events and Analyst Meet

EV India Expo 2026

HIMTEX 2026

India Refining Summit 2026

India EV Show 2026

EV tech India Expo 2026
Whitepaper
- Middle East & Africa Commercial Security Market Click here to view more.
- Middle East & Africa Fire Safety Systems & Equipment Market Click here to view more.
- GCC Drone Market Click here to view more.
- Middle East Lighting Fixture Market Click here to view more.
- GCC Physical & Perimeter Security Market Click here to view more.