Australia Warehouse Fumigants Market (2026-2032) | Growth, Outlook, Strategy, Trends, Restraints, Revenue, Competitive, Investment Trends, Value, Size, Supply, Strategic Insights, Drivers, Analysis, Segments, Segmentation, Pricing Analysis, Demand, Opportunities, Companies, Consumer Insights, Share, Competition, Challenges, Forecast, Industry
Market Forecast By Type (Phosphine Fumigants, Methyl Bromide Fumigants, Sulfuryl Fluoride Fumigants, Carbon Dioxide Fumigants, Others), By Chemical Composition (Aluminum Phosphide, Methyl Bromide, Fluoride-based, CO2-based), By Application (Pest Control, Insect Control, Disinfection, Rodent Control), By End User (Warehouses & Storage Units, Food Industry, Logistics Centers, Agricultural Storage), By End Use (Professional Tattooing, Tattoo Studios) And Competitive Landscape
| Product Code: ETC11291774 | Publication Date: Apr 2025 | Updated Date: Feb 2026 | Product Type: Market Research Report | |
| Publisher: 6Wresearch | Author: Bhawna Singh | No. of Pages: 65 | No. of Figures: 34 | No. of Tables: 19 |
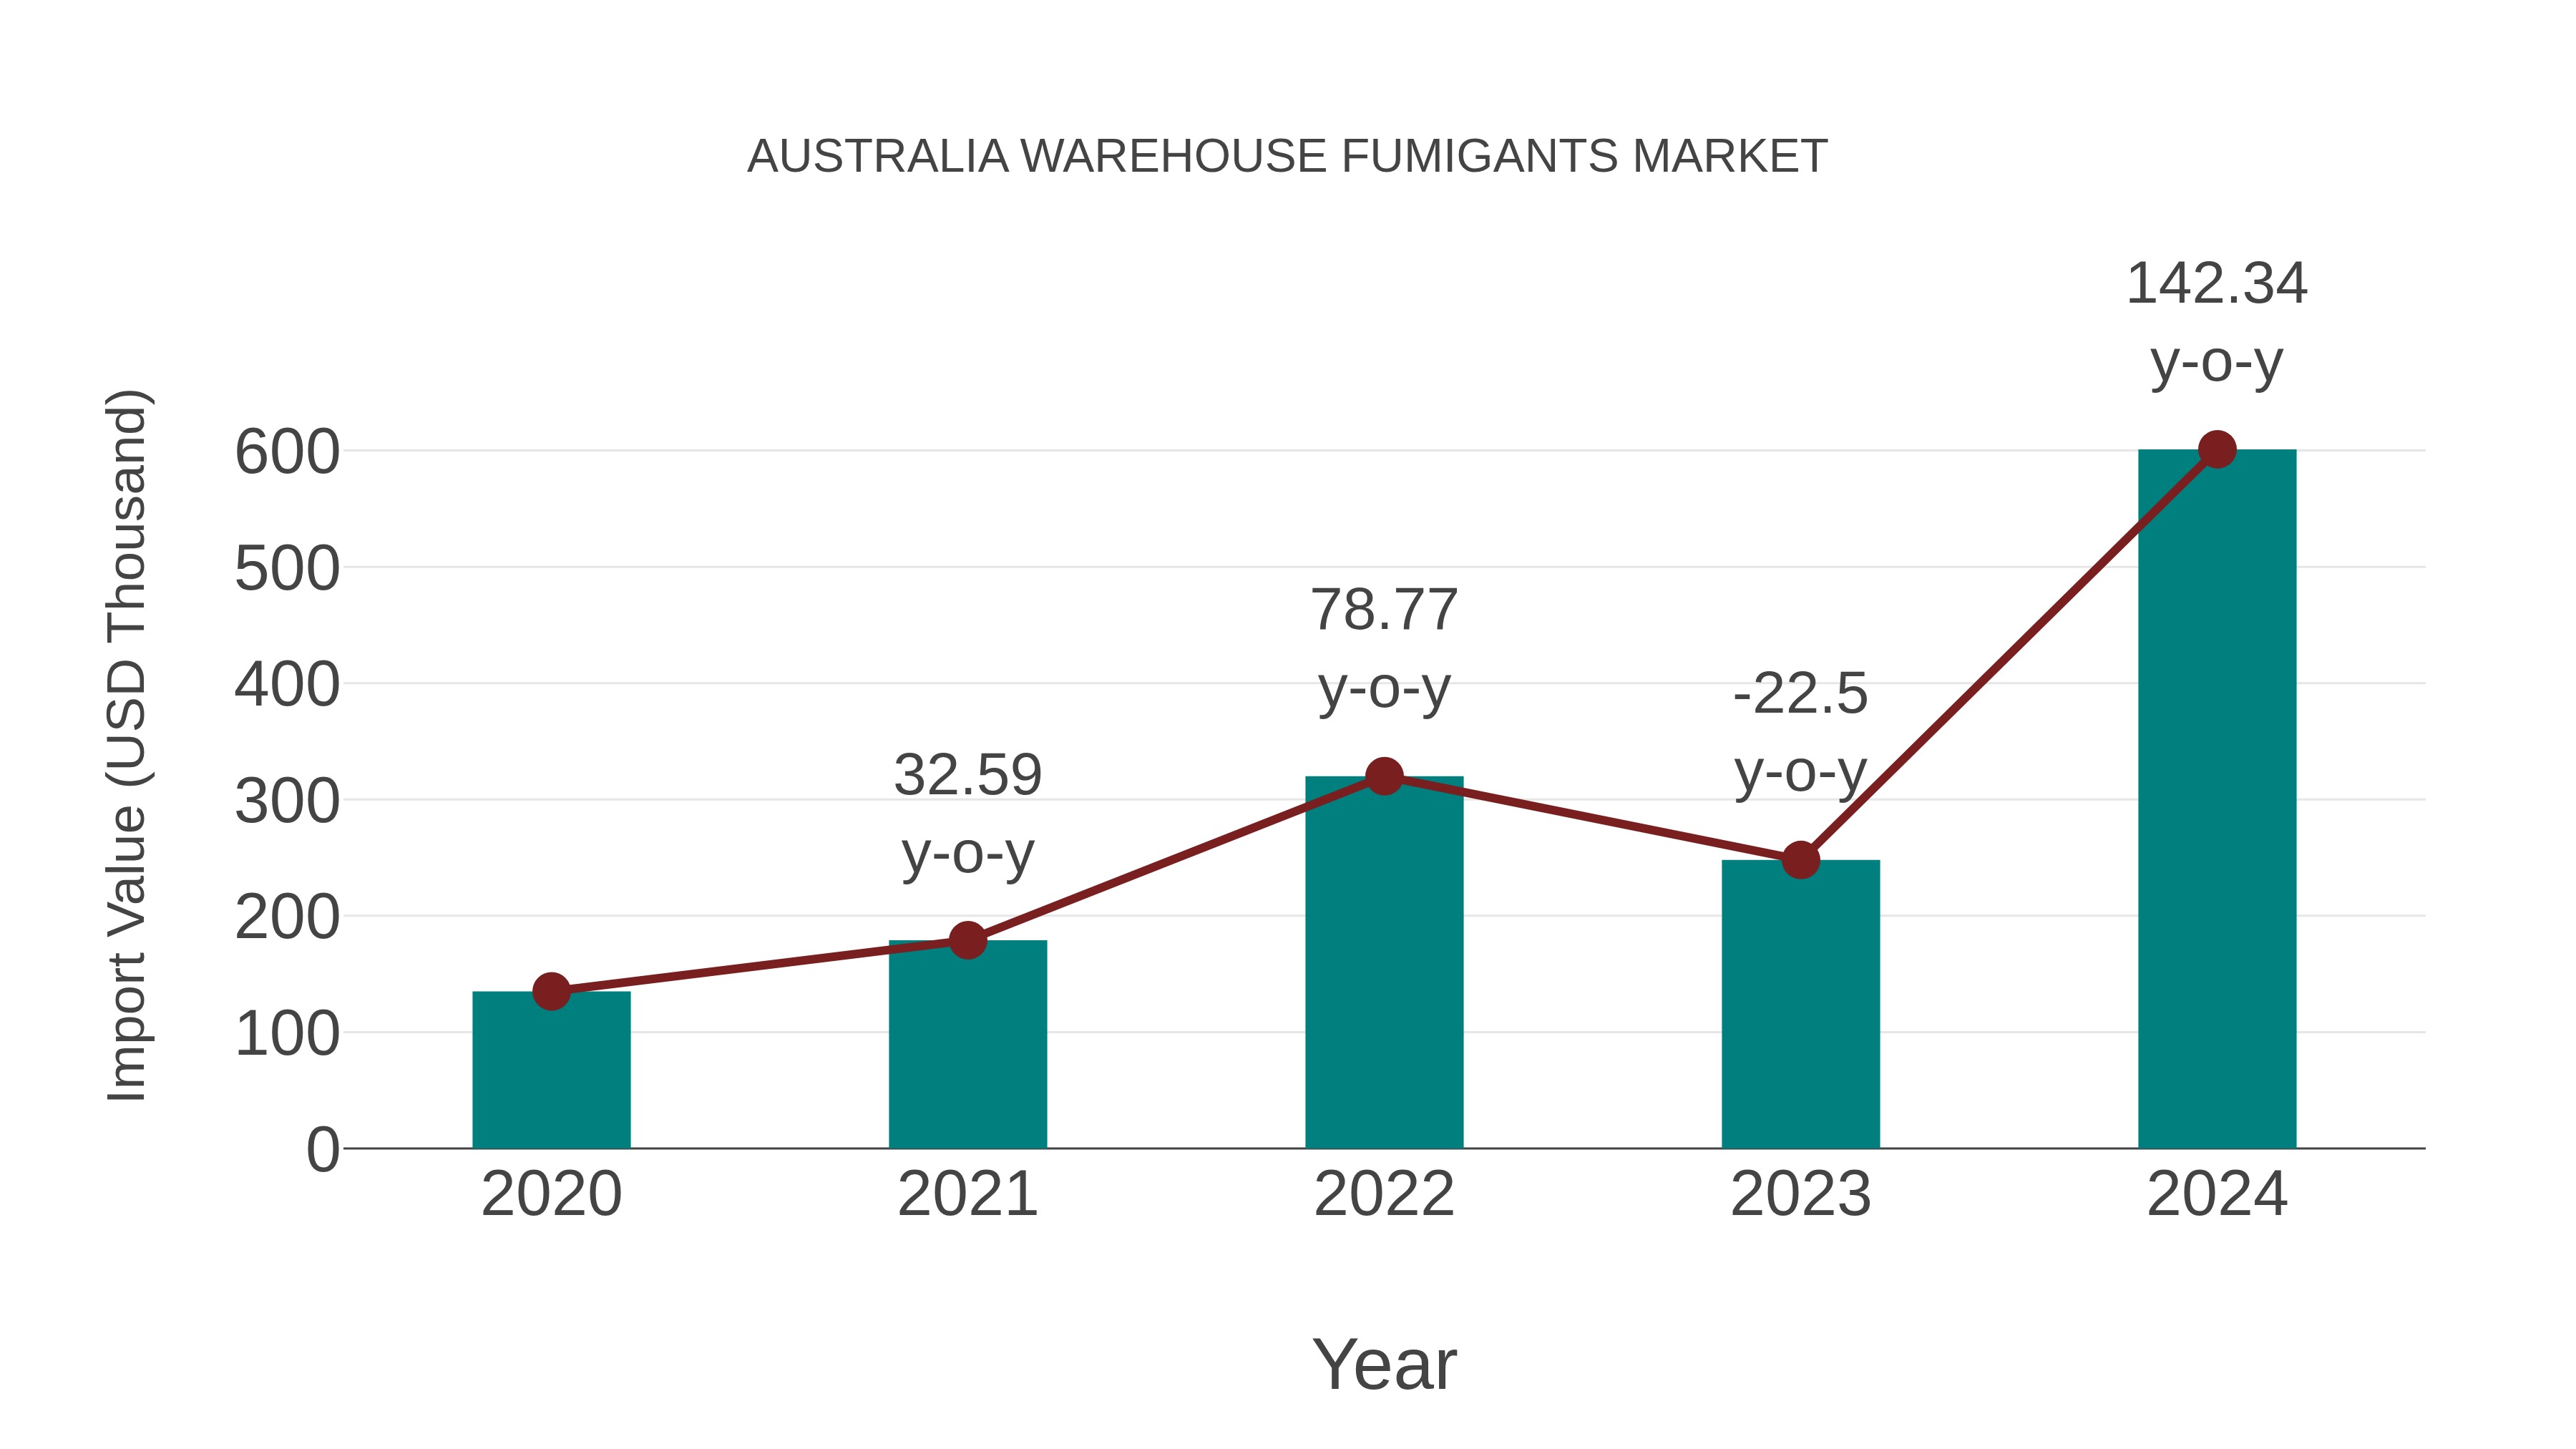
Australia Warehouse Fumigants Market: Import Trend Analysis
Australia`s import trend for warehouse fumigants experienced significant growth from 2023 to 2024, with a growth rate of 142.34%. The compound annual growth rate (CAGR) for the period 2020-2024 stood at 45.26%. This surge in imports could be attributed to heightened demand for fumigation products in response to stricter regulatory requirements or increased trade activities during the period.
Key Highlights of the Report:
- Australia Warehouse Fumigants Market Outlook
- Market Size of Australia Warehouse Fumigants Market, 2025
- Forecast of Australia Warehouse Fumigants Market, 2032
- Historical Data and Forecast of Australia Warehouse Fumigants Revenues & Volume for the Period 2022-2032F
- Australia Warehouse Fumigants Market Trend Evolution
- Australia Warehouse Fumigants Market Drivers and Challenges
- Australia Warehouse Fumigants Price Trends
- Australia Warehouse Fumigants Porter's Five Forces
- Australia Warehouse Fumigants Industry Life Cycle
- Historical Data and Forecast of Australia Warehouse Fumigants Market Revenues & Volume By Type for the Period 2022-2032F
- Historical Data and Forecast of Australia Warehouse Fumigants Market Revenues & Volume By Phosphine Fumigants for the Period 2022-2032F
- Historical Data and Forecast of Australia Warehouse Fumigants Market Revenues & Volume By Methyl Bromide Fumigants for the Period 2022-2032F
- Historical Data and Forecast of Australia Warehouse Fumigants Market Revenues & Volume By Sulfuryl Fluoride Fumigants for the Period 2022-2032F
- Historical Data and Forecast of Australia Warehouse Fumigants Market Revenues & Volume By Carbon Dioxide Fumigants for the Period 2022-2032F
- Historical Data and Forecast of Australia Warehouse Fumigants Market Revenues & Volume By Others for the Period 2022 - 2032F
- Historical Data and Forecast of Australia Warehouse Fumigants Market Revenues & Volume By Chemical Composition for the Period 2022-2032F
- Historical Data and Forecast of Australia Warehouse Fumigants Market Revenues & Volume By Aluminum Phosphide for the Period 2022-2032F
- Historical Data and Forecast of Australia Warehouse Fumigants Market Revenues & Volume By Methyl Bromide for the Period 2022-2032F
- Historical Data and Forecast of Australia Warehouse Fumigants Market Revenues & Volume By Fluoride-based for the Period 2022-2032F
- Historical Data and Forecast of Australia Warehouse Fumigants Market Revenues & Volume By CO2-based for the Period 2022-2032F
- Historical Data and Forecast of Australia Warehouse Fumigants Market Revenues & Volume By Application for the Period 2022-2032F
- Historical Data and Forecast of Australia Warehouse Fumigants Market Revenues & Volume By Pest Control for the Period 2022-2032F
- Historical Data and Forecast of Australia Warehouse Fumigants Market Revenues & Volume By Insect Control for the Period 2022-2032F
- Historical Data and Forecast of Australia Warehouse Fumigants Market Revenues & Volume By Disinfection for the Period 2022-2032F
- Historical Data and Forecast of Australia Warehouse Fumigants Market Revenues & Volume By Rodent Control for the Period 2022-2032F
- Historical Data and Forecast of Australia Warehouse Fumigants Market Revenues & Volume By End User for the Period 2022-2032F
- Historical Data and Forecast of Australia Warehouse Fumigants Market Revenues & Volume By Warehouses & Storage Units for the Period 2022-2032F
- Historical Data and Forecast of Australia Warehouse Fumigants Market Revenues & Volume By Food Industry for the Period 2022-2032F
- Historical Data and Forecast of Australia Warehouse Fumigants Market Revenues & Volume By Logistics Centers for the Period 2022-2032F
- Historical Data and Forecast of Australia Warehouse Fumigants Market Revenues & Volume By Agricultural Storage for the Period 2022-2032F
- Historical Data and Forecast of Australia Warehouse Fumigants Market Revenues & Volume By End Use for the Period 2022-2032F
- Historical Data and Forecast of Australia Warehouse Fumigants Market Revenues & Volume By Professional Tattooing for the Period 2022-2032F
- Historical Data and Forecast of Australia Warehouse Fumigants Market Revenues & Volume By Tattoo Studios for the Period 2022-2032F
- Australia Warehouse Fumigants Import Export Trade Statistics
- Market Opportunity Assessment By Type
- Market Opportunity Assessment By Chemical Composition
- Market Opportunity Assessment By Application
- Market Opportunity Assessment By End User
- Market Opportunity Assessment By End Use
- Australia Warehouse Fumigants Top Companies Market Share
- Australia Warehouse Fumigants Competitive Benchmarking By Technical and Operational Parameters
- Australia Warehouse Fumigants Company Profiles
- Australia Warehouse Fumigants Key Strategic Recommendations
Frequently Asked Questions About the Market Study (FAQs):
6Wresearch actively monitors the Australia Warehouse Fumigants Market and publishes its comprehensive annual report, highlighting emerging trends, growth drivers, revenue analysis, and forecast outlook. Our insights help businesses to make data-backed strategic decisions with ongoing market dynamics. Our analysts track relevent industries related to the Australia Warehouse Fumigants Market, allowing our clients with actionable intelligence and reliable forecasts tailored to emerging regional needs.
Yes, we provide customisation as per your requirements. To learn more, feel free to contact us on sales@6wresearch.com
1 Executive Summary |
2 Introduction |
2.1 Key Highlights of the Report |
2.2 Report Description |
2.3 Market Scope & Segmentation |
2.4 Research Methodology |
2.5 Assumptions |
3 Australia Warehouse Fumigants Market Overview |
3.1 Australia Country Macro Economic Indicators |
3.2 Australia Warehouse Fumigants Market Revenues & Volume, 2022 & 2032F |
3.3 Australia Warehouse Fumigants Market - Industry Life Cycle |
3.4 Australia Warehouse Fumigants Market - Porter's Five Forces |
3.5 Australia Warehouse Fumigants Market Revenues & Volume Share, By Type, 2022 & 2032F |
3.6 Australia Warehouse Fumigants Market Revenues & Volume Share, By Chemical Composition, 2022 & 2032F |
3.7 Australia Warehouse Fumigants Market Revenues & Volume Share, By Application, 2022 & 2032F |
3.8 Australia Warehouse Fumigants Market Revenues & Volume Share, By End User, 2022 & 2032F |
4 Australia Warehouse Fumigants Market Dynamics |
4.1 Impact Analysis |
4.2 Market Drivers |
4.2.1 Increasing demand for pest control solutions in warehouses due to growing awareness about food safety and hygiene regulations. |
4.2.2 Adoption of integrated pest management practices by warehouse operators to ensure pest-free storage environments. |
4.2.3 Rising focus on sustainable and environmentally friendly fumigation methods in line with stringent regulations. |
4.3 Market Restraints |
4.3.1 Stringent regulations on the use of fumigants in warehouses to minimize environmental impact and ensure worker safety. |
4.3.2 High costs associated with implementing fumigation solutions and compliance with regulatory standards. |
4.3.3 Concerns regarding the potential health risks and environmental hazards posed by certain fumigants used in warehouse pest control. |
5 Australia Warehouse Fumigants Market Trends |
6 Australia Warehouse Fumigants Market, By Types |
6.1 Australia Warehouse Fumigants Market, By Type |
6.1.1 Overview and Analysis |
6.1.2 Australia Warehouse Fumigants Market Revenues & Volume, By Type, 2022 - 2032F |
6.1.3 Australia Warehouse Fumigants Market Revenues & Volume, By Phosphine Fumigants, 2022 - 2032F |
6.1.4 Australia Warehouse Fumigants Market Revenues & Volume, By Methyl Bromide Fumigants, 2022 - 2032F |
6.1.5 Australia Warehouse Fumigants Market Revenues & Volume, By Sulfuryl Fluoride Fumigants, 2022 - 2032F |
6.1.6 Australia Warehouse Fumigants Market Revenues & Volume, By Carbon Dioxide Fumigants, 2022 - 2032F |
6.1.7 Australia Warehouse Fumigants Market Revenues & Volume, By Others, 2022 - 2032F |
6.2 Australia Warehouse Fumigants Market, By Chemical Composition |
6.2.1 Overview and Analysis |
6.2.2 Australia Warehouse Fumigants Market Revenues & Volume, By Aluminum Phosphide, 2022 - 2032F |
6.2.3 Australia Warehouse Fumigants Market Revenues & Volume, By Methyl Bromide, 2022 - 2032F |
6.2.4 Australia Warehouse Fumigants Market Revenues & Volume, By Fluoride-based, 2022 - 2032F |
6.2.5 Australia Warehouse Fumigants Market Revenues & Volume, By CO2-based, 2022 - 2032F |
6.3 Australia Warehouse Fumigants Market, By Application |
6.3.1 Overview and Analysis |
6.3.2 Australia Warehouse Fumigants Market Revenues & Volume, By Pest Control, 2022 - 2032F |
6.3.3 Australia Warehouse Fumigants Market Revenues & Volume, By Insect Control, 2022 - 2032F |
6.3.4 Australia Warehouse Fumigants Market Revenues & Volume, By Disinfection, 2022 - 2032F |
6.3.5 Australia Warehouse Fumigants Market Revenues & Volume, By Rodent Control, 2022 - 2032F |
6.4 Australia Warehouse Fumigants Market, By End User |
6.4.1 Overview and Analysis |
6.4.2 Australia Warehouse Fumigants Market Revenues & Volume, By Warehouses & Storage Units, 2022 - 2032F |
6.4.3 Australia Warehouse Fumigants Market Revenues & Volume, By Food Industry, 2022 - 2032F |
6.4.4 Australia Warehouse Fumigants Market Revenues & Volume, By Logistics Centers, 2022 - 2032F |
6.4.5 Australia Warehouse Fumigants Market Revenues & Volume, By Agricultural Storage, 2022 - 2032F |
7 Australia Warehouse Fumigants Market Import-Export Trade Statistics |
7.1 Australia Warehouse Fumigants Market Export to Major Countries |
7.2 Australia Warehouse Fumigants Market Imports from Major Countries |
8 Australia Warehouse Fumigants Market Key Performance Indicators |
8.1 Percentage of warehouses implementing integrated pest management practices. |
8.2 Compliance rate with environmental regulations related to fumigant use in warehouses. |
8.3 Adoption rate of sustainable and eco-friendly fumigation methods. |
8.4 Number of reported incidents or violations related to fumigant use in warehouses. |
8.5 Rate of adoption of alternative pest control solutions in warehouses. |
9 Australia Warehouse Fumigants Market - Opportunity Assessment |
9.1 Australia Warehouse Fumigants Market Opportunity Assessment, By Type, 2022 & 2032F |
9.2 Australia Warehouse Fumigants Market Opportunity Assessment, By Chemical Composition, 2022 & 2032F |
9.3 Australia Warehouse Fumigants Market Opportunity Assessment, By Application, 2022 & 2032F |
9.4 Australia Warehouse Fumigants Market Opportunity Assessment, By End User, 2022 & 2032F |
10 Australia Warehouse Fumigants Market - Competitive Landscape |
10.1 Australia Warehouse Fumigants Market Revenue Share, By Companies, 2025 |
10.2 Australia Warehouse Fumigants Market Competitive Benchmarking, By Operating and Technical Parameters |
11 Company Profiles |
12 Recommendations |
13 Disclaimer |
Export potential assessment - trade Analytics for 2030
Export potential enables firms to identify high-growth global markets with greater confidence by combining advanced trade intelligence with a structured quantitative methodology. The framework analyzes emerging demand trends and country-level import patterns while integrating macroeconomic and trade datasets such as GDP and population forecasts, bilateral import–export flows, tariff structures, elasticity differentials between developed and developing economies, geographic distance, and import demand projections. Using weighted trade values from 2020–2024 as the base period to project country-to-country export potential for 2030, these inputs are operationalized through calculated drivers such as gravity model parameters, tariff impact factors, and projected GDP per-capita growth. Through an analysis of hidden potentials, demand hotspots, and market conditions that are most favorable to success, this method enables firms to focus on target countries, maximize returns, and global expansion with data, backed by accuracy.
By factoring in the projected importer demand gap that is currently unmet and could be potential opportunity, it identifies the potential for the Exporter (Country) among 190 countries, against the general trade analysis, which identifies the biggest importer or exporter.
To discover high-growth global markets and optimize your business strategy:
Click Here
Pricing
- Single User License$ 1,995
- Department License$ 2,400
- Site License$ 3,120
- Global License$ 3,795

Search
Thought Leadership and Analyst Meet


Our Clients
Latest Reports
- India Ultrasonic Smart Water Meter Market (2026-2032) | Outlook, Competition, Drivers, Trends, Demand, Competitive, Strategic Insights, Companies, Challenges, Strategy, Consumer Insights, Analysis, Opportunities, Growth, Size, Share, Industry, Revenue, Segments, Value, Segmentation, Supply, Forecast, Restraints,
- India Electromagnetic Bulk Flow Meter Market (2026-2032) | Analysis, Challenges, Strategic Insights, Supply, Forecast, Growth, Share, Consumer Insights, Competitive, Value, Outlook, Size & Demand,
- India Battery Powered Bulk Flow Meter Market (2026-2032) | Outlook, Analysis, Competitive Landscape, Growth, Size, Trends, Value, Revenue, Companies, Segmentation, Share & Forecast
- Bosnia and Herzegovina Fuel-Efficient Winglets Market (2026-2032) | Growth, Competition, Strategy, Restraints, Trends, Challenges, segmentation, Value, Outlook, Investment Opportunities, Analysis, Revenue, Companies, Insights, Pricing, Size, Drivers, Demand, Share, Forecast
- Canada Cloud CFD Market (2026-2032) | Size & Revenue, Industry, Growth, Competitive Landscape, Forecast, Segmentation, Value, Outlook, Trends, Share, Analysis, Companies
- Taiwan Food Delivery Platform Market (2026-2032) | Companies, Outlook, Analysis, Trends, Value, Revenue, Segmentation, Share, Forecast, Competitive Landscape, Growth, Size & Forecast
- United Kingdom (UK) Long-term Care Insurance Market (2026-2032) | Growth, Share, Consumer Insights, Drivers, Opportunities, Competition, Pricing Analysis, Segments, Restraints, Companies, Competitive, Value, Outlook, Size, Demand, Analysis, Challenges, Strategic Insights, Investment Trends, Revenue, Trends, Supply, Forecast
- United Kingdom (UK) Long Term Care Market (2026-2032) | Companies, Outlook, Analysis, Trends, Value, Revenue, Segmentation, Share, Forecast, Competitive Landscape, Growth, Size & Forecast
- Iraq Insulation and Waterproofing Market (2026-2032) | Outlook, Drivers, Growth, Size, Share, Industry, Revenue, Trends, Demand, Competitive, Strategic Insights, Opportunities, Segments, Companies, Challenges, Strategy, Consumer Insights, Analysis, Investment Trends, Value, Segmentation, Forecast, Restraints
- India Switchgear Market Outlook (2026-2032) | Size, Share, Trends, Growth, Revenue, Forecast, Analysis, Value, Outlook
Industry Events and Analyst Meet

India EV Show 2026

EV tech India Expo 2026

Auto Tech Asia 2026

Battery Tech India 2026

Smart Production Solutions Guangzhou 2026
Whitepaper
- Middle East & Africa Commercial Security Market Click here to view more.
- Middle East & Africa Fire Safety Systems & Equipment Market Click here to view more.
- GCC Drone Market Click here to view more.
- Middle East Lighting Fixture Market Click here to view more.
- GCC Physical & Perimeter Security Market Click here to view more.
6WResearch In News
- Doha a strategic location for EV manufacturing hub: IPA Qatar
- Demand for luxury TVs surging in the GCC, says Samsung
- Empowering Growth: The Thriving Journey of Bangladesh’s Cable Industry
- Demand for luxury TVs surging in the GCC, says Samsung
- Video call with a traditional healer? Once unthinkable, it’s now common in South Africa
- Intelligent Buildings To Smooth GCC’s Path To Net Zero