Austria Automotive Crash Barriers Market (2026-2032) | Outlook, Revenue, Competition, Competitive, Share, Drivers, Opportunities, Supply, Segmentation, Analysis, Consumer Insights, Demand, Strategic Insights, Trends, Challenges, Industry, Value, Pricing Analysis, Strategy, Size, Investment Trends, Forecast, Restraints, Segments, Growth, Companies
Market Forecast By Type (Rigid Barriers, Semi-Rigid Barriers, Flexible Barriers, Smart Barriers), By Material (Concrete, Steel, Plastic Composites, IoT-Enabled Materials), By Application (Highways, Urban Roads, Race Tracks, Autonomous Zones) And Competitive Landscape
| Product Code: ETC10856190 | Publication Date: Apr 2025 | Updated Date: Apr 2026 | Product Type: Market Research Report | |
| Publisher: 6Wresearch | Author: Bhawna Singh | No. of Pages: 65 | No. of Figures: 34 | No. of Tables: 19 |
Austria Automotive Crash Barriers Market Size (2020-2030)
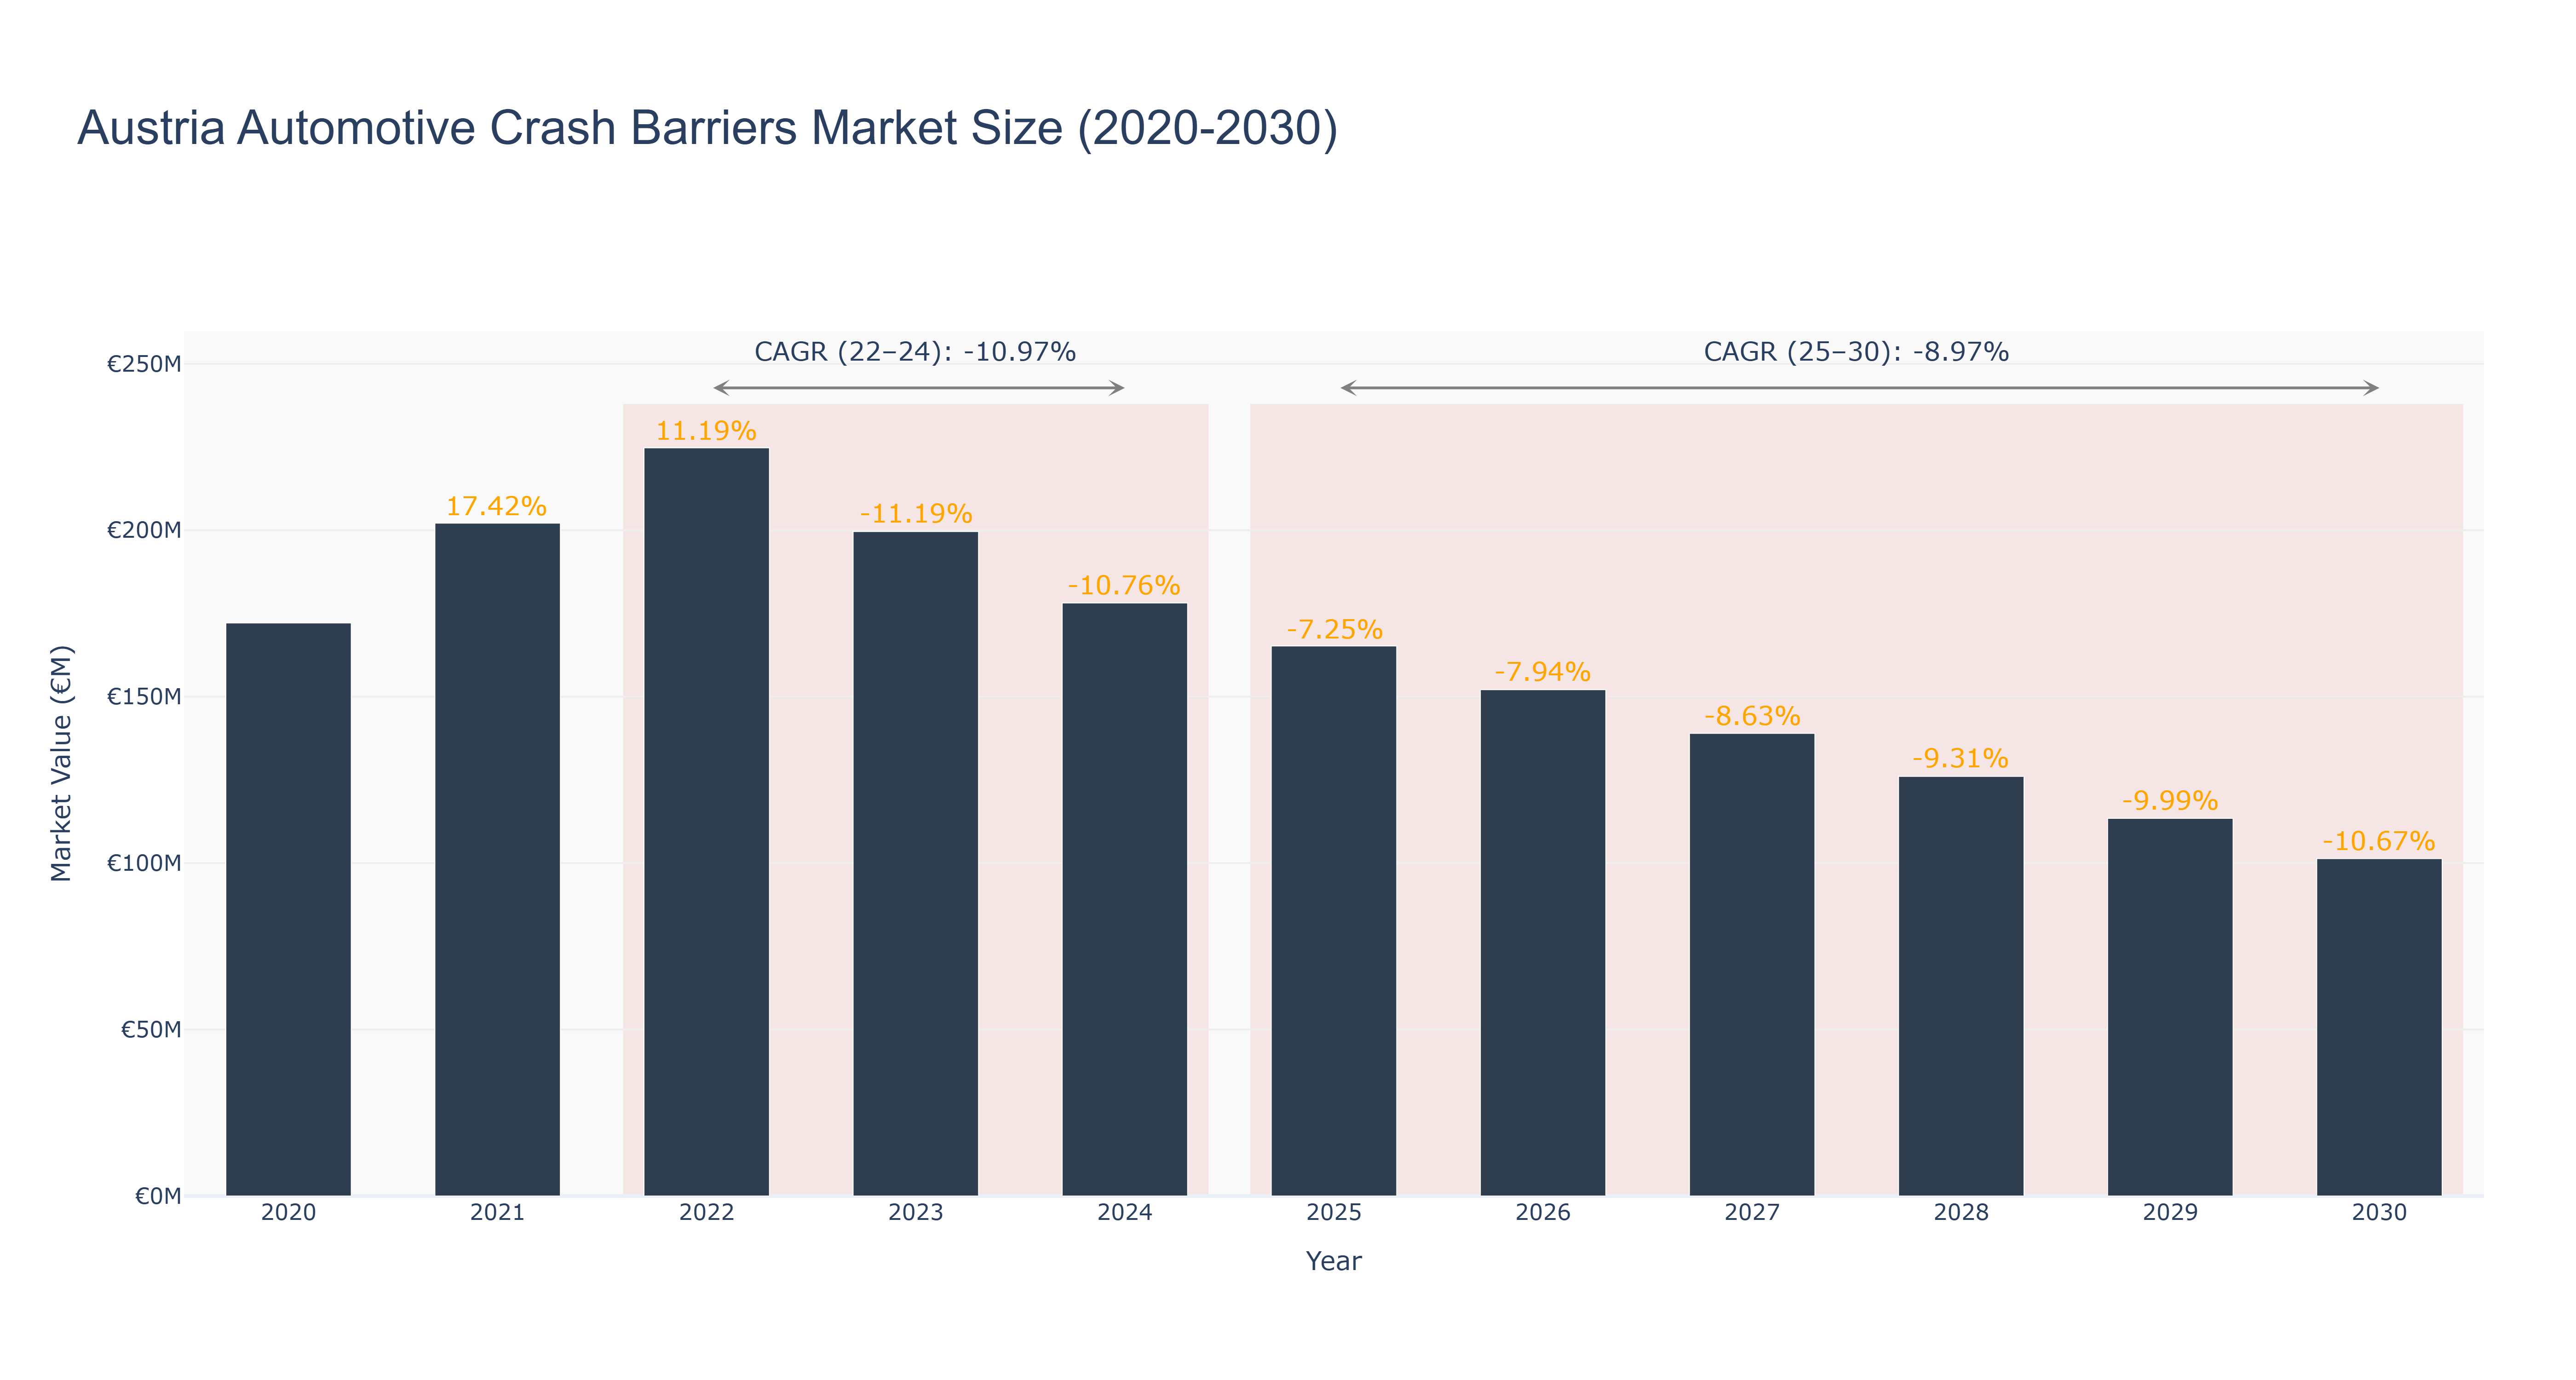
The Austria Automotive Crash Barriers Market experienced a peak in 2022 with a market size of €224.77 million, followed by a steady decline to €152.12 million in 2026. The market is forecasted to continue shrinking, reaching €101.35 million by 2030, with a CAGR of -8.97% from 2025 to 2030. The downward trend can be attributed to factors such as reduced infrastructure spending and a slowdown in construction projects. To counter this decline, the market is likely to see advancements in crash barrier technology, focusing on improving safety features and durability. Additionally, upcoming government initiatives aimed at enhancing road safety standards may provide opportunities for market growth in the future. Key Industry Drivers: Infrastructure development, road safety regulations Forward-Looking Insight: Future developments may include the introduction of innovative crash barrier designs and materials to enhance overall road safety standards in Austria.
Austria Automotive Crash Barriers Market: Production & Trade Performance (2019-2025)
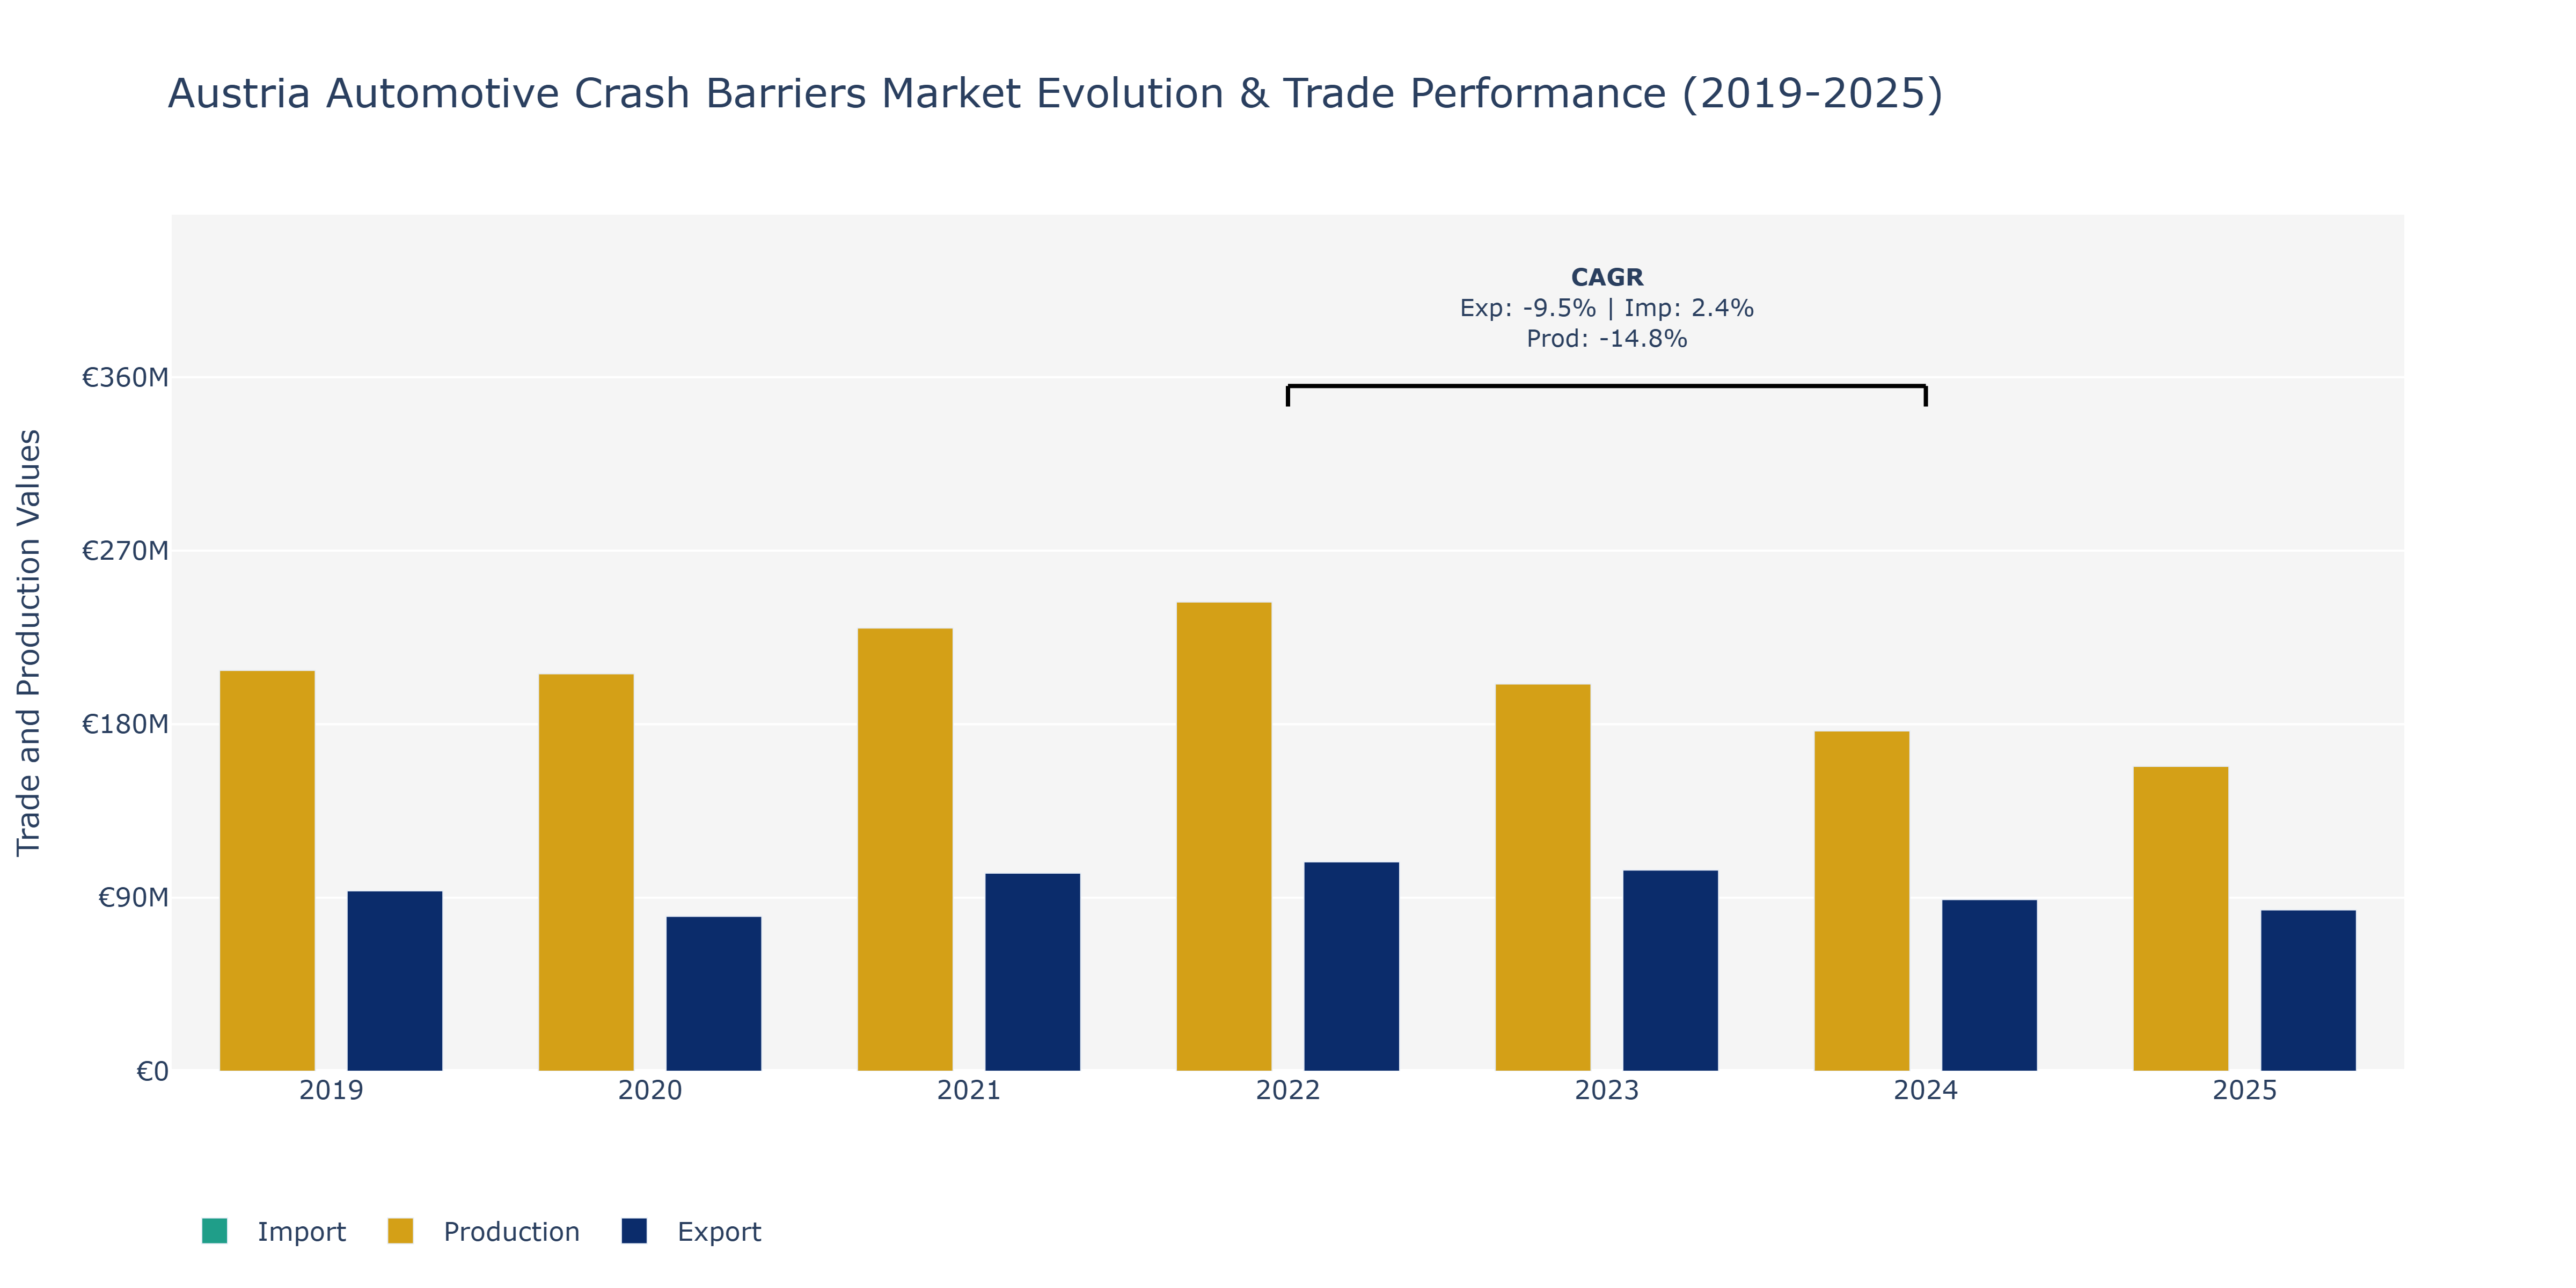
From 2019 to 2025, the Austria Automotive Crash Barriers Market witnessed fluctuations in Exports, Imports, and Production. Exports experienced a decline from €93.57 million in 2019 to €83.68 million in 2025, with a peak of €108.6 million in 2022. Imports showed variation, reaching €82.39 million in 2021, then decreasing to €65.97 million in 2023, before rising slightly to €80.37 million in 2025. Production value fluctuated as well, with a high of €243.36 million in 2022 and a low of €158.09 million in 2025. The decrease in Production could be attributed to technological advancements leading to more durable crash barriers, impacting replacement rates. The fluctuations in Exports and Imports may reflect changes in global demand or trade agreements affecting the automotive safety industry in Austria. To sustain growth, companies might focus on innovation and cost-efficiency amid competitive market conditions.
Key Highlights of the Report:
- Austria Automotive Crash Barriers Market Outlook
- Market Size of Austria Automotive Crash Barriers Market, 2025
- Forecast of Austria Automotive Crash Barriers Market, 2032
- Historical Data and Forecast of Austria Automotive Crash Barriers Revenues & Volume for the Period 2022-2032F
- Austria Automotive Crash Barriers Market Trend Evolution
- Austria Automotive Crash Barriers Market Drivers and Challenges
- Austria Automotive Crash Barriers Price Trends
- Austria Automotive Crash Barriers Porter's Five Forces
- Austria Automotive Crash Barriers Industry Life Cycle
- Historical Data and Forecast of Austria Automotive Crash Barriers Market Revenues & Volume By Type for the Period 2022-2032F
- Historical Data and Forecast of Austria Automotive Crash Barriers Market Revenues & Volume By Rigid Barriers for the Period 2022-2032F
- Historical Data and Forecast of Austria Automotive Crash Barriers Market Revenues & Volume By Semi-Rigid Barriers for the Period 2022-2032F
- Historical Data and Forecast of Austria Automotive Crash Barriers Market Revenues & Volume By Flexible Barriers for the Period 2022-2032F
- Historical Data and Forecast of Austria Automotive Crash Barriers Market Revenues & Volume By Smart Barriers for the Period 2022-2032F
- Historical Data and Forecast of Austria Automotive Crash Barriers Market Revenues & Volume By Material for the Period 2022-2032F
- Historical Data and Forecast of Austria Automotive Crash Barriers Market Revenues & Volume By Concrete for the Period 2022-2032F
- Historical Data and Forecast of Austria Automotive Crash Barriers Market Revenues & Volume By Steel for the Period 2022-2032F
- Historical Data and Forecast of Austria Automotive Crash Barriers Market Revenues & Volume By Plastic Composites for the Period 2022-2032F
- Historical Data and Forecast of Austria Automotive Crash Barriers Market Revenues & Volume By IoT-Enabled Materials for the Period 2022-2032F
- Historical Data and Forecast of Austria Automotive Crash Barriers Market Revenues & Volume By Application for the Period 2022-2032F
- Historical Data and Forecast of Austria Automotive Crash Barriers Market Revenues & Volume By Highways for the Period 2022-2032F
- Historical Data and Forecast of Austria Automotive Crash Barriers Market Revenues & Volume By Urban Roads for the Period 2022-2032F
- Historical Data and Forecast of Austria Automotive Crash Barriers Market Revenues & Volume By Race Tracks for the Period 2022-2032F
- Historical Data and Forecast of Austria Automotive Crash Barriers Market Revenues & Volume By Autonomous Zones for the Period 2022-2032F
- Austria Automotive Crash Barriers Import Export Trade Statistics
- Market Opportunity Assessment By Type
- Market Opportunity Assessment By Material
- Market Opportunity Assessment By Application
- Austria Automotive Crash Barriers Top Companies Market Share
- Austria Automotive Crash Barriers Competitive Benchmarking By Technical and Operational Parameters
- Austria Automotive Crash Barriers Company Profiles
- Austria Automotive Crash Barriers Key Strategic Recommendations
Frequently Asked Questions About the Market Study (FAQs):
6Wresearch actively monitors the Austria Automotive Crash Barriers Market and publishes its comprehensive annual report, highlighting emerging trends, growth drivers, revenue analysis, and forecast outlook. Our insights help businesses to make data-backed strategic decisions with ongoing market dynamics. Our analysts track relevent industries related to the Austria Automotive Crash Barriers Market, allowing our clients with actionable intelligence and reliable forecasts tailored to emerging regional needs.
Yes, we provide customisation as per your requirements. To learn more, feel free to contact us on sales@6wresearch.com
1 Executive Summary |
2 Introduction |
2.1 Key Highlights of the Report |
2.2 Report Description |
2.3 Market Scope & Segmentation |
2.4 Research Methodology |
2.5 Assumptions |
3 Austria Automotive Crash Barriers Market Overview |
3.1 Austria Country Macro Economic Indicators |
3.2 Austria Automotive Crash Barriers Market Revenues & Volume, 2022 & 2032F |
3.3 Austria Automotive Crash Barriers Market - Industry Life Cycle |
3.4 Austria Automotive Crash Barriers Market - Porter's Five Forces |
3.5 Austria Automotive Crash Barriers Market Revenues & Volume Share, By Type, 2022 & 2032F |
3.6 Austria Automotive Crash Barriers Market Revenues & Volume Share, By Material, 2022 & 2032F |
3.7 Austria Automotive Crash Barriers Market Revenues & Volume Share, By Application, 2022 & 2032F |
4 Austria Automotive Crash Barriers Market Dynamics |
4.1 Impact Analysis |
4.2 Market Drivers |
4.3 Market Restraints |
5 Austria Automotive Crash Barriers Market Trends |
6 Austria Automotive Crash Barriers Market, By Types |
6.1 Austria Automotive Crash Barriers Market, By Type |
6.1.1 Overview and Analysis |
6.1.2 Austria Automotive Crash Barriers Market Revenues & Volume, By Type, 2022 - 2032F |
6.1.3 Austria Automotive Crash Barriers Market Revenues & Volume, By Rigid Barriers, 2022 - 2032F |
6.1.4 Austria Automotive Crash Barriers Market Revenues & Volume, By Semi-Rigid Barriers, 2022 - 2032F |
6.1.5 Austria Automotive Crash Barriers Market Revenues & Volume, By Flexible Barriers, 2022 - 2032F |
6.1.6 Austria Automotive Crash Barriers Market Revenues & Volume, By Smart Barriers, 2022 - 2032F |
6.2 Austria Automotive Crash Barriers Market, By Material |
6.2.1 Overview and Analysis |
6.2.2 Austria Automotive Crash Barriers Market Revenues & Volume, By Concrete, 2022 - 2032F |
6.2.3 Austria Automotive Crash Barriers Market Revenues & Volume, By Steel, 2022 - 2032F |
6.2.4 Austria Automotive Crash Barriers Market Revenues & Volume, By Plastic Composites, 2022 - 2032F |
6.2.5 Austria Automotive Crash Barriers Market Revenues & Volume, By IoT-Enabled Materials, 2022 - 2032F |
6.3 Austria Automotive Crash Barriers Market, By Application |
6.3.1 Overview and Analysis |
6.3.2 Austria Automotive Crash Barriers Market Revenues & Volume, By Highways, 2022 - 2032F |
6.3.3 Austria Automotive Crash Barriers Market Revenues & Volume, By Urban Roads, 2022 - 2032F |
6.3.4 Austria Automotive Crash Barriers Market Revenues & Volume, By Race Tracks, 2022 - 2032F |
6.3.5 Austria Automotive Crash Barriers Market Revenues & Volume, By Autonomous Zones, 2022 - 2032F |
7 Austria Automotive Crash Barriers Market Import-Export Trade Statistics |
7.1 Austria Automotive Crash Barriers Market Export to Major Countries |
7.2 Austria Automotive Crash Barriers Market Imports from Major Countries |
8 Austria Automotive Crash Barriers Market Key Performance Indicators |
9 Austria Automotive Crash Barriers Market - Opportunity Assessment |
9.1 Austria Automotive Crash Barriers Market Opportunity Assessment, By Type, 2022 & 2032F |
9.2 Austria Automotive Crash Barriers Market Opportunity Assessment, By Material, 2022 & 2032F |
9.3 Austria Automotive Crash Barriers Market Opportunity Assessment, By Application, 2022 & 2032F |
10 Austria Automotive Crash Barriers Market - Competitive Landscape |
10.1 Austria Automotive Crash Barriers Market Revenue Share, By Companies, 2025 |
10.2 Austria Automotive Crash Barriers Market Competitive Benchmarking, By Operating and Technical Parameters |
11 Company Profiles |
12 Recommendations |
13 Disclaimer |
Export potential assessment - trade Analytics for 2030
Export potential enables firms to identify high-growth global markets with greater confidence by combining advanced trade intelligence with a structured quantitative methodology. The framework analyzes emerging demand trends and country-level import patterns while integrating macroeconomic and trade datasets such as GDP and population forecasts, bilateral import–export flows, tariff structures, elasticity differentials between developed and developing economies, geographic distance, and import demand projections. Using weighted trade values from 2020–2024 as the base period to project country-to-country export potential for 2030, these inputs are operationalized through calculated drivers such as gravity model parameters, tariff impact factors, and projected GDP per-capita growth. Through an analysis of hidden potentials, demand hotspots, and market conditions that are most favorable to success, this method enables firms to focus on target countries, maximize returns, and global expansion with data, backed by accuracy.
By factoring in the projected importer demand gap that is currently unmet and could be potential opportunity, it identifies the potential for the Exporter (Country) among 190 countries, against the general trade analysis, which identifies the biggest importer or exporter.
To discover high-growth global markets and optimize your business strategy:
Click Here
Pricing
- Single User License$ 1,995
- Department License$ 2,400
- Site License$ 3,120
- Global License$ 3,795

Search
Thought Leadership and Analyst Meet


Our Clients
Latest Reports
- India Ultrasonic Smart Water Meter Market (2026-2032) | Outlook, Competition, Drivers, Trends, Demand, Competitive, Strategic Insights, Companies, Challenges, Strategy, Consumer Insights, Analysis, Opportunities, Growth, Size, Share, Industry, Revenue, Segments, Value, Segmentation, Supply, Forecast, Restraints,
- India Electromagnetic Bulk Flow Meter Market (2026-2032) | Analysis, Challenges, Strategic Insights, Supply, Forecast, Growth, Share, Consumer Insights, Competitive, Value, Outlook, Size & Demand,
- India Battery Powered Bulk Flow Meter Market (2026-2032) | Outlook, Analysis, Competitive Landscape, Growth, Size, Trends, Value, Revenue, Companies, Segmentation, Share & Forecast
- Bosnia and Herzegovina Fuel-Efficient Winglets Market (2026-2032) | Growth, Competition, Strategy, Restraints, Trends, Challenges, segmentation, Value, Outlook, Investment Opportunities, Analysis, Revenue, Companies, Insights, Pricing, Size, Drivers, Demand, Share, Forecast
- Canada Cloud CFD Market (2026-2032) | Size & Revenue, Industry, Growth, Competitive Landscape, Forecast, Segmentation, Value, Outlook, Trends, Share, Analysis, Companies
- Taiwan Food Delivery Platform Market (2026-2032) | Companies, Outlook, Analysis, Trends, Value, Revenue, Segmentation, Share, Forecast, Competitive Landscape, Growth, Size & Forecast
- United Kingdom (UK) Long-term Care Insurance Market (2026-2032) | Growth, Share, Consumer Insights, Drivers, Opportunities, Competition, Pricing Analysis, Segments, Restraints, Companies, Competitive, Value, Outlook, Size, Demand, Analysis, Challenges, Strategic Insights, Investment Trends, Revenue, Trends, Supply, Forecast
- United Kingdom (UK) Long Term Care Market (2026-2032) | Companies, Outlook, Analysis, Trends, Value, Revenue, Segmentation, Share, Forecast, Competitive Landscape, Growth, Size & Forecast
- Iraq Insulation and Waterproofing Market (2026-2032) | Outlook, Drivers, Growth, Size, Share, Industry, Revenue, Trends, Demand, Competitive, Strategic Insights, Opportunities, Segments, Companies, Challenges, Strategy, Consumer Insights, Analysis, Investment Trends, Value, Segmentation, Forecast, Restraints
- India Switchgear Market Outlook (2026-2032) | Size, Share, Trends, Growth, Revenue, Forecast, Analysis, Value, Outlook
Industry Events and Analyst Meet

HIMTEX 2026

India Refining Summit 2026

India EV Show 2026

EV tech India Expo 2026

Auto Tech Asia 2026
Whitepaper
- Middle East & Africa Commercial Security Market Click here to view more.
- Middle East & Africa Fire Safety Systems & Equipment Market Click here to view more.
- GCC Drone Market Click here to view more.
- Middle East Lighting Fixture Market Click here to view more.
- GCC Physical & Perimeter Security Market Click here to view more.
6WResearch In News
- Doha a strategic location for EV manufacturing hub: IPA Qatar
- Demand for luxury TVs surging in the GCC, says Samsung
- Empowering Growth: The Thriving Journey of Bangladesh’s Cable Industry
- Demand for luxury TVs surging in the GCC, says Samsung
- Video call with a traditional healer? Once unthinkable, it’s now common in South Africa
- Intelligent Buildings To Smooth GCC’s Path To Net Zero