Austria Dental Prosthetics Market (2026-2032) | Size, Companies, Outlook, Segmentation, Forecast, Share, Trends, Growth, Analysis, Value, Revenue & Industry
Market Forecast By Type (Crowns, Bridges, Abutments, Dentures, Others), By End-users (Dental Hospitals & Clinics, Dental Laboratories, Others) And Competitive Landscape
| Product Code: ETC4667900 | Publication Date: Nov 2023 | Updated Date: Mar 2026 | Product Type: Market Research Report | |
| Publisher: 6Wresearch | Author: Shubham Padhi | No. of Pages: 60 | No. of Figures: 30 | No. of Tables: 5 |
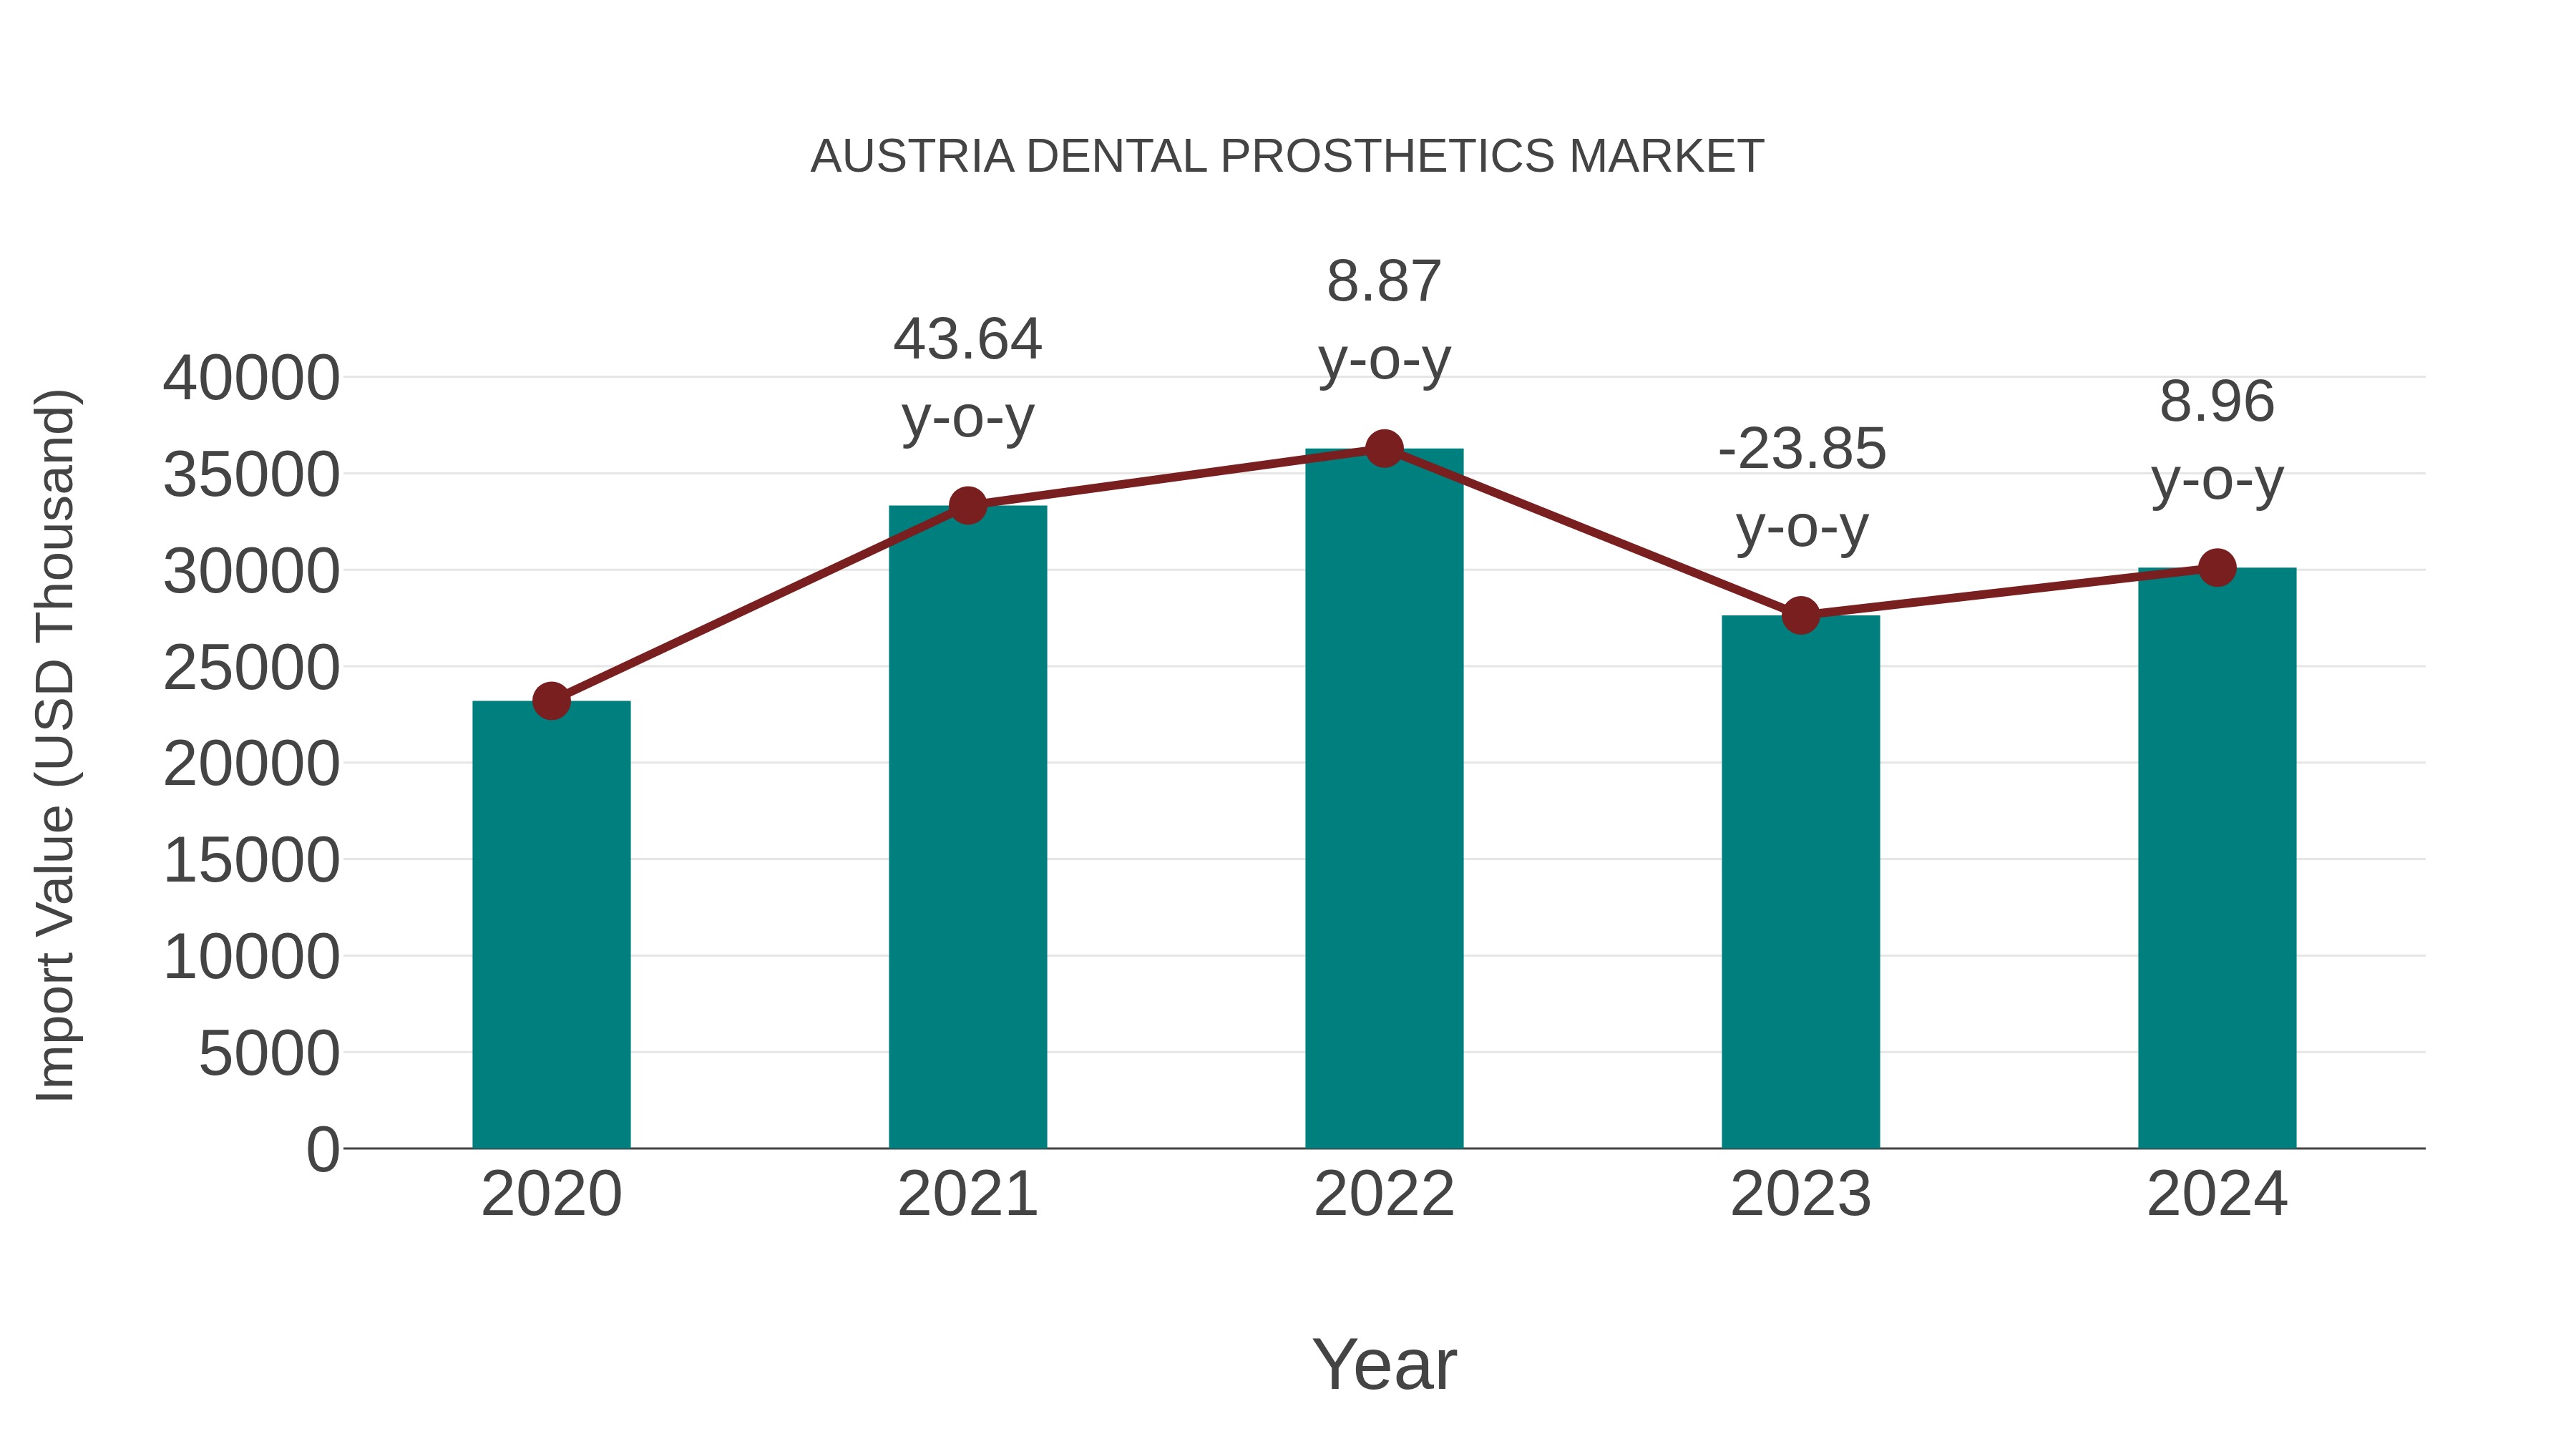
Austria Dental Prosthetics Market: Import Trend Analysis
The Austria dental prosthetics market witnessed a steady increase in imports from 2020 to 2024. The compound annual growth rate (CAGR) for this period was 6.73%. Notably, the year-on-year growth rate spiked to 8.96% in 2024, indicating a significant rise in imports during that year.
Austria Dental Prosthetics Market Overview
The Dental Prosthetics market in Austria covers a range of artificial devices used to replace missing teeth, including dentures, bridges, and crowns. The market is driven by the increasing prevalence of tooth loss and the demand for functional and aesthetic replacements.
Drivers of the market
The dental prosthetics market is experiencing growth as the need for restorative dental solutions increases. Patients are increasingly seeking prosthetic options that enhance both function and aesthetics. The advancements in materials and technology, such as 3D printing and CAD/CAM systems, allow for customized solutions that improve patient satisfaction and treatment outcomes, driving the market`s expansion.
Challenges of the market
In the Austria Dental Prosthetics Market, challenges arise from the increasing demand for high-quality materials and innovative designs. Patients expect durable and aesthetically pleasing prosthetics, which can strain manufacturing processes. Additionally, regulatory compliance for materials used in prosthetics is essential, requiring manufacturers to stay updated on standards and testing requirements. The market also faces competition from alternative solutions, such as implant technology, necessitating that manufacturers differentiate their offerings to remain competitive.
Government Policy of the market
The Austrian government promotes quality and safety in the dental prosthetics market. Regulations ensure that dental prosthetics meet stringent standards for performance and safety. The government supports initiatives that encourage innovation in prosthetic materials and technologies, enhancing patient care and satisfaction.
Key Highlights of the Report:
- Austria Dental Prosthetics Market Outlook
- Market Size of Austria Dental Prosthetics Market, 2025
- Forecast of Austria Dental Prosthetics Market, 2032
- Historical Data and Forecast of Austria Dental Prosthetics Revenues & Volume for the Period 2022-2032F
- Austria Dental Prosthetics Market Trend Evolution
- Austria Dental Prosthetics Market Drivers and Challenges
- Austria Dental Prosthetics Price Trends
- Austria Dental Prosthetics Porter`s Five Forces
- Austria Dental Prosthetics Industry Life Cycle
- Historical Data and Forecast of Austria Dental Prosthetics Market Revenues & Volume By Type for the Period 2022-2032F
- Historical Data and Forecast of Austria Dental Prosthetics Market Revenues & Volume By Crowns for the Period 2022-2032F
- Historical Data and Forecast of Austria Dental Prosthetics Market Revenues & Volume By Bridges for the Period 2022-2032F
- Historical Data and Forecast of Austria Dental Prosthetics Market Revenues & Volume By Abutments for the Period 2022-2032F
- Historical Data and Forecast of Austria Dental Prosthetics Market Revenues & Volume By Dentures for the Period 2022-2032F
- Historical Data and Forecast of Austria Dental Prosthetics Market Revenues & Volume By Others for the Period 2022-2032F
- Historical Data and Forecast of Austria Dental Prosthetics Market Revenues & Volume By End-users for the Period 2022-2032F
- Historical Data and Forecast of Austria Dental Prosthetics Market Revenues & Volume By Dental Hospitals & Clinics for the Period 2022-2032F
- Historical Data and Forecast of Austria Dental Prosthetics Market Revenues & Volume By Dental Laboratories for the Period 2022-2032F
- Historical Data and Forecast of Austria Dental Prosthetics Market Revenues & Volume By Others for the Period 2022-2032F
- Austria Dental Prosthetics Import Export Trade Statistics
- Market Opportunity Assessment By Type
- Market Opportunity Assessment By End-users
- Austria Dental Prosthetics Top Companies Market Share
- Austria Dental Prosthetics Competitive Benchmarking By Technical and Operational Parameters
- Austria Dental Prosthetics Company Profiles
- Austria Dental Prosthetics Key Strategic Recommendations
Austria Dental Prosthetics Market (2026-2032): FAQs
6Wresearch actively monitors the Austria Dental Prosthetics Market and publishes its comprehensive annual report, highlighting emerging trends, growth drivers, revenue analysis, and forecast outlook. Our insights help businesses to make data-backed strategic decisions with ongoing market dynamics. Our analysts track relevent industries related to the Austria Dental Prosthetics Market, allowing our clients with actionable intelligence and reliable forecasts tailored to emerging regional needs.
Yes, we provide customisation as per your requirements. To learn more, feel free to contact us on sales@6wresearch.com
1 Executive Summary |
2 Introduction |
2.1 Key Highlights of the Report |
2.2 Report Description |
2.3 Market Scope & Segmentation |
2.4 Research Methodology |
2.5 Assumptions |
3 Austria Dental Prosthetics Market Overview |
3.1 Austria Country Macro Economic Indicators |
3.2 Austria Dental Prosthetics Market Revenues & Volume, 2022 & 2032F |
3.3 Austria Dental Prosthetics Market - Industry Life Cycle |
3.4 Austria Dental Prosthetics Market - Porter's Five Forces |
3.5 Austria Dental Prosthetics Market Revenues & Volume Share, By Type, 2022 & 2032F |
3.6 Austria Dental Prosthetics Market Revenues & Volume Share, By End-users, 2022 & 2032F |
4 Austria Dental Prosthetics Market Dynamics |
4.1 Impact Analysis |
4.2 Market Drivers |
4.2.1 Increasing prevalence of dental disorders and diseases in Austria |
4.2.2 Growing aging population leading to higher demand for dental prosthetics |
4.2.3 Technological advancements in dental prosthetics industry improving product quality and aesthetics |
4.3 Market Restraints |
4.3.1 High costs associated with dental prosthetics procedures limiting adoption rates |
4.3.2 Limited reimbursement policies for dental prosthetics affecting affordability |
4.3.3 Lack of awareness about the benefits of dental prosthetics among the population |
5 Austria Dental Prosthetics Market Trends |
6 Austria Dental Prosthetics Market Segmentations |
6.1 Austria Dental Prosthetics Market, By Type |
6.1.1 Overview and Analysis |
6.1.2 Austria Dental Prosthetics Market Revenues & Volume, By Crowns, 2022-2032F |
6.1.3 Austria Dental Prosthetics Market Revenues & Volume, By Bridges, 2022-2032F |
6.1.4 Austria Dental Prosthetics Market Revenues & Volume, By Abutments, 2022-2032F |
6.1.5 Austria Dental Prosthetics Market Revenues & Volume, By Dentures, 2022-2032F |
6.1.6 Austria Dental Prosthetics Market Revenues & Volume, By Others, 2022-2032F |
6.2 Austria Dental Prosthetics Market, By End-users |
6.2.1 Overview and Analysis |
6.2.2 Austria Dental Prosthetics Market Revenues & Volume, By Dental Hospitals & Clinics, 2022-2032F |
6.2.3 Austria Dental Prosthetics Market Revenues & Volume, By Dental Laboratories, 2022-2032F |
6.2.4 Austria Dental Prosthetics Market Revenues & Volume, By Others, 2022-2032F |
7 Austria Dental Prosthetics Market Import-Export Trade Statistics |
7.1 Austria Dental Prosthetics Market Export to Major Countries |
7.2 Austria Dental Prosthetics Market Imports from Major Countries |
8 Austria Dental Prosthetics Market Key Performance Indicators |
8.1 Average waiting time for dental prosthetics procedures |
8.2 Number of dental clinics offering advanced prosthetic services |
8.3 Patient satisfaction rates with dental prosthetics services |
8.4 Percentage of population aged 65 and above receiving dental prosthetics |
8.5 Adoption rate of digital technologies in dental prosthetics manufacturing |
9 Austria Dental Prosthetics Market - Opportunity Assessment |
9.1 Austria Dental Prosthetics Market Opportunity Assessment, By Type, 2022 & 2032F |
9.2 Austria Dental Prosthetics Market Opportunity Assessment, By End-users, 2022 & 2032F |
10 Austria Dental Prosthetics Market - Competitive Landscape |
10.1 Austria Dental Prosthetics Market Revenue Share, By Companies, 2025 |
10.2 Austria Dental Prosthetics Market Competitive Benchmarking, By Operating and Technical Parameters |
11 Company Profiles |
12 Recommendations | 13 Disclaimer |
Global Go To Market Strategy - 2030
Export potential enables firms to identify high-growth global markets with greater confidence by combining advanced trade intelligence with a structured quantitative methodology. The framework analyzes emerging demand trends and country-level import patterns while integrating macroeconomic and trade datasets such as GDP and population forecasts, bilateral import–export flows, tariff structures, elasticity differentials between developed and developing economies, geographic distance, and import demand projections. Using weighted trade values from 2020–2024 as the base period to project country-to-country export potential for 2030, these inputs are operationalized through calculated drivers such as gravity model parameters, tariff impact factors, and projected GDP per-capita growth. Through an analysis of hidden potentials, demand hotspots, and market conditions that are most favorable to success, this method enables firms to focus on target countries, maximize returns, and global expansion with data, backed by accuracy.
By factoring in the projected importer demand gap that is currently unmet and could be potential opportunity, it identifies the potential for the Exporter (Country) among 190 countries, against the general trade analysis, which identifies the biggest importer or exporter.
To discover high-growth global markets and optimize your business strategy:
Click Here
Pricing
- Single User License$ 1,995
- Department License$ 2,400
- Site License$ 3,120
- Global License$ 3,795

Leadership Perspectives from Industry Events
Search
Thought Leadership and Analyst Meet


Our Clients
6WResearch In News
- India Export Attractiveness Tracker 2026
- India Air Conditioner Market Set for Strong Rebound in 2026 After Weather-Led Correction and GST-Driven Recovery: 6Wresearch
- ADAS in India: How Automatic Emergency Braking, Blind Spot Detection & Driver Monitoring are Transforming Road Safety
- Doha a strategic location for EV manufacturing hub: IPA Qatar
- Demand for luxury TVs surging in the GCC, says Samsung
- Empowering Growth: The Thriving Journey of Bangladesh’s Cable Industry
Latest Reports
- Nicaragua RPG Gaming Market (2026-2032)
- New Zealand RPG Gaming Market (2026-2032)
- Netherlands RPG Gaming Market (2026-2032)
- Nauru RPG Gaming Market (2026-2032)
- Namibia RPG Gaming Market (2026-2032)
- Mozambique RPG Gaming Market (2026-2032)
- Montenegro RPG Gaming Market (2026-2032)
- Mongolia RPG Gaming Market (2026-2032)
- Monaco RPG Gaming Market (2026-2032)
- Micronesia RPG Gaming Market (2026-2032)
Industry Events and Analyst Meet

EV India Expo 2026

HIMTEX 2026

India Refining Summit 2026

India EV Show 2026

EV tech India Expo 2026
Whitepaper
- Middle East & Africa Commercial Security Market Click here to view more.
- Middle East & Africa Fire Safety Systems & Equipment Market Click here to view more.
- GCC Drone Market Click here to view more.
- Middle East Lighting Fixture Market Click here to view more.
- GCC Physical & Perimeter Security Market Click here to view more.