Austria Photo Album Market (2026-2032) | Size, Forecast, Analysis, Growth, Revenue, Segmentation, Industry, Share, Companies, Value, Trends & Outlook
Market Forecast By Product Type (Matted, Flush Mount, Gift), By Size (4‚
| Product Code: ETC5301911 | Publication Date: Nov 2023 | Updated Date: Apr 2026 | Product Type: Market Research Report | |
| Publisher: 6Wresearch | Author: Ravi Bhandari | No. of Pages: 60 | No. of Figures: 30 | No. of Tables: 5 |
Austria Photo Album Market Size (2020-2030)
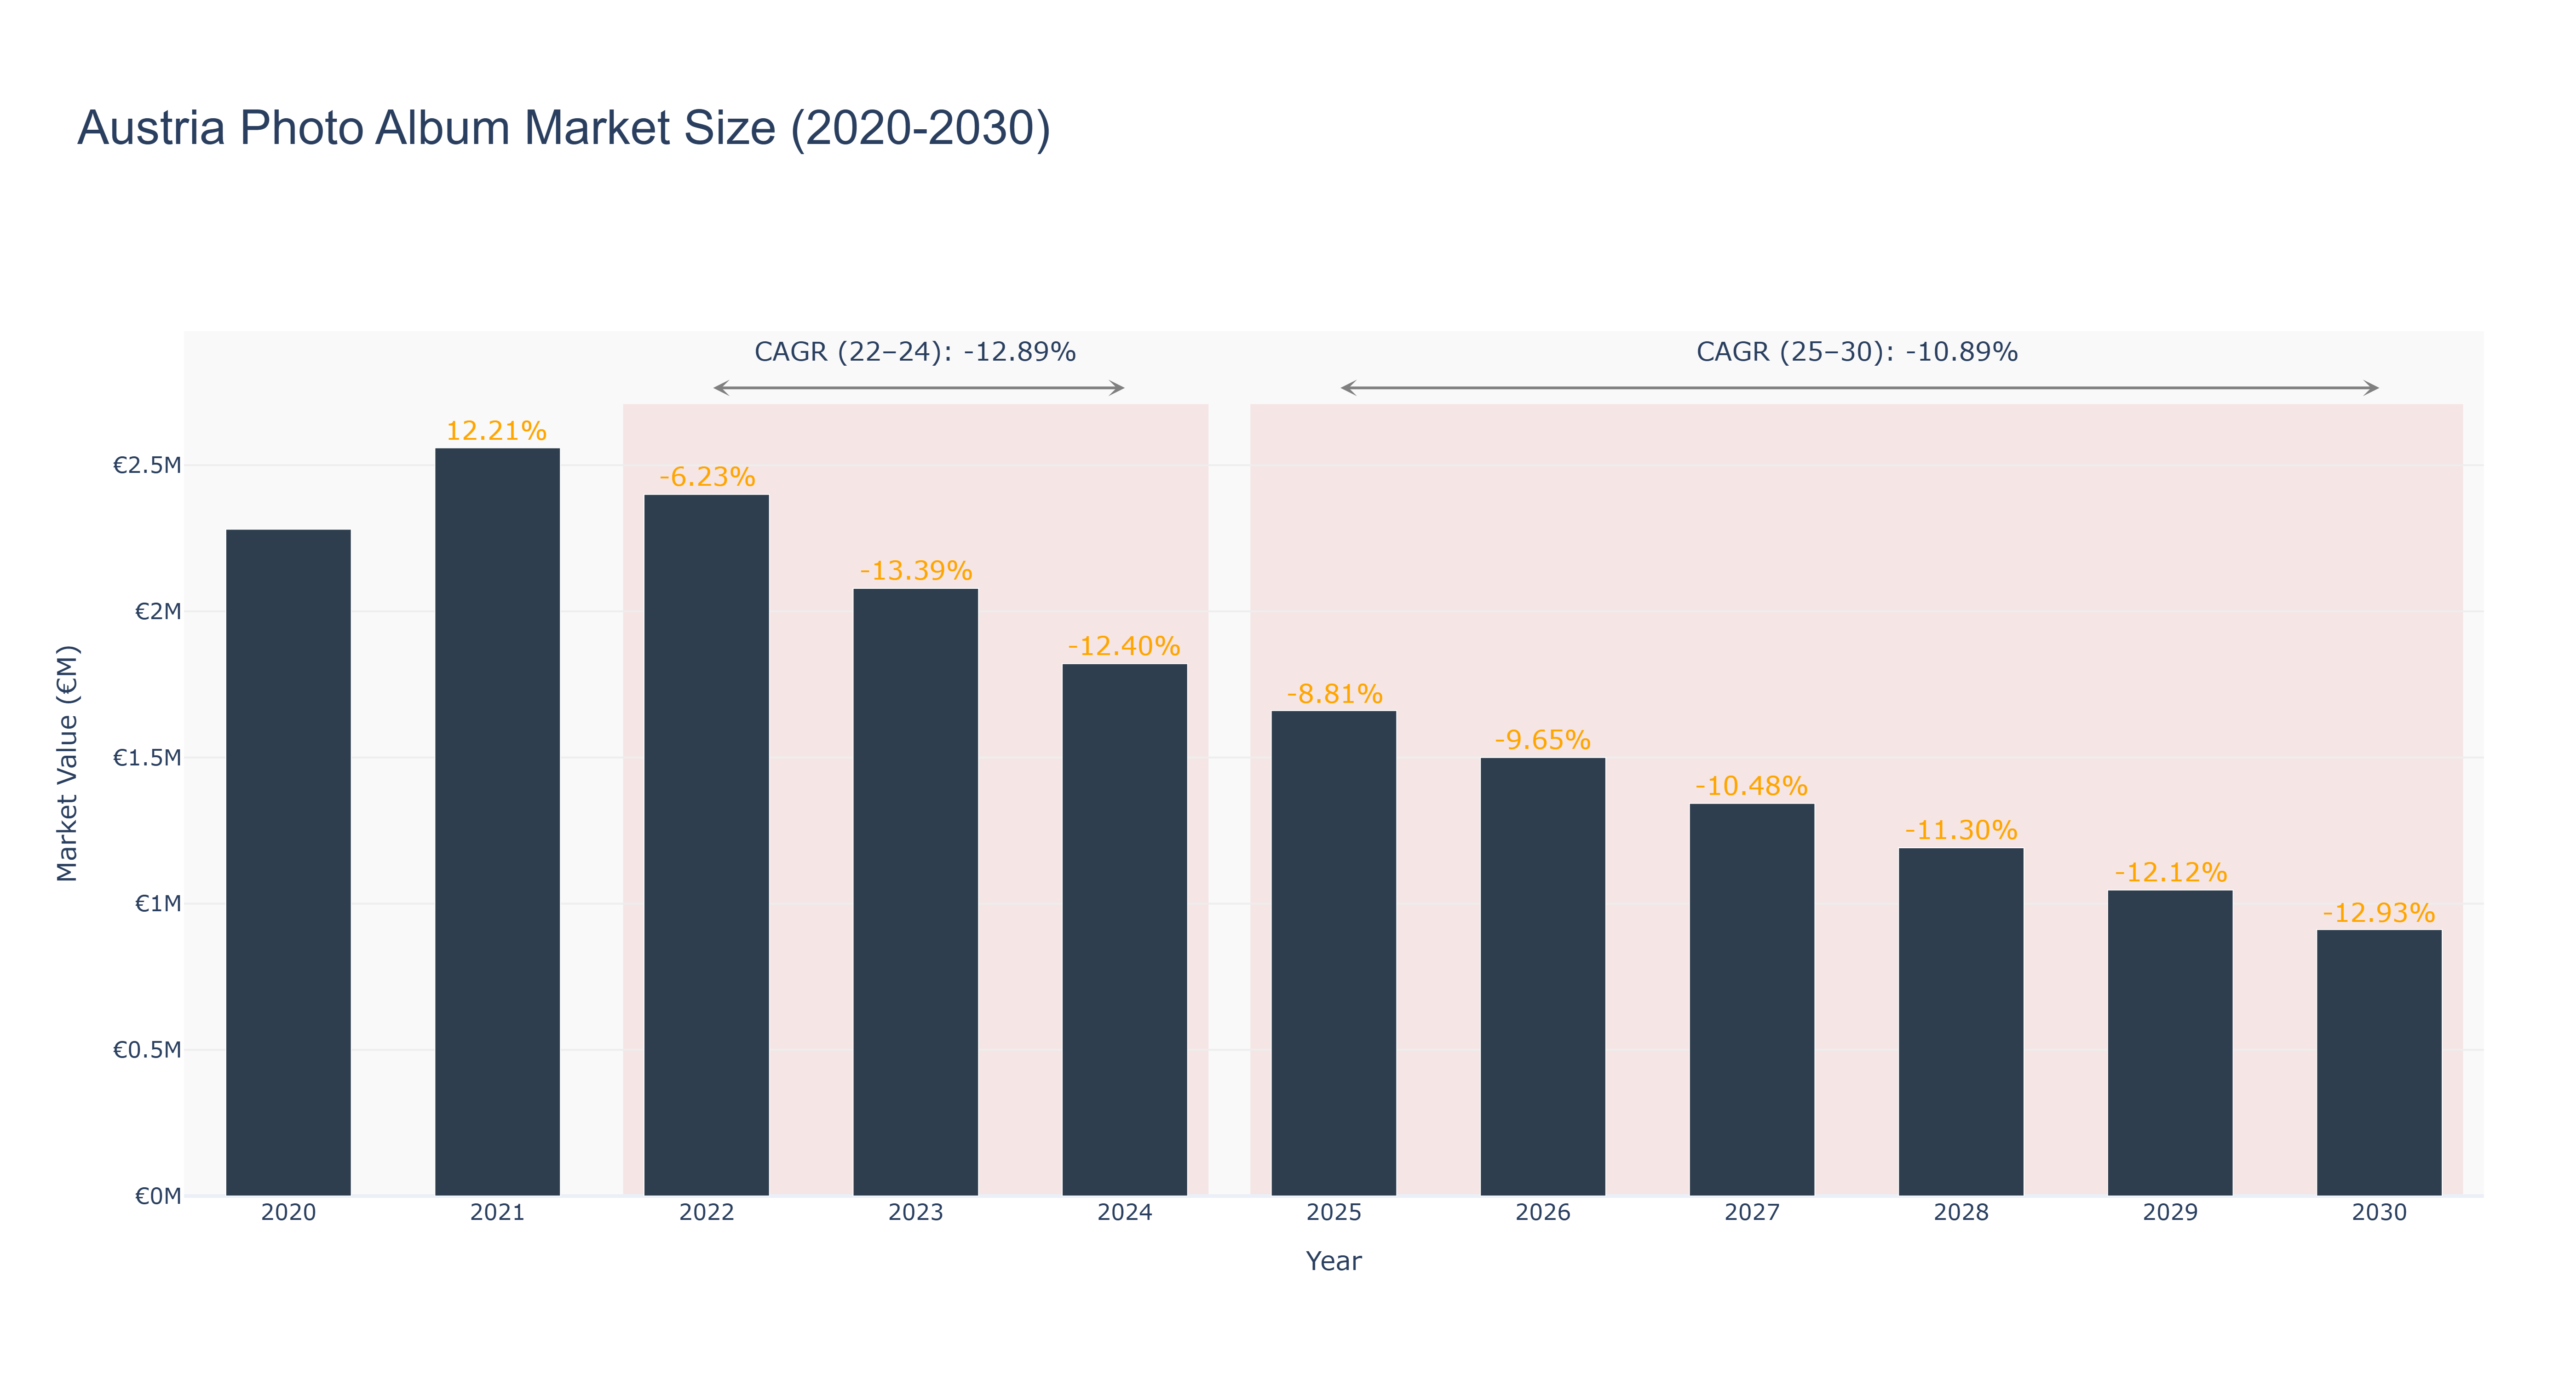
The Austria Photo Album Market experienced its peak in 2021, reaching a market size of €2.56 million, followed by a notable decline to €2.08 million in 2023, reflecting an actual CAGR of -12.89% from 2022 to 2024. This downturn can be attributed to the increasing digitization of photo storage and sharing, which has shifted consumer preferences away from physical albums. Looking ahead, the forecasted period from 2025 to 2030 anticipates a continued contraction, with projected market sizes decreasing from €1.66 million in 2025 to €911.54 thousand by 2030, indicating a CAGR of -10.89%. As consumers increasingly favor digital solutions and social media platforms for photo management, the traditional photo album market is likely to face further challenges. The industry's future will hinge on adapting to these digital trends or innovating new products that integrate physical and digital experiences.
Austria Photo Album Market: Production & Trade Performance (2019-2025)
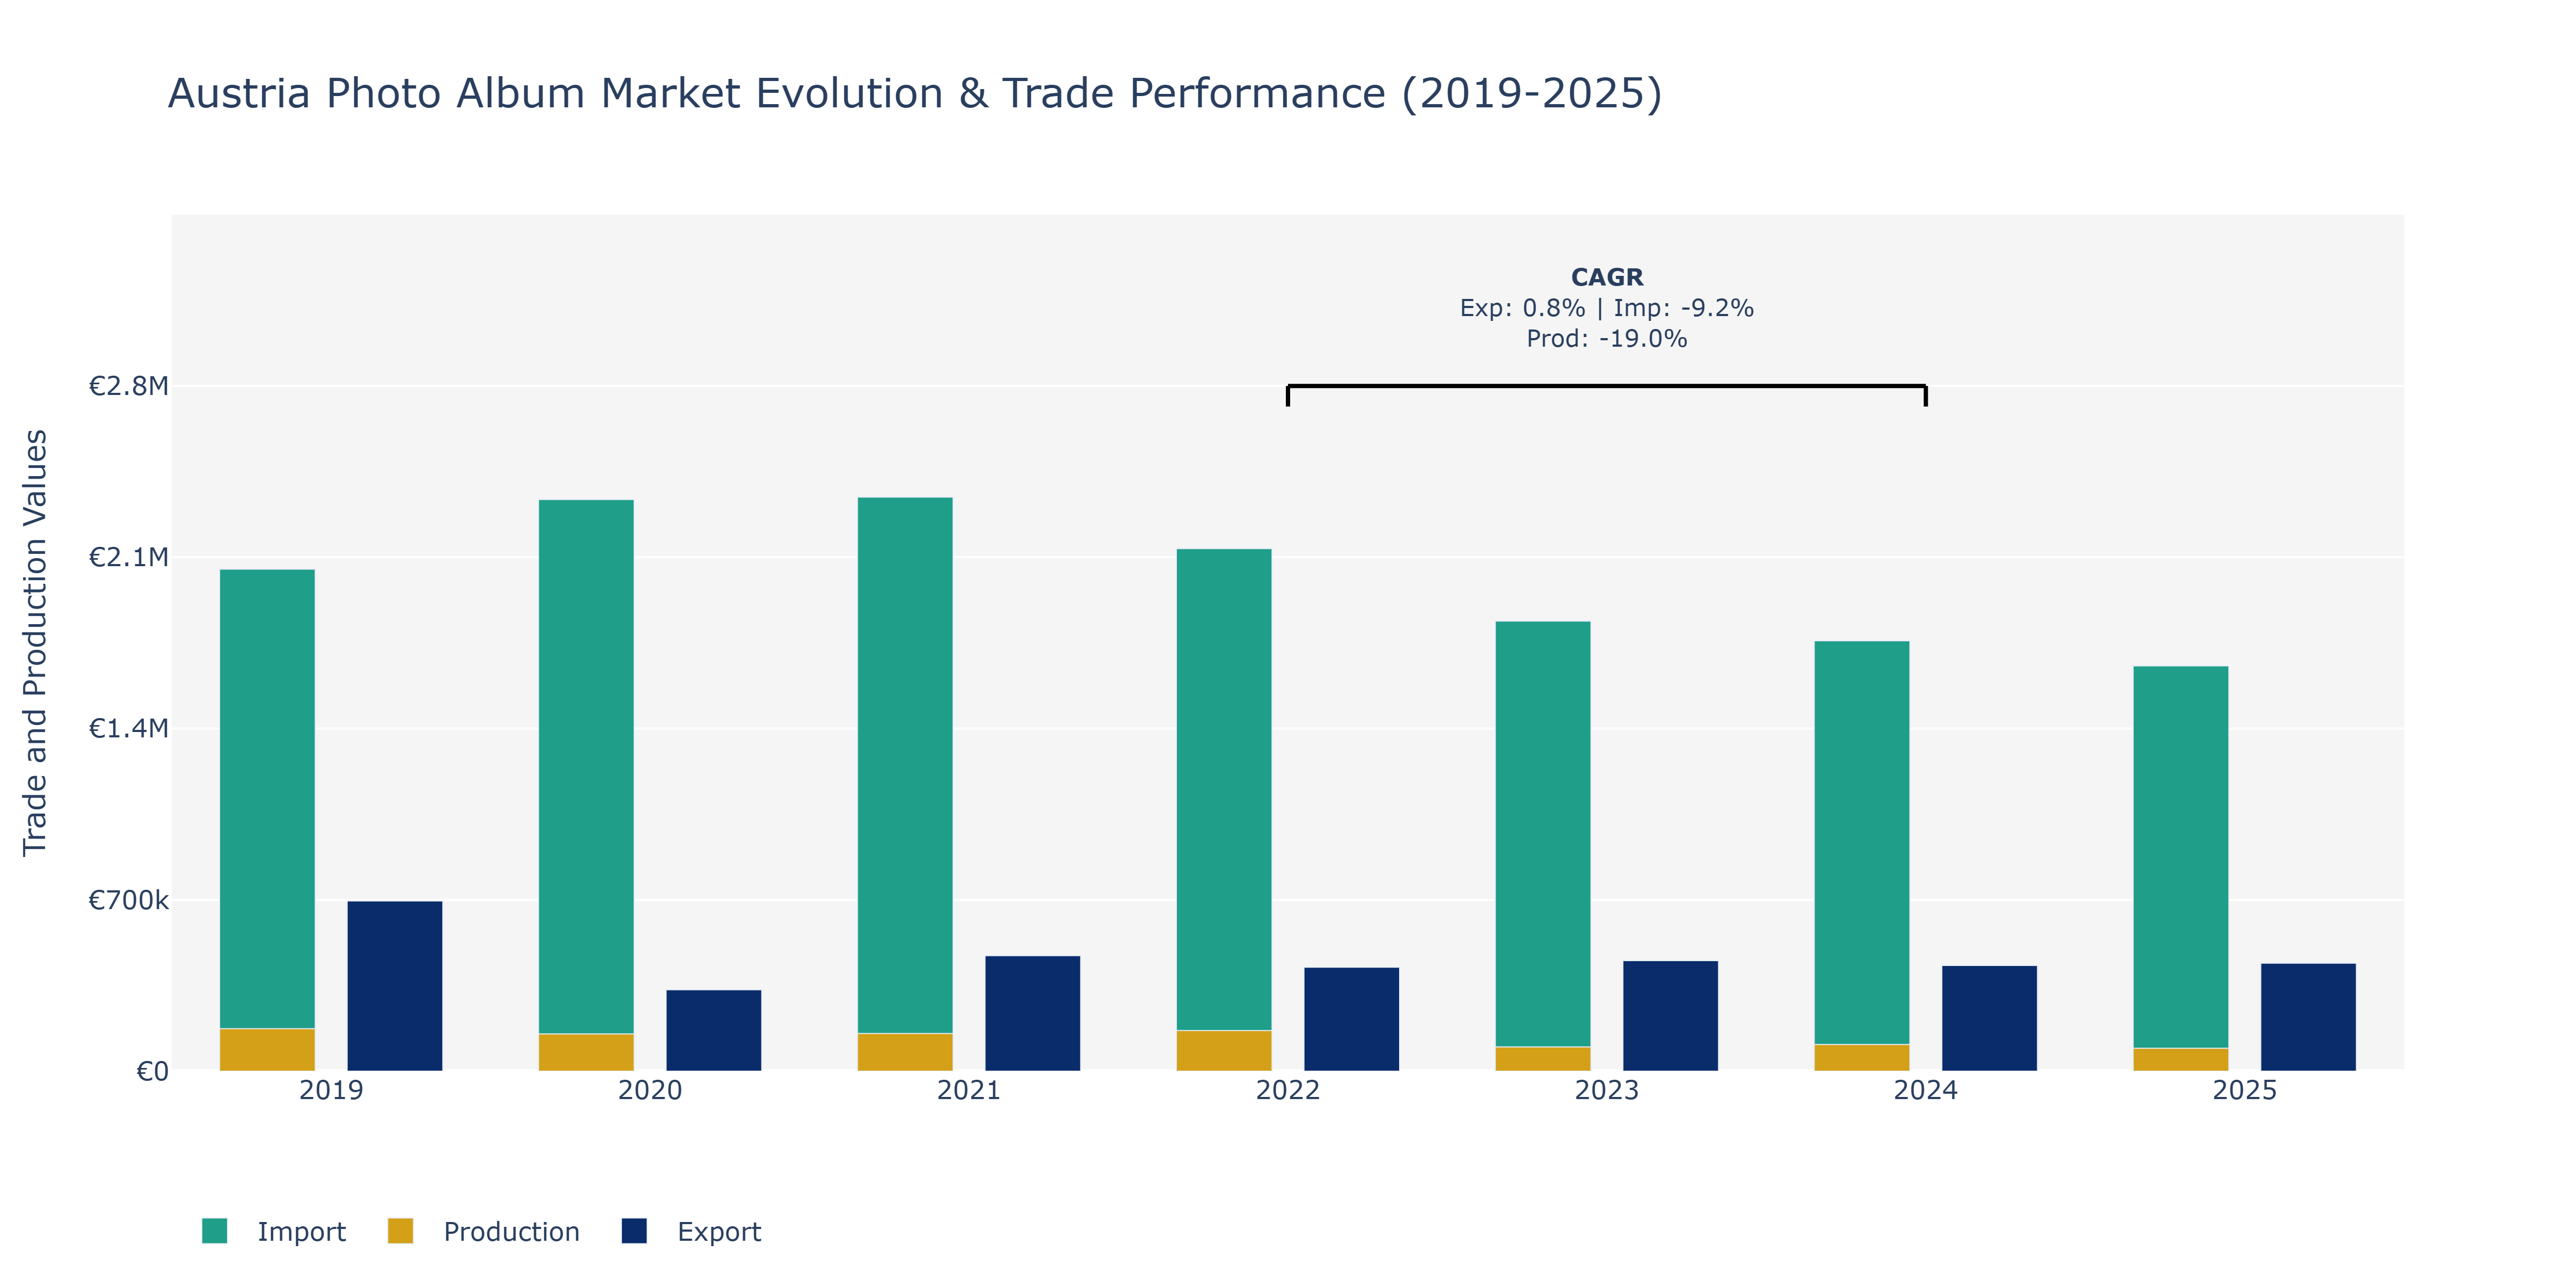
In the Austria Photo Album Market, exports exhibited a fluctuating trend over the years, with a peak in 2019 at €695.81 thousand, followed by a decline in 2020 to €332.78 thousand. However, there was a subsequent increase in 2021 to €471.89 thousand, showcasing a recovery. Imports, on the other hand, remained relatively stable from 2019 to 2021 before decreasing in 2022 and further dropping in the following years. Production numbers saw a decline from 2019 to 2021 before experiencing a slight increase in 2022, only to drop again in 2023 and 2024. These fluctuations can be attributed to various factors such as changing consumer preferences, global economic conditions, and technological advancements impacting the market landscape. The decrease in imports could be linked to shifts in supply chain dynamics or changes in import regulations, while production fluctuations may reflect adjustments in manufacturing processes or cost considerations.
Key Highlights of the Report:
- Austria Photo Album Market Outlook
- Market Size of Austria Photo Album Market, 2025
- Forecast of Austria Photo Album Market, 2032
- Historical Data and Forecast of Austria Photo Album Revenues & Volume for the Period 2022-2032F
- Austria Photo Album Market Trend Evolution
- Austria Photo Album Market Drivers and Challenges
- Austria Photo Album Price Trends
- Austria Photo Album Porter`s Five Forces
- Austria Photo Album Industry Life Cycle
- Historical Data and Forecast of Austria Photo Album Market Revenues & Volume By Product Type for the Period 2022-2032F
- Historical Data and Forecast of Austria Photo Album Market Revenues & Volume By Matted for the Period 2022-2032F
- Historical Data and Forecast of Austria Photo Album Market Revenues & Volume By Flush Mount for the Period 2022-2032F
- Historical Data and Forecast of Austria Photo Album Market Revenues & Volume By Gift for the Period 2022-2032F
- Historical Data and Forecast of Austria Photo Album Market Revenues & Volume By Size for the Period 2022-2032F
- Historical Data and Forecast of Austria Photo Album Market Revenues & Volume By 4?
- Historical Data and Forecast of Austria Photo Album Market Revenues & Volume By 5?
- Historical Data and Forecast of Austria Photo Album Market Revenues & Volume By 8?
- Historical Data and Forecast of Austria Photo Album Market Revenues & Volume By End-User for the Period 2022-2032F
- Historical Data and Forecast of Austria Photo Album Market Revenues & Volume By Personal for the Period 2022-2032F
- Historical Data and Forecast of Austria Photo Album Market Revenues & Volume By Professional for the Period 2022-2032F
- Austria Photo Album Import Export Trade Statistics
- Market Opportunity Assessment By Product Type
- Market Opportunity Assessment By Size
- Market Opportunity Assessment By End-User
- Austria Photo Album Top Companies Market Share
- Austria Photo Album Competitive Benchmarking By Technical and Operational Parameters
- Austria Photo Album Company Profiles
- Austria Photo Album Key Strategic Recommendations
Frequently Asked Questions About the Market Study (FAQs):
6Wresearch actively monitors the Austria Photo Album Market and publishes its comprehensive annual report, highlighting emerging trends, growth drivers, revenue analysis, and forecast outlook. Our insights help businesses to make data-backed strategic decisions with ongoing market dynamics. Our analysts track relevent industries related to the Austria Photo Album Market, allowing our clients with actionable intelligence and reliable forecasts tailored to emerging regional needs.
Yes, we provide customisation as per your requirements. To learn more, feel free to contact us on sales@6wresearch.com
1 Executive Summary |
2 Introduction |
2.1 Key Highlights of the Report |
2.2 Report Description |
2.3 Market Scope & Segmentation |
2.4 Research Methodology |
2.5 Assumptions |
3 Austria Photo Album Market Overview |
3.1 Austria Country Macro Economic Indicators |
3.2 Austria Photo Album Market Revenues & Volume, 2022 & 2032F |
3.3 Austria Photo Album Market - Industry Life Cycle |
3.4 Austria Photo Album Market - Porter's Five Forces |
3.5 Austria Photo Album Market Revenues & Volume Share, By Product Type, 2022 & 2032F |
3.6 Austria Photo Album Market Revenues & Volume Share, By Size, 2022 & 2032F |
3.7 Austria Photo Album Market Revenues & Volume Share, By End-User, 2022 & 2032F |
4 Austria Photo Album Market Dynamics |
4.1 Impact Analysis |
4.2 Market Drivers |
4.2.1 Increasing demand for personalized and customized photo albums |
4.2.2 Growing trend of preserving memories and nostalgia through physical photo albums |
4.2.3 Rise in disposable income leading to higher spending on luxury photo albums |
4.3 Market Restraints |
4.3.1 Competition from digital photo albums and online photo sharing platforms |
4.3.2 Fluctuations in raw material prices affecting production costs |
4.3.3 Changing consumer preferences towards digital storage over physical photo albums |
5 Austria Photo Album Market Trends |
6 Austria Photo Album Market Segmentations |
6.1 Austria Photo Album Market, By Product Type |
6.1.1 Overview and Analysis |
6.1.2 Austria Photo Album Market Revenues & Volume, By Matted, 2022-2032F |
6.1.3 Austria Photo Album Market Revenues & Volume, By Flush Mount, 2022-2032F |
6.1.4 Austria Photo Album Market Revenues & Volume, By Gift, 2022-2032F |
6.2 Austria Photo Album Market, By Size |
6.2.1 Overview and Analysis |
6.2.2 Austria Photo Album Market Revenues & Volume, By 4? |
6.2.3 Austria Photo Album Market Revenues & Volume, By 5? |
6.2.4 Austria Photo Album Market Revenues & Volume, By 8? |
6.3 Austria Photo Album Market, By End-User |
6.3.1 Overview and Analysis |
6.3.2 Austria Photo Album Market Revenues & Volume, By Personal, 2022-2032F |
6.3.3 Austria Photo Album Market Revenues & Volume, By Professional, 2022-2032F |
7 Austria Photo Album Market Import-Export Trade Statistics |
7.1 Austria Photo Album Market Export to Major Countries |
7.2 Austria Photo Album Market Imports from Major Countries |
8 Austria Photo Album Market Key Performance Indicators |
8.1 Average order value (AOV) for photo albums |
8.2 Customer retention rate for repeat purchases |
8.3 Number of new product launches and innovations in the market |
8.4 Customer satisfaction score for photo album products |
8.5 Adoption rate of new technology in photo album production and customization |
9 Austria Photo Album Market - Opportunity Assessment |
9.1 Austria Photo Album Market Opportunity Assessment, By Product Type, 2022 & 2032F |
9.2 Austria Photo Album Market Opportunity Assessment, By Size, 2022 & 2032F |
9.3 Austria Photo Album Market Opportunity Assessment, By End-User, 2022 & 2032F |
10 Austria Photo Album Market - Competitive Landscape |
10.1 Austria Photo Album Market Revenue Share, By Companies, 2025 |
10.2 Austria Photo Album Market Competitive Benchmarking, By Operating and Technical Parameters |
11 Company Profiles |
12 Recommendations | 13 Disclaimer |
Global Go To Market Strategy - 2030
Export potential enables firms to identify high-growth global markets with greater confidence by combining advanced trade intelligence with a structured quantitative methodology. The framework analyzes emerging demand trends and country-level import patterns while integrating macroeconomic and trade datasets such as GDP and population forecasts, bilateral import–export flows, tariff structures, elasticity differentials between developed and developing economies, geographic distance, and import demand projections. Using weighted trade values from 2020–2024 as the base period to project country-to-country export potential for 2030, these inputs are operationalized through calculated drivers such as gravity model parameters, tariff impact factors, and projected GDP per-capita growth. Through an analysis of hidden potentials, demand hotspots, and market conditions that are most favorable to success, this method enables firms to focus on target countries, maximize returns, and global expansion with data, backed by accuracy.
By factoring in the projected importer demand gap that is currently unmet and could be potential opportunity, it identifies the potential for the Exporter (Country) among 190 countries, against the general trade analysis, which identifies the biggest importer or exporter.
To discover high-growth global markets and optimize your business strategy:
Click Here
Pricing
- Single User License$ 1,995
- Department License$ 2,400
- Site License$ 3,120
- Global License$ 3,795

Leadership Perspectives from Industry Events
Search
Thought Leadership and Analyst Meet


Our Clients
6WResearch In News
- India Export Attractiveness Tracker 2026
- India Air Conditioner Market Set for Strong Rebound in 2026 After Weather-Led Correction and GST-Driven Recovery: 6Wresearch
- ADAS in India: How Automatic Emergency Braking, Blind Spot Detection & Driver Monitoring are Transforming Road Safety
- Doha a strategic location for EV manufacturing hub: IPA Qatar
- Demand for luxury TVs surging in the GCC, says Samsung
- Empowering Growth: The Thriving Journey of Bangladesh’s Cable Industry
Latest Reports
- Nicaragua RPG Gaming Market (2026-2032)
- New Zealand RPG Gaming Market (2026-2032)
- Netherlands RPG Gaming Market (2026-2032)
- Nauru RPG Gaming Market (2026-2032)
- Namibia RPG Gaming Market (2026-2032)
- Mozambique RPG Gaming Market (2026-2032)
- Montenegro RPG Gaming Market (2026-2032)
- Mongolia RPG Gaming Market (2026-2032)
- Monaco RPG Gaming Market (2026-2032)
- Micronesia RPG Gaming Market (2026-2032)
Industry Events and Analyst Meet

EV India Expo 2026

HIMTEX 2026

India Refining Summit 2026

India EV Show 2026

EV tech India Expo 2026
Whitepaper
- Middle East & Africa Commercial Security Market Click here to view more.
- Middle East & Africa Fire Safety Systems & Equipment Market Click here to view more.
- GCC Drone Market Click here to view more.
- Middle East Lighting Fixture Market Click here to view more.
- GCC Physical & Perimeter Security Market Click here to view more.