Bahamas Portable Filtration Systems Market (2026-2032) | Revenue, Companies, Share, Trends, Value, Outlook, Industry, Analysis, Segmentation, Growth, Forecast & Size
Market Forecast By End-User (Power Generation, Manufacturing, Oil & Gas), By Flow Rate (0‚œ10, >10‚œ20, >20‚œ60, >60‚œ100, Above 100 GPM), By Technology (Pressure, Centrifugal, Vacuum Filtration) And Competitive Landscape
| Product Code: ETC5776171 | Publication Date: Nov 2023 | Updated Date: Mar 2026 | Product Type: Market Research Report | |
| Publisher: 6Wresearch | Author: Sumit Sagar | No. of Pages: 60 | No. of Figures: 30 | No. of Tables: 5 |
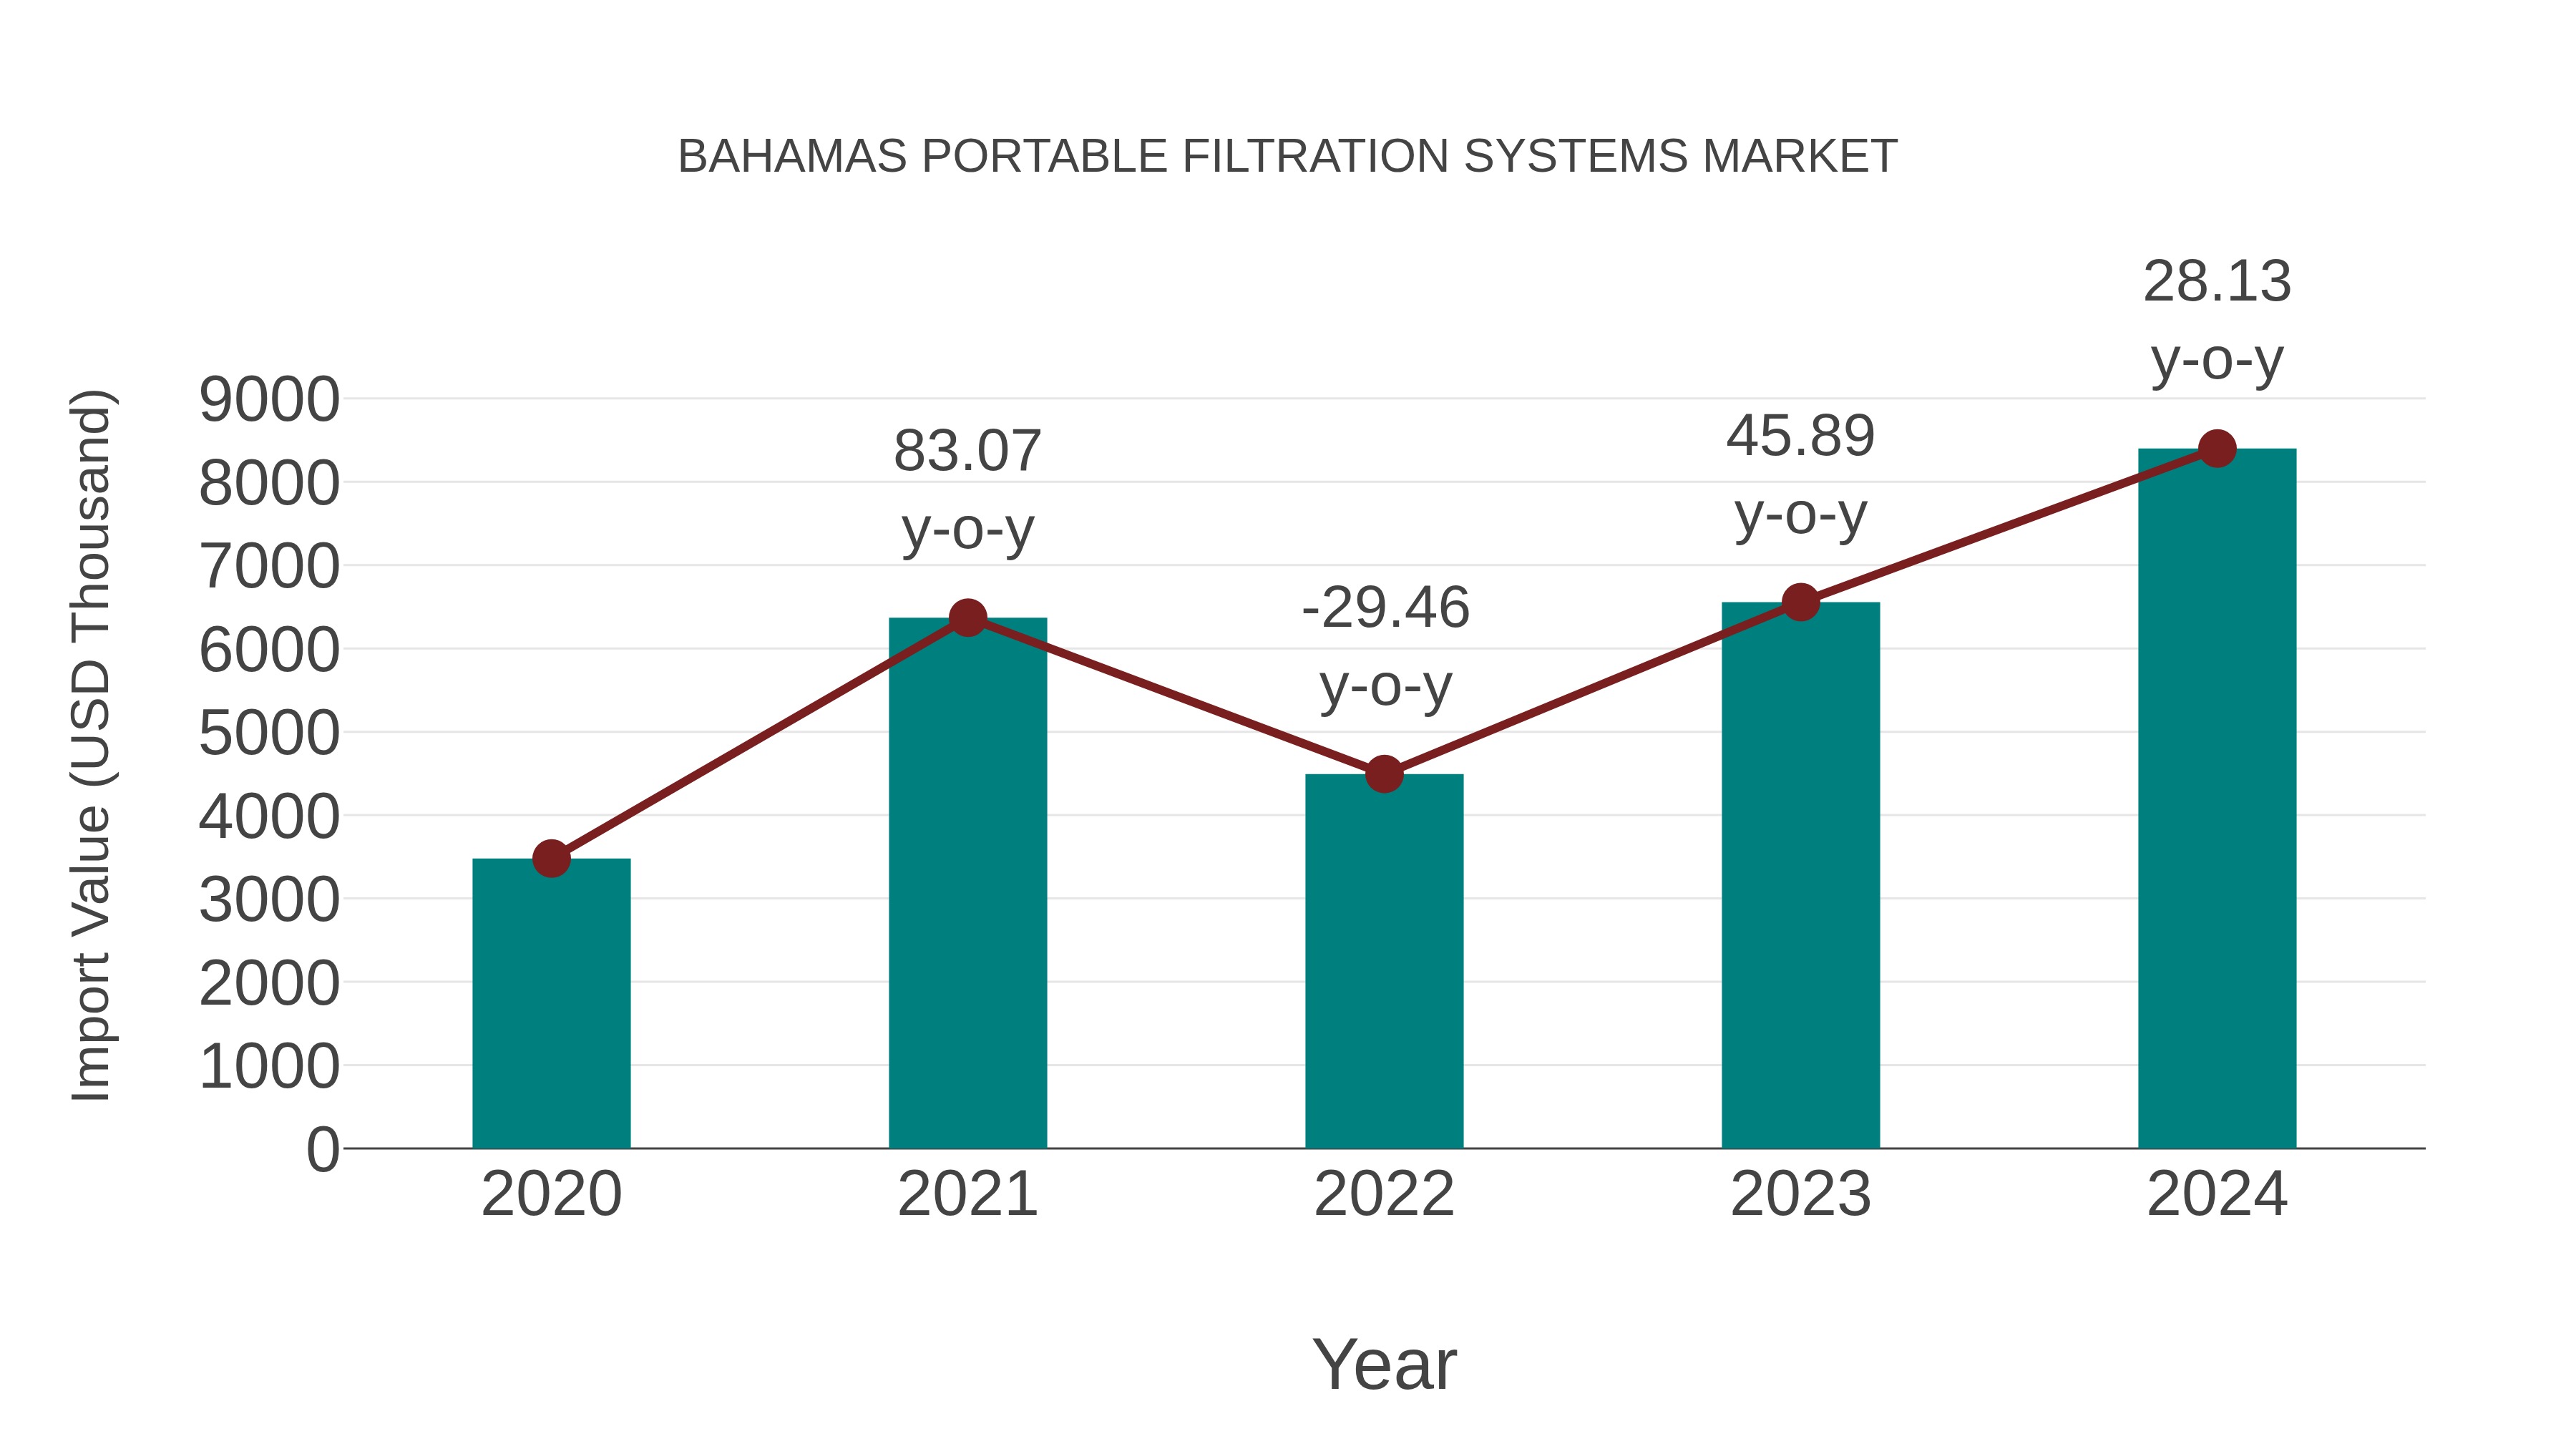
Bahamas Portable Filtration Systems Market: Import Trend Analysis
The Bahamas portable filtration systems market experienced a significant increase in imports from 2020 to 2024. The compound annual growth rate (CAGR) of 24.65% during this period, along with a year-on-year growth rate of 28.13% in 2023-2024, contributed to this upward trend.
Bahamas Portable Filtration Systems Market Overview
Portable filtration systems are becoming increasingly important in the Bahamas, especially in light of concerns over water quality and accessibility. These systems cater to both residential and commercial needs, providing efficient solutions for water purification. The market is expected to grow as more consumers seek reliable and portable filtration options.
Drivers of the market
The growing awareness of water quality and the need for portable filtration systems are key drivers in the Bahamas. As consumers and businesses prioritize safe drinking water, the demand for efficient and easy-to-use filtration solutions is rising, contributing to market growth.
Challenges of the market
In the portable filtration systems market, challenges include competition from established brands and the need for rigorous quality standards. As consumer awareness of water quality issues increases, manufacturers must invest in marketing and education to build trust and brand loyalty. Additionally, fluctuating material costs can affect pricing strategies and profitability.
Government Policy of the market
Government policies for portable filtration systems focus on improving access to clean water. The government promotes innovation in filtration technologies and offers financial support for local manufacturers. Initiatives aim to raise awareness of water quality issues and encourage the adoption of portable filtration solutions.
Key Highlights of the Report:
- Bahamas Portable Filtration Systems Market Outlook
- Market Size of Bahamas Portable Filtration Systems Market, 2025
- Forecast of Bahamas Portable Filtration Systems Market, 2032
- Historical Data and Forecast of Bahamas Portable Filtration Systems Revenues & Volume for the Period 2022-2032F
- Bahamas Portable Filtration Systems Market Trend Evolution
- Bahamas Portable Filtration Systems Market Drivers and Challenges
- Bahamas Portable Filtration Systems Price Trends
- Bahamas Portable Filtration Systems Porter`s Five Forces
- Bahamas Portable Filtration Systems Industry Life Cycle
- Historical Data and Forecast of Bahamas Portable Filtration Systems Market Revenues & Volume By End-User for the Period 2022-2032F
- Historical Data and Forecast of Bahamas Portable Filtration Systems Market Revenues & Volume By Power Generation for the Period 2022-2032F
- Historical Data and Forecast of Bahamas Portable Filtration Systems Market Revenues & Volume By Manufacturing for the Period 2022-2032F
- Historical Data and Forecast of Bahamas Portable Filtration Systems Market Revenues & Volume By Oil & Gas for the Period 2022-2032F
- Historical Data and Forecast of Bahamas Portable Filtration Systems Market Revenues & Volume By Flow Rate for the Period 2022-2032F
- Historical Data and Forecast of Bahamas Portable Filtration Systems Market Revenues & Volume By 0???10 for the Period 2022-2032F
- Historical Data and Forecast of Bahamas Portable Filtration Systems Market Revenues & Volume By >10???20 for the Period 2022-2032F
- Historical Data and Forecast of Bahamas Portable Filtration Systems Market Revenues & Volume By >20???60 for the Period 2022-2032F
- Historical Data and Forecast of Bahamas Portable Filtration Systems Market Revenues & Volume By >60???100 for the Period 2022-2032F
- Historical Data and Forecast of Bahamas Portable Filtration Systems Market Revenues & Volume By Above 100 GPM for the Period 2022-2032F
- Historical Data and Forecast of Bahamas Portable Filtration Systems Market Revenues & Volume By Technology for the Period 2022-2032F
- Historical Data and Forecast of Bahamas Portable Filtration Systems Market Revenues & Volume By Pressure for the Period 2022-2032F
- Historical Data and Forecast of Bahamas Portable Filtration Systems Market Revenues & Volume By Centrifugal for the Period 2022-2032F
- Historical Data and Forecast of Bahamas Portable Filtration Systems Market Revenues & Volume By Vacuum Filtration for the Period 2022-2032F
- Bahamas Portable Filtration Systems Import Export Trade Statistics
- Market Opportunity Assessment By End-User
- Market Opportunity Assessment By Flow Rate
- Market Opportunity Assessment By Technology
- Bahamas Portable Filtration Systems Top Companies Market Share
- Bahamas Portable Filtration Systems Competitive Benchmarking By Technical and Operational Parameters
- Bahamas Portable Filtration Systems Company Profiles
- Bahamas Portable Filtration Systems Key Strategic Recommendations
Bahamas Portable Filtration Systems Market (2026-2032): FAQs
6Wresearch actively monitors the Bahamas Portable Filtration Systems Market and publishes its comprehensive annual report, highlighting emerging trends, growth drivers, revenue analysis, and forecast outlook. Our insights help businesses to make data-backed strategic decisions with ongoing market dynamics. Our analysts track relevent industries related to the Bahamas Portable Filtration Systems Market, allowing our clients with actionable intelligence and reliable forecasts tailored to emerging regional needs.
Yes, we provide customisation as per your requirements. To learn more, feel free to contact us on sales@6wresearch.com
1 Executive Summary |
2 Introduction |
2.1 Key Highlights of the Report |
2.2 Report Description |
2.3 Market Scope & Segmentation |
2.4 Research Methodology |
2.5 Assumptions | 3 Bahamas Portable Filtration Systems Market Overview |
3.1 Bahamas Country Macro Economic Indicators | 3.2 Bahamas Portable Filtration Systems Market Revenues & Volume, 2022 & 2032F | 3.3 Bahamas Portable Filtration Systems Market - Industry Life Cycle | 3.4 Bahamas Portable Filtration Systems Market - Porter's Five Forces | 3.5 Bahamas Portable Filtration Systems Market Revenues & Volume Share, By End-User, 2022 & 2032F | 3.6 Bahamas Portable Filtration Systems Market Revenues & Volume Share, By Flow Rate, 2022 & 2032F | 3.7 Bahamas Portable Filtration Systems Market Revenues & Volume Share, By Technology, 2022 & 2032F | 4 Bahamas Portable Filtration Systems Market Dynamics |
4.1 Impact Analysis |
4.2 Market Drivers |
4.2.1 Increasing awareness about the importance of clean water for health and safety |
4.2.2 Growing demand for portable filtration systems for outdoor activities and emergencies |
4.2.3 Government initiatives promoting water purification technologies in the Bahamas |
4.3 Market Restraints |
4.3.1 High initial costs of portable filtration systems |
4.3.2 Limited access to clean water sources impacting the need for portable filtration systems |
4.3.3 Lack of consumer knowledge about the different types and benefits of portable filtration systems | 5 Bahamas Portable Filtration Systems Market Trends | 6 Bahamas Portable Filtration Systems Market, By Types | 6.1 Bahamas Portable Filtration Systems Market, By End-User |
6.1.1 Overview and Analysis | 6.1.2 Bahamas Portable Filtration Systems Market Revenues & Volume, By End-User, 2022-2032F | 6.1.3 Bahamas Portable Filtration Systems Market Revenues & Volume, By Power Generation, 2022-2032F | 6.1.4 Bahamas Portable Filtration Systems Market Revenues & Volume, By Manufacturing, 2022-2032F | 6.1.5 Bahamas Portable Filtration Systems Market Revenues & Volume, By Oil & Gas, 2022-2032F | 6.2 Bahamas Portable Filtration Systems Market, By Flow Rate |
6.2.1 Overview and Analysis | 6.2.2 Bahamas Portable Filtration Systems Market Revenues & Volume, By 0? ??10, 2022-2032F | 6.2.3 Bahamas Portable Filtration Systems Market Revenues & Volume, By >10? ??20, 2022-2032F | 6.2.4 Bahamas Portable Filtration Systems Market Revenues & Volume, By >20? ??60, 2022-2032F | 6.2.5 Bahamas Portable Filtration Systems Market Revenues & Volume, By >60? ??100, 2022-2032F | 6.2.6 Bahamas Portable Filtration Systems Market Revenues & Volume, By Above 100 GPM, 2022-2032F | 6.3 Bahamas Portable Filtration Systems Market, By Technology |
6.3.1 Overview and Analysis | 6.3.2 Bahamas Portable Filtration Systems Market Revenues & Volume, By Pressure, 2022-2032F | 6.3.3 Bahamas Portable Filtration Systems Market Revenues & Volume, By Centrifugal, 2022-2032F | 6.3.4 Bahamas Portable Filtration Systems Market Revenues & Volume, By Vacuum Filtration, 2022-2032F | 7 Bahamas Portable Filtration Systems Market Import-Export Trade Statistics | 7.1 Bahamas Portable Filtration Systems Market Export to Major Countries | 7.2 Bahamas Portable Filtration Systems Market Imports from Major Countries | 8 Bahamas Portable Filtration Systems Market Key Performance Indicators | 9 Bahamas Portable Filtration Systems Market - Opportunity Assessment | 9.1 Bahamas Portable Filtration Systems Market Opportunity Assessment, By End-User, 2022 & 2032F | 9.2 Bahamas Portable Filtration Systems Market Opportunity Assessment, By Flow Rate, 2022 & 2032F | 9.3 Bahamas Portable Filtration Systems Market Opportunity Assessment, By Technology, 2022 & 2032F | 10 Bahamas Portable Filtration Systems Market - Competitive Landscape | 10.1 Bahamas Portable Filtration Systems Market Revenue Share, By Companies, 2025 | 10.2 Bahamas Portable Filtration Systems Market Competitive Benchmarking, By Operating and Technical Parameters |
11 Company Profiles |
12 Recommendations | 13 Disclaimer |
Global Go To Market Strategy - 2030
Export potential enables firms to identify high-growth global markets with greater confidence by combining advanced trade intelligence with a structured quantitative methodology. The framework analyzes emerging demand trends and country-level import patterns while integrating macroeconomic and trade datasets such as GDP and population forecasts, bilateral import–export flows, tariff structures, elasticity differentials between developed and developing economies, geographic distance, and import demand projections. Using weighted trade values from 2020–2024 as the base period to project country-to-country export potential for 2030, these inputs are operationalized through calculated drivers such as gravity model parameters, tariff impact factors, and projected GDP per-capita growth. Through an analysis of hidden potentials, demand hotspots, and market conditions that are most favorable to success, this method enables firms to focus on target countries, maximize returns, and global expansion with data, backed by accuracy.
By factoring in the projected importer demand gap that is currently unmet and could be potential opportunity, it identifies the potential for the Exporter (Country) among 190 countries, against the general trade analysis, which identifies the biggest importer or exporter.
To discover high-growth global markets and optimize your business strategy:
Click Here
Pricing
- Single User License$ 1,995
- Department License$ 2,400
- Site License$ 3,120
- Global License$ 3,795

Leadership Perspectives from Industry Events
Search
Thought Leadership and Analyst Meet


Our Clients
6WResearch In News
- India Export Attractiveness Tracker 2026
- India Air Conditioner Market Set for Strong Rebound in 2026 After Weather-Led Correction and GST-Driven Recovery: 6Wresearch
- ADAS in India: How Automatic Emergency Braking, Blind Spot Detection & Driver Monitoring are Transforming Road Safety
- Doha a strategic location for EV manufacturing hub: IPA Qatar
- Demand for luxury TVs surging in the GCC, says Samsung
- Empowering Growth: The Thriving Journey of Bangladesh’s Cable Industry
Latest Reports
- Nicaragua RPG Gaming Market (2026-2032)
- New Zealand RPG Gaming Market (2026-2032)
- Netherlands RPG Gaming Market (2026-2032)
- Nauru RPG Gaming Market (2026-2032)
- Namibia RPG Gaming Market (2026-2032)
- Mozambique RPG Gaming Market (2026-2032)
- Montenegro RPG Gaming Market (2026-2032)
- Mongolia RPG Gaming Market (2026-2032)
- Monaco RPG Gaming Market (2026-2032)
- Micronesia RPG Gaming Market (2026-2032)
Industry Events and Analyst Meet

EV India Expo 2026

HIMTEX 2026

India Refining Summit 2026

India EV Show 2026

EV tech India Expo 2026
Whitepaper
- Middle East & Africa Commercial Security Market Click here to view more.
- Middle East & Africa Fire Safety Systems & Equipment Market Click here to view more.
- GCC Drone Market Click here to view more.
- Middle East Lighting Fixture Market Click here to view more.
- GCC Physical & Perimeter Security Market Click here to view more.