Bahrain Digital Biomarkers Market Outlook | Value, Revenue, Analysis, Industry, Companies, Growth, Share, Forecast, Trends, Size & COVID-19 IMPACT
Market Forecast By Type (Wellness, Disease, Drugs), By Collection System Type (Wearables, Biosensors, Mobile Apps, Devices and Platforms, Desktop Based Software), By End-users (Pharmaceutical, Life Sciences, Medical Devices, App Vendors, Clinical Research Organizations), By Technology (Cloud Computing, Artificial Intelligence and Machine Learning, Augmented Reality, Blockchain) And Competitive Landscape
| Product Code: ETC072123 | Publication Date: Jul 2023 | Updated Date: Jun 2026 | Product Type: Report | |
| Publisher: 6Wresearch | Author: Ravi Bhandari | No. of Pages: 70 | No. of Figures: 35 | No. of Tables: 5 |
Australia Electric Vehicle Charging Infrastructure Market Size, Share & Growth Rate
The Australia Electric Vehicle Charging Infrastructure Market was estimated at USD 194 Million in 2025 and is projected to reach USD 229 Million by 2032, growing at a CAGR of 2.4% from 2026 to 2032. This gradual growth is underpinned by a rising demand for electric vehicles (EVs) as consumers become increasingly environmentally conscious. Additionally, government initiatives aimed at boosting EV adoption are fostering a supportive environment for charging infrastructure development across the country.
Bahrain Digital Biomarkers Market Growth Rate Analysis (2021-2032)
Australia Electric Vehicle Charging Infrastructure Market Growth Rate Analysis (2021-2032)
The Australia Electric Vehicle Charging Infrastructure market has experienced notable fluctuations over the past few years, reflecting an evolving landscape driven by technological advancements and shifting consumer preferences. Following a slight contraction of -0.3% in 2021, the market rebounded robustly with a growth of 5.5% in 2022, bolstered by heightened investments in infrastructure and favorable government policies promoting electric vehicle adoption. While growth rates moderated to 4.8% in 2023, forecasts suggest a gradual deceleration, with anticipated increases of 2.9% in 2024 and around 2.5% by 2030. This trend underscores a stabilizing demand as consumer enthusiasm matures, alongside increasing competition among charging networks and ongoing energy transition initiatives aimed at enhancing sustainability in urban settings.
Australia Electric Vehicle Charging Infrastructure Market Year-wise Growth Rate and Key Drivers
This graph highlights how the Australia Electric Vehicle Charging Infrastructure Market has steadily grown over the past five years, supported by major growth factors.
The table below presents the year‑wise growth rates along with the key drivers influencing the market
| Year | Growth Rate | Major Drivers |
| 2021 | -0.3% | Weak activity constrained sales |
| 2022 | 5.5% | Government incentives encouraged adoption |
| 2023 | 4.8% | Infrastructure investments enhanced accessibility |
| 2024 | 2.9% | Consumer demand for EVs increased |
| 2025 | 2.3% | Partnerships expanded charging networks |
| 2026 | 2.8% | Technological advancements improved efficiency |
| 2027 | 2.4% | Public awareness campaigns drove interest |
| 2028 | 2.7% | Sustainability initiatives promoted usage |
| 2029 | 2.8% | Urban development supported infrastructure growth |
| 2030 | 2.5% | Corporate fleets transitioned to EVs |
| 2031 | 3.0% | Innovative charging solutions emerged rapidly |
| 2032 | 2.9% | Integration with renewable energy sources |
Note - Market size estimations and growth projections presented in this report are based on 6Wresearch’s advanced forecasting approach, validated with industry datasets as of June 2026.
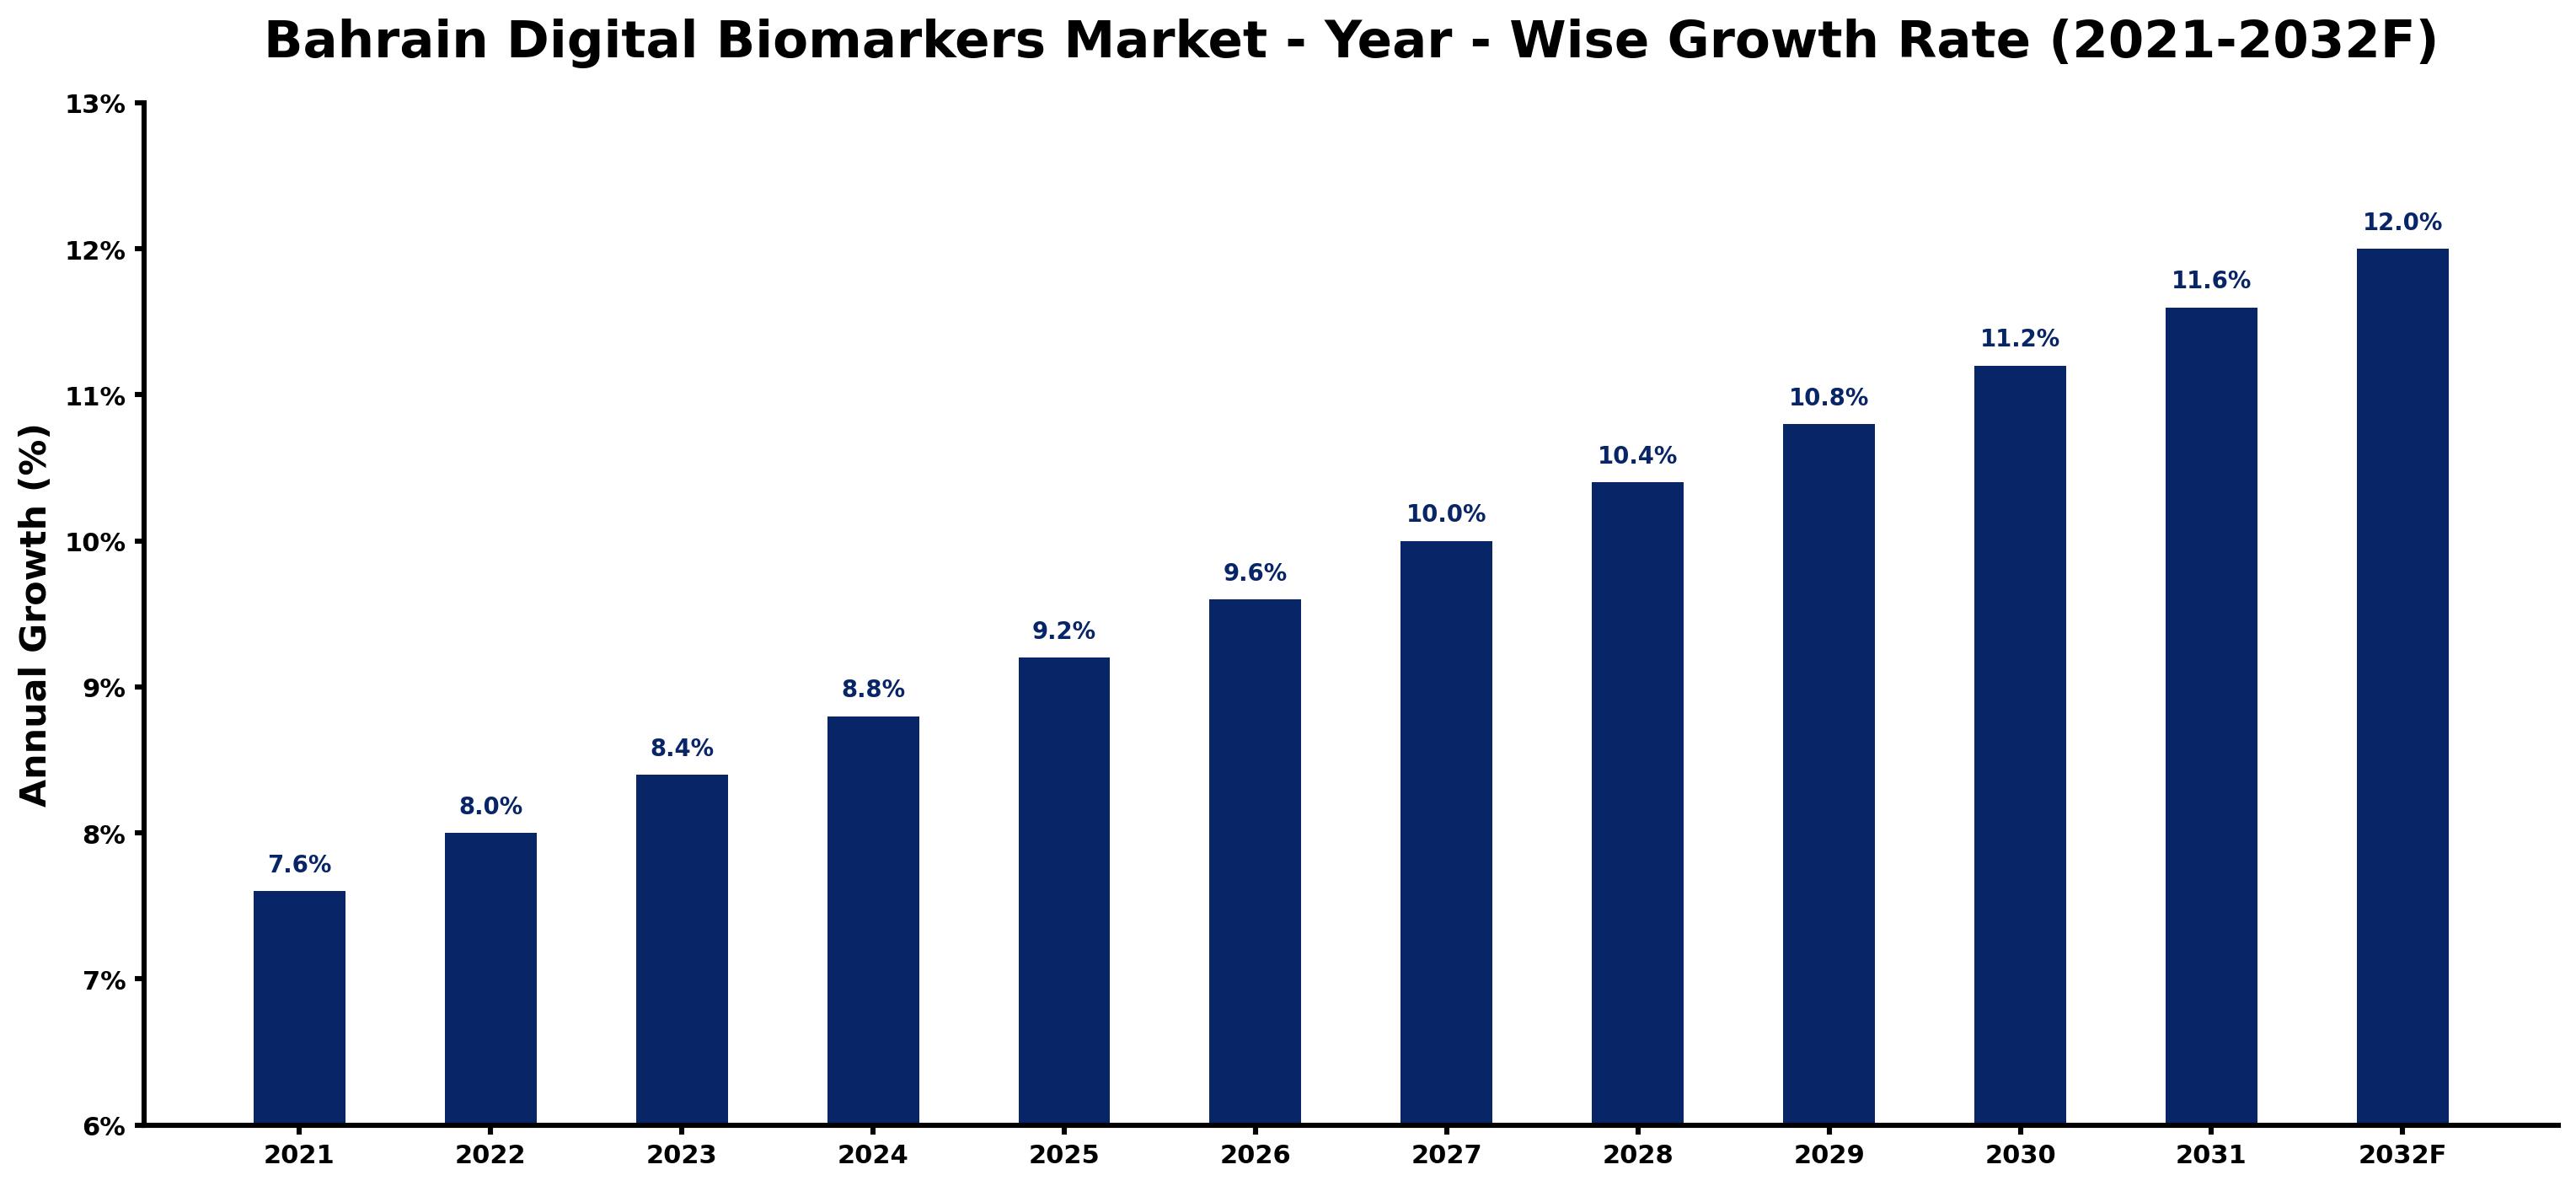
The Bahrain Digital Biomarkers Market is experiencing robust growth, starting with a 7.6% increase in 2021, and projected to escalate to 12.0% by 2032. Factors fueling this upward trend include the rising demand for personalized healthcare solutions and advancements in digital health technologies. Specifically, the integration of artificial intelligence in data analysis is enhancing the accuracy of biomarkers, attracting significant investments. Additionally, supportive government policies aimed at digitizing healthcare infrastructure are fostering a conducive environment for innovation. As consumers increasingly prioritize health monitoring, the market is set to benefit from expanding applications and a growing emphasis on preventive care, ensuring sustained growth through the next decade.
Bahrain Digital Biomarkers Market Year-wise Growth Rate and Key Drivers
This graph highlights how the Bahrain Digital Biomarkers Market has steadily grown over the past five years, supported by major growth factors.
The table below presents the year‑wise growth rates along with the key drivers influencing the market
| Year | Growth Rate | Major Drivers |
| 2021 | 7.6% | Increasing smart city development projects |
| 2022 | 8.0% | Growing renewable energy integration projects |
| 2023 | 8.4% | Rising electricity demand across industries |
| 2024 | 8.8% | Growing renewable energy integration projects |
| 2025 | 9.2% | Increasing smart city development projects |
| 2026 | 9.6% | Expansion of transportation and logistics networks |
| 2027 | 10.0% | Increasing industrial automation investments |
| 2028 | 10.4% | Rapid growth in telecom and data center sectors |
| 2029 | 10.8% | Increasing industrial infrastructure investments |
| 2030 | 11.2% | Increasing industrial automation investments |
| 2031 | 11.6% | Growing renewable energy integration projects |
| 2032 | 12.0% | Expansion of commercial construction activities |
Note - Market size estimations and growth projections presented in this report are based on 6Wresearch’s advanced forecasting approach, validated with industry datasets as of June 2026.
Australia Electric Vehicle Charging Infrastructure Market Synopsis
As Australia transitions towards a greener economy, the need for robust EV charging infrastructure is more pressing than ever. With urban centers expanding and the push for sustainable transport solutions gaining momentum, the market is witnessing a surge in demand for both public and private charging stations.
Furthermore, the Australian government is investing in various programs aimed at enhancing EV charging networks, particularly in metropolitan and regional areas. This is not only promoting the adoption of electric vehicles but also addressing range anxiety among potential EV users, thereby stimulating further growth in the charging infrastructure market.
Australia Electric Vehicle Charging Infrastructure Market Key Takeaways
- Significant growth driven by increased EV adoption and supportive government policies.
- Development of charging infrastructure is becoming a priority in urban planning.
- Technological advancements are enhancing the efficiency and accessibility of charging solutions.
- Increased consumer awareness regarding environmental sustainability is propelling market demand.
- Partnerships between private and public sectors are crucial for expanding charging networks.
Evaluation of Restraints in Australia Electric Vehicle Charging Infrastructure Market
Despite the positive outlook for the Australia Electric Vehicle Charging Infrastructure Market, there are notable constraints that could hinder its progress. One major concern is the high initial investment associated with establishing a comprehensive charging network, particularly in rural or less populated areas where demand may be uncertain. Additionally, the pace of technological advancement can lead to disparities in infrastructure that may not keep up with the evolving requirements of electric vehicles. Regulatory complexities and inconsistencies in standards across states could further complicate the rollout of charging stations, potentially slowing growth.
Australia Electric Vehicle Charging Infrastructure Market Trends
Emerging trends within the Australia Electric Vehicle Charging Infrastructure Market include the rise of fast-charging stations that significantly reduce downtime for EV users. As battery technology continues to improve, the demand for ultra-fast charging solutions is likely to accelerate. Furthermore, smart charging technologies that integrate with renewable energy sources are becoming more prevalent, enabling users to charge their vehicles when energy costs are lowest. This trend towards a sustainable charging ecosystem aligns with broader governmental goals for carbon neutrality.
Australia Electric Vehicle Charging Infrastructure Market Opportunities
Significant opportunities exist in expanding charging infrastructure in underserved regions, where the current network is limited. The development of workplace charging solutions represents another promising avenue, as businesses increasingly recognize the value of offering charging facilities to employees. Additionally, investment in public-private partnerships could enhance infrastructure, ensuring faster and more widespread availability of charging stations, thus stimulating market growth further.
Government Initiatives in the Australia Electric Vehicle Charging Infrastructure Market
The Australian government is actively promoting electric vehicle adoption through various initiatives aimed at expanding charging infrastructure. Policies include grants and incentives for businesses and local councils to install charging stations. Furthermore, the government is supporting research and development projects focused on enhancing charging technology. These measures are designed to alleviate consumer concerns about range and charging convenience, thus accelerating the transition to electric mobility.
Future Insights of the Australia Electric Vehicle Charging Infrastructure Market
Looking ahead to 2026-2032, the Australia Electric Vehicle Charging Infrastructure Market is poised for gradual expansion, driven by increasing vehicle electrification and a stronger regulatory framework. The integration of renewable energy into charging networks is likely to become more pronounced, promoting sustainable practices and enhancing grid efficiency. As the infrastructure matures, consumer adoption is expected to rise, paving the way for a more interconnected and sustainable transportation system.
Australia Electric Vehicle Charging Infrastructure Market Latest Developments (May 2025 - June 2026)
Recently, there has been a notable increase in pilot projects aimed at enhancing EV charging infrastructure across urban areas in Australia. Collaborations between local governments and tech companies are emerging to deploy advanced charging solutions that offer improved user experience and accessibility. Additionally, there are ongoing discussions about standardizing charging technologies to facilitate smoother integration within various regions.
Australia Electric Vehicle Charging Infrastructure Market - Key Attractiveness of the Report
- 10 Years of Market Numbers
- Historical Data Starting from 2022 to 2025
- Base Year: 2025
- Forecast Data until 2032
- Key Performance Indicators Impacting the Market
- Major Upcoming Developments and Projects
Key Highlights of the Report:
- Bahrain Digital Biomarkers Market Outlook
- Market Size of Bahrain Digital Biomarkers Market, 2025
- Forecast of Bahrain Digital Biomarkers Market, 2032F
- Historical Data and Forecast of Bahrain Digital Biomarkers Revenues & Volume for the Period 2022-2032F
- Bahrain Digital Biomarkers Market Trend Evolution
- Bahrain Digital Biomarkers Market Drivers and Challenges
- Bahrain Digital Biomarkers Price Trends
- Bahrain Digital Biomarkers Porter's Five Forces
- Bahrain Digital Biomarkers Industry Life Cycle
- Historical Data and Forecast of Bahrain Digital Biomarkers Market Revenues & Volume By Type for the Period 2022-2032F
- Historical Data and Forecast of Bahrain Digital Biomarkers Market Revenues & Volume By Wellness for the Period 2022-2032F
- Historical Data and Forecast of Bahrain Digital Biomarkers Market Revenues & Volume By Disease for the Period 2022-2032F
- Historical Data and Forecast of Bahrain Digital Biomarkers Market Revenues & Volume By Drugs for the Period 2022-2032F
- Historical Data and Forecast of Bahrain Digital Biomarkers Market Revenues & Volume By Collection System Type for the Period 2022-2032F
- Historical Data and Forecast of Bahrain Digital Biomarkers Market Revenues & Volume By Wearables for the Period 2022-2032F
- Historical Data and Forecast of Bahrain Digital Biomarkers Market Revenues & Volume By Biosensors for the Period 2022-2032F
- Historical Data and Forecast of Bahrain Digital Biomarkers Market Revenues & Volume By Mobile Apps for the Period 2022-2032F
- Historical Data and Forecast of Bahrain Digital Biomarkers Market Revenues & Volume By Devices and Platforms for the Period 2022-2032F
- Historical Data and Forecast of Bahrain Digital Biomarkers Market Revenues & Volume By Desktop Based Software for the Period 2022-2032F
- Historical Data and Forecast of Bahrain Digital Biomarkers Market Revenues & Volume By End-users for the Period 2022-2032F
- Historical Data and Forecast of Bahrain Digital Biomarkers Market Revenues & Volume By Pharmaceutical for the Period 2022-2032F
- Historical Data and Forecast of Bahrain Digital Biomarkers Market Revenues & Volume By Life Sciences for the Period 2022-2032F
- Historical Data and Forecast of Bahrain Digital Biomarkers Market Revenues & Volume By Medical Devices for the Period 2022-2032F
- Historical Data and Forecast of Bahrain Digital Biomarkers Market Revenues & Volume By App Vendors for the Period 2022-2032F
- Historical Data and Forecast of Bahrain Digital Biomarkers Market Revenues & Volume By Clinical Research Organizations for the Period 2022-2032F
- Historical Data and Forecast of Bahrain Digital Biomarkers Market Revenues & Volume By Technology for the Period 2022-2032F
- Historical Data and Forecast of Bahrain Digital Biomarkers Market Revenues & Volume By Cloud Computing for the Period 2022-2032F
- Historical Data and Forecast of Bahrain Digital Biomarkers Market Revenues & Volume By Artificial Intelligence and Machine Learning for the Period 2022-2032F
- Historical Data and Forecast of Bahrain Digital Biomarkers Market Revenues & Volume By Augmented Reality for the Period 2022-2032F
- Historical Data and Forecast of Bahrain Digital Biomarkers Market Revenues & Volume By Blockchain for the Period 2022-2032F
- Bahrain Digital Biomarkers Import Export Trade Statistics
- Market Opportunity Assessment By Type
- Market Opportunity Assessment By Collection System Type
- Market Opportunity Assessment By End-users
- Market Opportunity Assessment By Technology
- Bahrain Digital Biomarkers Top Companies Market Share
- Bahrain Digital Biomarkers Competitive Benchmarking By Technical and Operational Parameters
- Bahrain Digital Biomarkers Company Profiles
- Bahrain Digital Biomarkers Key Strategic Recommendations
Frequently Asked Questions About the Market Study (FAQs):
The market was estimated at USD 194 Million in 2025 and is projected to reach USD 229 Million by 2032, reflecting significant growth potential.
Government initiatives are crucial in funding and incentivizing the expansion of EV charging stations, facilitating faster adoption of electric vehicles.
Innovations in fast-charging technology and smart grid integration are enhancing the convenience and efficiency of charging solutions.
Urban areas are seeing a surge in demand, especially as more businesses and residential developments incorporate charging stations.
High upfront costs and regulatory hurdles present significant challenges for widespread infrastructure rollout, particularly in rural areas.
6Wresearch actively monitors the Bahrain Digital Biomarkers Market and publishes its comprehensive annual report, highlighting emerging trends, growth drivers, revenue analysis, and forecast outlook. Our insights help businesses to make data-backed strategic decisions with ongoing market dynamics. Our analysts track relevent industries related to the Bahrain Digital Biomarkers Market, allowing our clients with actionable intelligence and reliable forecasts tailored to emerging regional needs.
Yes, we provide customisation as per your requirements. To learn more, feel free to contact us on sales@6wresearch.com
1 Executive Summary |
2 Introduction |
2.1 Key Highlights of the Report |
2.2 Report Description |
2.3 Market Scope & Segmentation |
2.4 Research Methodology |
2.5 Assumptions |
3 Bahrain Digital Biomarkers Market Overview |
3.1 Bahrain Country Macro Economic Indicators |
3.2 Bahrain Digital Biomarkers Market Revenues & Volume, 2022 & 2032F |
3.3 Bahrain Digital Biomarkers Market - Industry Life Cycle |
3.4 Bahrain Digital Biomarkers Market - Porter's Five Forces |
3.5 Bahrain Digital Biomarkers Market Revenues & Volume Share, By Type, 2022 & 2032F |
3.6 Bahrain Digital Biomarkers Market Revenues & Volume Share, By Collection System Type, 2022 & 2032F |
3.7 Bahrain Digital Biomarkers Market Revenues & Volume Share, By End-users, 2022 & 2032F |
3.8 Bahrain Digital Biomarkers Market Revenues & Volume Share, By Technology, 2022 & 2032F |
4 Bahrain Digital Biomarkers Market Dynamics |
4.1 Impact Analysis |
4.2 Market Drivers |
4.3 Market Restraints |
5 Bahrain Digital Biomarkers Market Trends |
6 Bahrain Digital Biomarkers Market, By Types |
6.1 Bahrain Digital Biomarkers Market, By Type |
6.1.1 Overview and Analysis |
6.1.2 Bahrain Digital Biomarkers Market Revenues & Volume, By Type, 2022-2032F |
6.1.3 Bahrain Digital Biomarkers Market Revenues & Volume, By Wellness, 2022-2032F |
6.1.4 Bahrain Digital Biomarkers Market Revenues & Volume, By Disease, 2022-2032F |
6.1.5 Bahrain Digital Biomarkers Market Revenues & Volume, By Drugs, 2022-2032F |
6.2 Bahrain Digital Biomarkers Market, By Collection System Type |
6.2.1 Overview and Analysis |
6.2.2 Bahrain Digital Biomarkers Market Revenues & Volume, By Wearables, 2022-2032F |
6.2.3 Bahrain Digital Biomarkers Market Revenues & Volume, By Biosensors, 2022-2032F |
6.2.4 Bahrain Digital Biomarkers Market Revenues & Volume, By Mobile Apps, 2022-2032F |
6.2.5 Bahrain Digital Biomarkers Market Revenues & Volume, By Devices and Platforms, 2022-2032F |
6.2.6 Bahrain Digital Biomarkers Market Revenues & Volume, By Desktop Based Software, 2022-2032F |
6.3 Bahrain Digital Biomarkers Market, By End-users |
6.3.1 Overview and Analysis |
6.3.2 Bahrain Digital Biomarkers Market Revenues & Volume, By Pharmaceutical, 2022-2032F |
6.3.3 Bahrain Digital Biomarkers Market Revenues & Volume, By Life Sciences, 2022-2032F |
6.3.4 Bahrain Digital Biomarkers Market Revenues & Volume, By Medical Devices, 2022-2032F |
6.3.5 Bahrain Digital Biomarkers Market Revenues & Volume, By App Vendors, 2022-2032F |
6.3.6 Bahrain Digital Biomarkers Market Revenues & Volume, By Clinical Research Organizations, 2022-2032F |
6.4 Bahrain Digital Biomarkers Market, By Technology |
6.4.1 Overview and Analysis |
6.4.2 Bahrain Digital Biomarkers Market Revenues & Volume, By Cloud Computing, 2022-2032F |
6.4.3 Bahrain Digital Biomarkers Market Revenues & Volume, By Artificial Intelligence and Machine Learning, 2022-2032F |
6.4.4 Bahrain Digital Biomarkers Market Revenues & Volume, By Augmented Reality, 2022-2032F |
6.4.5 Bahrain Digital Biomarkers Market Revenues & Volume, By Blockchain, 2022-2032F |
7 Bahrain Digital Biomarkers Market Import-Export Trade Statistics |
7.1 Bahrain Digital Biomarkers Market Export to Major Countries |
7.2 Bahrain Digital Biomarkers Market Imports from Major Countries |
8 Bahrain Digital Biomarkers Market Key Performance Indicators |
9 Bahrain Digital Biomarkers Market - Opportunity Assessment |
9.1 Bahrain Digital Biomarkers Market Opportunity Assessment, By Type, 2022 & 2032F |
9.2 Bahrain Digital Biomarkers Market Opportunity Assessment, By Collection System Type, 2022 & 2032F |
9.3 Bahrain Digital Biomarkers Market Opportunity Assessment, By End-users, 2022 & 2032F |
9.4 Bahrain Digital Biomarkers Market Opportunity Assessment, By Technology, 2022 & 2032F |
10 Bahrain Digital Biomarkers Market - Competitive Landscape |
10.1 Bahrain Digital Biomarkers Market Revenue Share, By Companies, 2025 |
10.2 Bahrain Digital Biomarkers Market Competitive Benchmarking, By Operating and Technical Parameters |
11 Company Profiles |
12 Recommendations |
13 Disclaimer |
Global Go To Market Strategy - 2030
Export potential enables firms to identify high-growth global markets with greater confidence by combining advanced trade intelligence with a structured quantitative methodology. The framework analyzes emerging demand trends and country-level import patterns while integrating macroeconomic and trade datasets such as GDP and population forecasts, bilateral import–export flows, tariff structures, elasticity differentials between developed and developing economies, geographic distance, and import demand projections. Using weighted trade values from 2020–2024 as the base period to project country-to-country export potential for 2030, these inputs are operationalized through calculated drivers such as gravity model parameters, tariff impact factors, and projected GDP per-capita growth. Through an analysis of hidden potentials, demand hotspots, and market conditions that are most favorable to success, this method enables firms to focus on target countries, maximize returns, and global expansion with data, backed by accuracy.
By factoring in the projected importer demand gap that is currently unmet and could be potential opportunity, it identifies the potential for the Exporter (Country) among 190 countries, against the general trade analysis, which identifies the biggest importer or exporter.
To discover high-growth global markets and optimize your business strategy:
Click Here
Pricing
- Single User License$ 1,995
- Department License$ 2,400
- Site License$ 3,120
- Global License$ 3,795

Leadership Perspectives from Industry Events
Search
Thought Leadership and Analyst Meet


Our Clients
6WResearch In News
- India Air Conditioner Market Set for Strong Rebound in 2026 After Weather-Led Correction and GST-Driven Recovery: 6Wresearch
- ADAS in India: How Automatic Emergency Braking, Blind Spot Detection & Driver Monitoring are Transforming Road Safety
- Doha a strategic location for EV manufacturing hub: IPA Qatar
- Demand for luxury TVs surging in the GCC, says Samsung
- Empowering Growth: The Thriving Journey of Bangladesh’s Cable Industry
- Demand for luxury TVs surging in the GCC, says Samsung
Latest Reports
- Nicaragua RPG Gaming Market (2026-2032)
- New Zealand RPG Gaming Market (2026-2032)
- Netherlands RPG Gaming Market (2026-2032)
- Nauru RPG Gaming Market (2026-2032)
- Namibia RPG Gaming Market (2026-2032)
- Mozambique RPG Gaming Market (2026-2032)
- Montenegro RPG Gaming Market (2026-2032)
- Mongolia RPG Gaming Market (2026-2032)
- Monaco RPG Gaming Market (2026-2032)
- Micronesia RPG Gaming Market (2026-2032)
Industry Events and Analyst Meet

EV India Expo 2026

HIMTEX 2026

India Refining Summit 2026

India EV Show 2026

EV tech India Expo 2026
Whitepaper
- Middle East & Africa Commercial Security Market Click here to view more.
- Middle East & Africa Fire Safety Systems & Equipment Market Click here to view more.
- GCC Drone Market Click here to view more.
- Middle East Lighting Fixture Market Click here to view more.
- GCC Physical & Perimeter Security Market Click here to view more.